

Key Insights
The global Computer-Aided Engineering (CAE) software market is poised for substantial growth, projected to reach $12.05 billion in 2025, with a robust Compound Annual Growth Rate (CAGR) of 10.1% expected to continue through the forecast period of 2025-2033. This significant expansion is largely propelled by the increasing demand for advanced simulation and analysis tools across a wide spectrum of industries. Key drivers include the relentless pursuit of product innovation and optimization, the necessity for reduced physical prototyping, and the growing emphasis on virtual testing to enhance product performance, safety, and efficiency. Industries such as automotive, aerospace, and manufacturing are increasingly integrating CAE software into their design and development workflows to gain a competitive edge, minimize development cycles, and reduce operational costs. The shift towards digitalization and Industry 4.0 principles further fuels this adoption, as businesses recognize the critical role of simulation in achieving smarter manufacturing and better product lifecycle management.
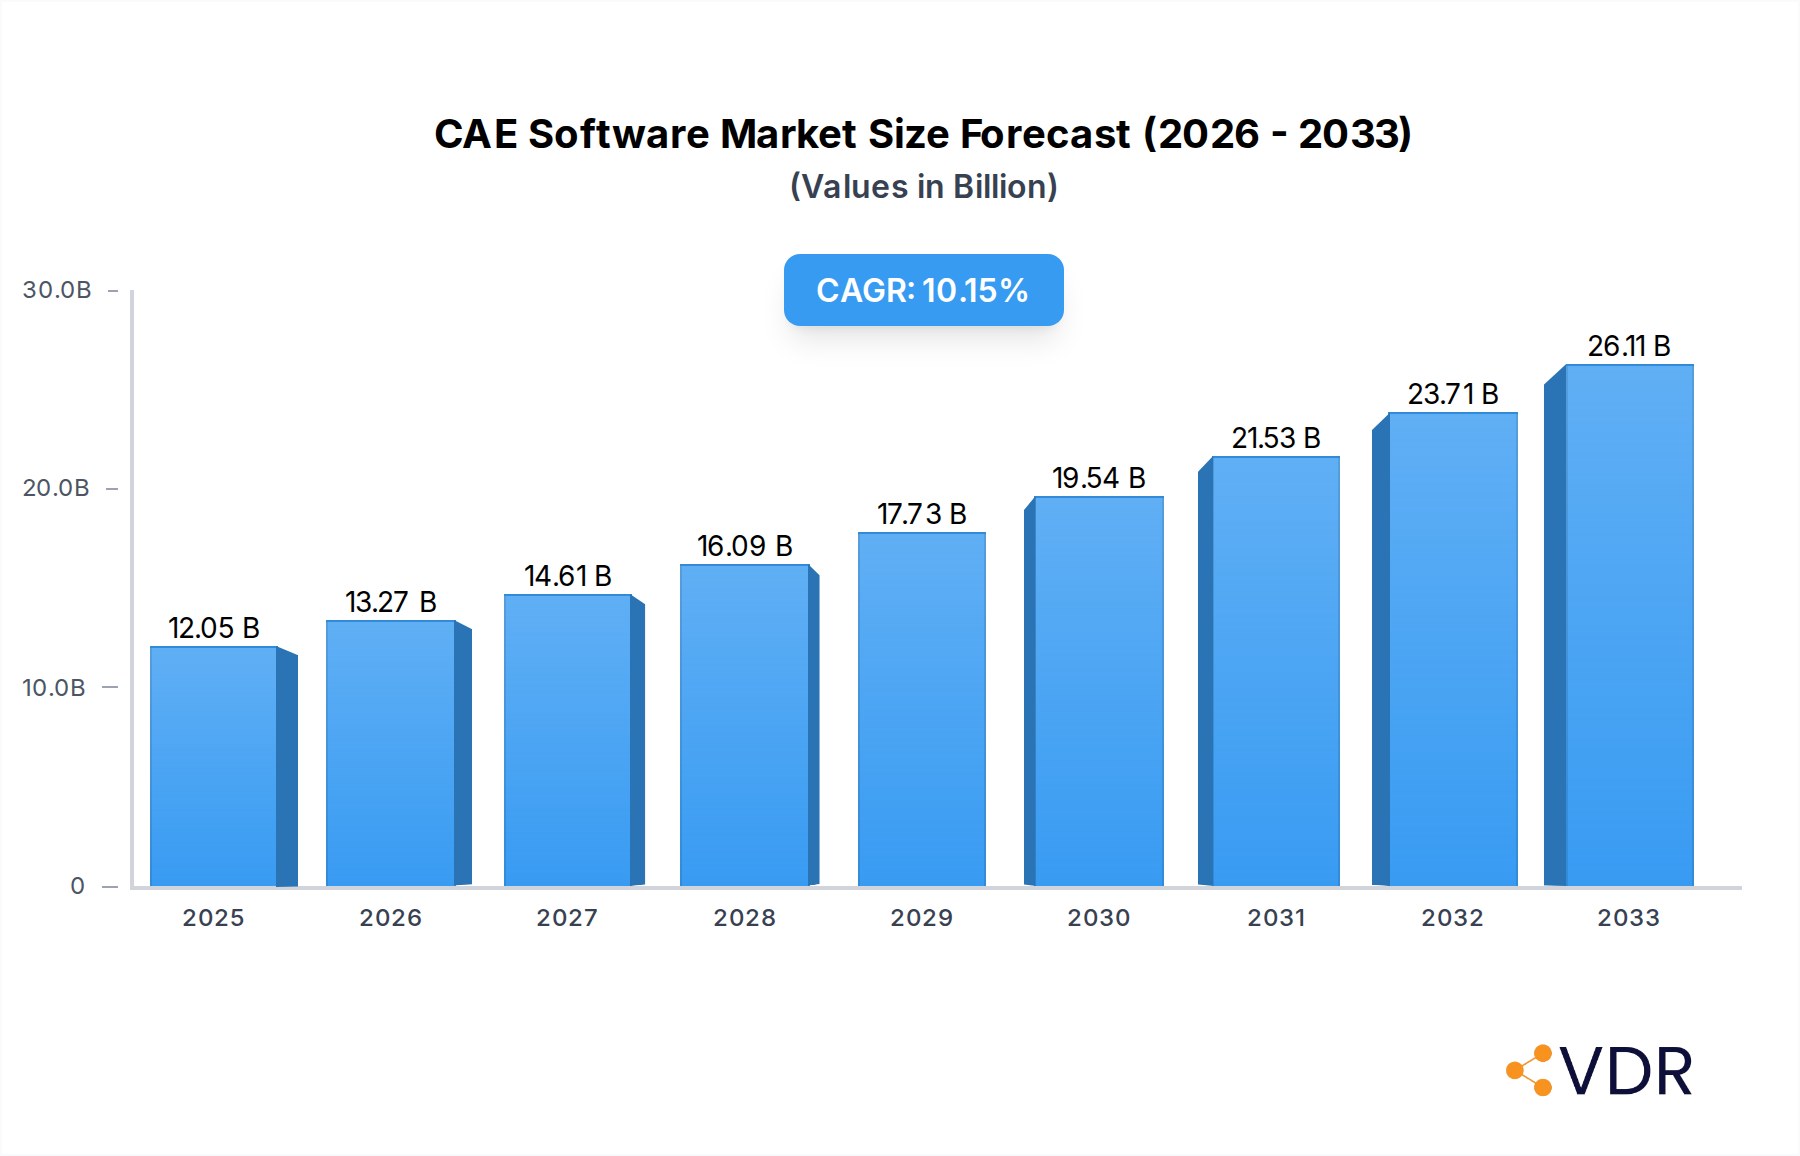
CAE Software Market Size (In Billion)
The market is characterized by a diverse range of applications, with the Machine Tool Industry, Automobile & Train Industry, and Aerospace & Defense Industry standing out as major consumers. The evolution towards multi-functional CAE solutions that offer integrated simulation capabilities across various physics domains is a prominent trend, enabling more comprehensive and accurate analyses. While the market enjoys strong growth, potential restraints could emerge from the high initial investment costs associated with advanced CAE software and the need for specialized expertise to operate these complex tools effectively. However, the increasing availability of cloud-based CAE solutions and the ongoing development of user-friendly interfaces are expected to mitigate these challenges. Leading companies like Siemens PLM Software, ANSYS, and Dassault Systèmes are at the forefront of innovation, continuously introducing sophisticated software to meet the evolving needs of the global CAE market.

CAE Software Company Market Share
This in-depth report provides a definitive analysis of the global CAE software market, a critical technology enabling virtual prototyping and simulation across diverse industries. Spanning the historical period from 2019 to 2024 and projecting future growth through 2033, with a base year of 2025, this report offers unparalleled insights into market dynamics, growth trends, regional dominance, product innovation, and key strategic factors. Leveraging advanced analytical methodologies, this report serves as an essential resource for stakeholders seeking to understand and capitalize on the evolving computer-aided engineering software market.
CAE Software Market Dynamics & Structure
The global CAE software market is characterized by a moderately concentrated structure, with leading players like Siemens PLM Software, ANSYS, and Dassault Systèmes holding significant market share. Technological innovation remains the primary driver, fueled by advancements in computing power, artificial intelligence, and cloud-based simulation platforms. Regulatory frameworks, while generally supportive of innovation, can impose compliance requirements in highly regulated sectors like aerospace and defense. Competitive product substitutes, primarily manual testing and traditional design methods, are increasingly being displaced by the efficiency and accuracy of CAE solutions. End-user demographics are shifting towards a greater demand for user-friendly interfaces and integrated workflows, particularly among small and medium-sized enterprises (SMEs). Mergers and acquisitions (M&A) trends indicate strategic consolidation, aimed at expanding product portfolios and market reach. For instance, the historical period saw several key acquisitions, contributing to the current market landscape.
- Market Concentration: Dominated by a few key players, but with growing opportunities for specialized niche providers.
- Technological Innovation Drivers: Increased computational power, AI-driven simulation optimization, cloud deployment, and enhanced user experience.
- Regulatory Frameworks: Growing emphasis on data security, interoperability standards, and compliance in critical industries.
- Competitive Product Substitutes: Traditional physical testing, manual analysis, and less advanced CAD tools.
- End-User Demographics: Growing demand from SMEs, increasing adoption in emerging economies, and a need for specialized simulation capabilities.
- M&A Trends: Strategic acquisitions to broaden solution offerings, gain access to new technologies, and consolidate market positions.
CAE Software Growth Trends & Insights
The CAE software market size is poised for significant expansion, driven by the increasing demand for virtual testing and validation across the product development lifecycle. Projections indicate a robust Compound Annual Growth Rate (CAGR) from 2025 to 2033, translating to a substantial market valuation in billions of U.S. dollars. The adoption rates of CAE solutions are accelerating, propelled by the need to reduce physical prototyping costs, shorten time-to-market, and improve product performance and reliability. Technological disruptions, such as the integration of machine learning for predictive maintenance and generative design, are transforming simulation capabilities and opening new avenues for innovation. Consumer behavior shifts, including a greater emphasis on sustainability and advanced functionality in manufactured goods, are further bolstering the demand for sophisticated CAE tools. The market penetration of CAE software is expected to deepen across all major industries, from automotive and aerospace to healthcare and consumer electronics, as organizations recognize its strategic value in achieving competitive advantage. The base year valuation is estimated at $XX.XX billion, with the forecast period anticipating growth to $YY.YY billion by 2033.
Dominant Regions, Countries, or Segments in CAE Software
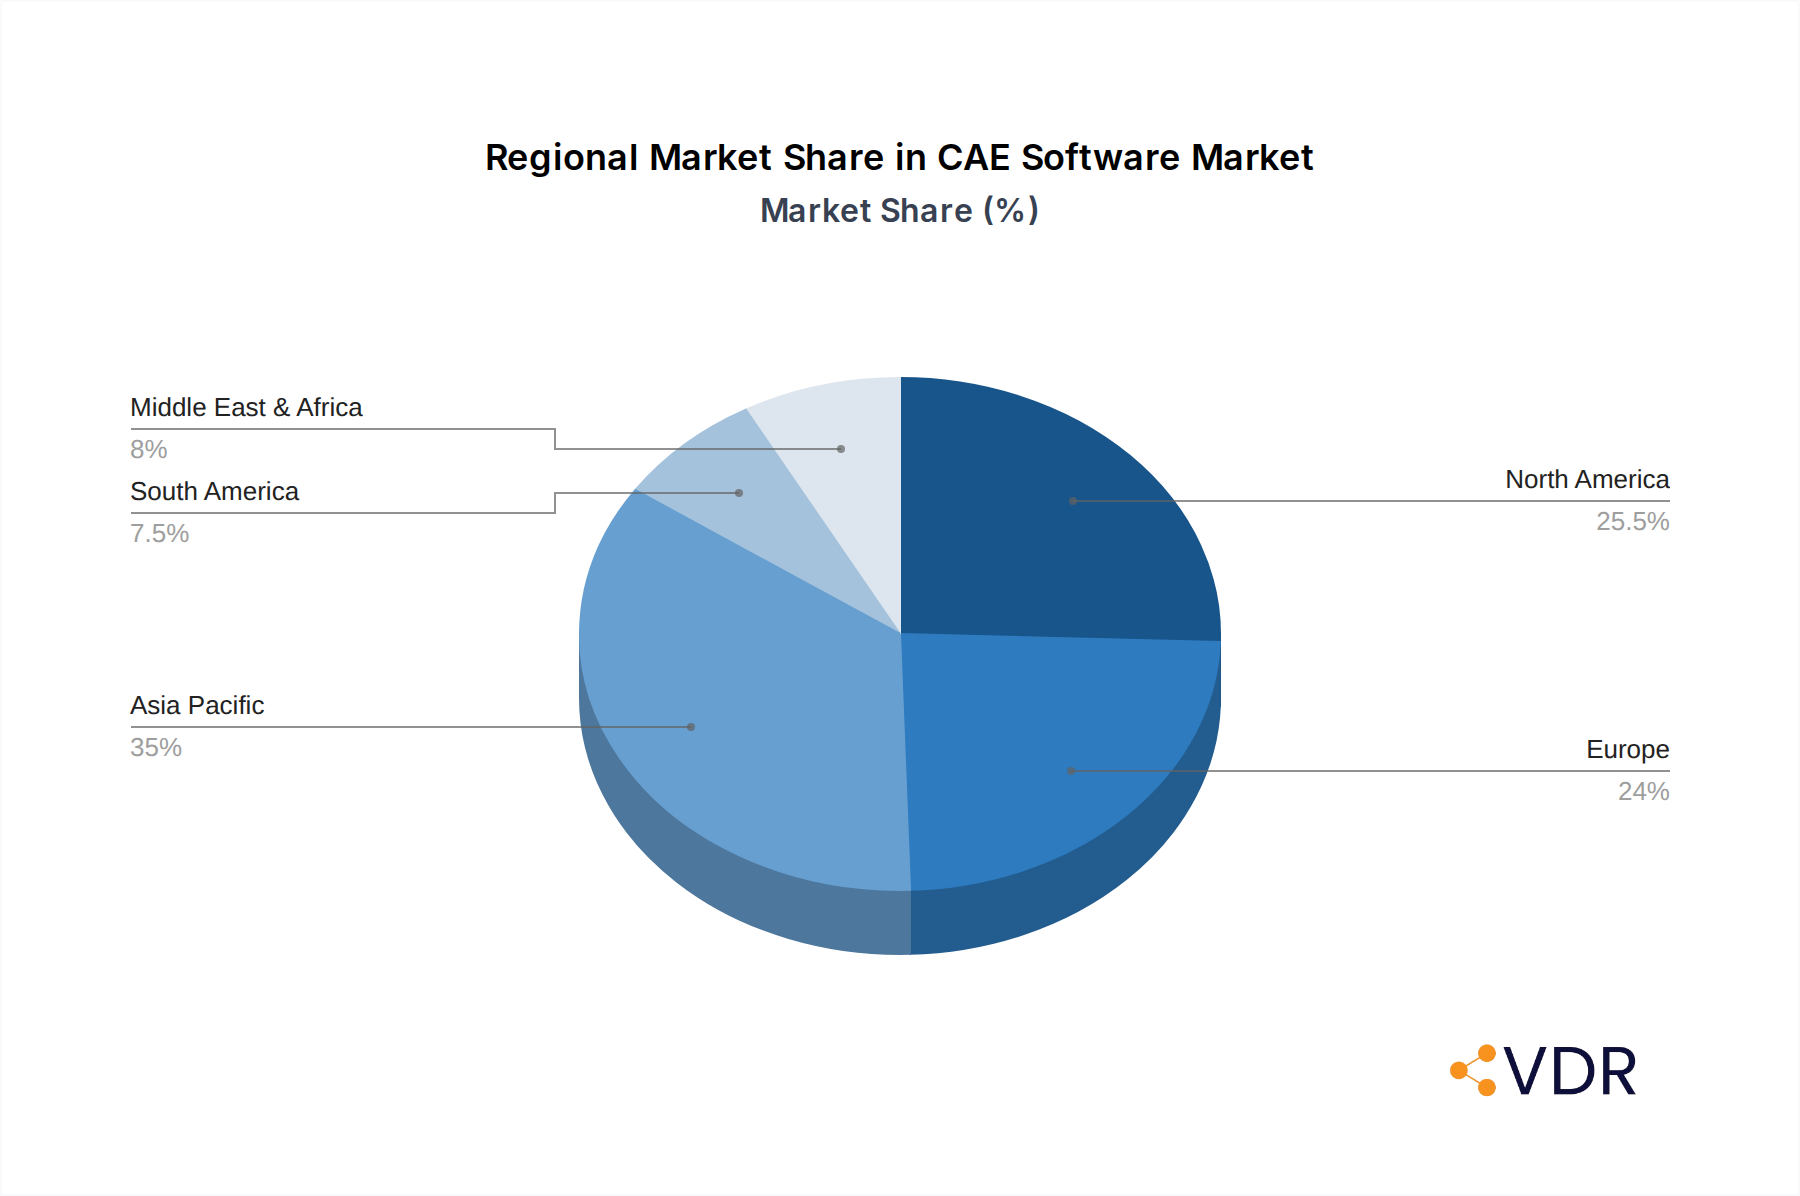
The Automobile & Train Industry segment stands as a dominant force in the global CAE software market, driven by the relentless pursuit of lighter, safer, and more fuel-efficient vehicles. The stringent safety regulations and complex engineering challenges inherent in automotive design necessitate extensive use of simulation for crash testing, structural analysis, thermal management, and electromagnetics. Similarly, the burgeoning high-speed rail sector is increasingly leveraging CAE for structural integrity, vibration analysis, and aerodynamic performance. North America and Europe currently lead in market share, owing to their established automotive manufacturing bases and robust R&D investments. However, the Asia-Pacific region, particularly China, is rapidly emerging as a growth powerhouse, fueled by its massive automotive production and the increasing adoption of advanced manufacturing technologies.
Within the Types of CAE software, Multi Functional solutions are witnessing higher adoption rates. These comprehensive platforms offer a broad spectrum of simulation capabilities, catering to diverse engineering needs and reducing the complexity of managing multiple specialized software packages. This trend is particularly evident in the Automobile & Train Industry, where integrated simulation workflows are paramount.
- Application Dominance: Automobile & Train Industry leads due to extensive simulation needs for safety, performance, and efficiency.
- Regional Leadership: North America and Europe currently hold the largest market share, with Asia-Pacific showing the fastest growth trajectory.
- Segment Growth Drivers (Automobile & Train):
- Stringent safety regulations and autonomous driving development.
- Electrification of vehicles and battery thermal management.
- Demand for lightweight materials and advanced manufacturing techniques.
- Infrastructure development in high-speed rail networks.
- Type Dominance: Multi Functional CAE software preferred for integrated workflows and broader application.
- Market Share Contribution (Automobile & Train): Estimated at over 35% of the total CAE software market.
- Growth Potential: Significant opportunities in emerging economies and for specialized simulation modules addressing new mobility trends.
CAE Software Product Landscape
The CAE software product landscape is characterized by continuous innovation, with a focus on enhancing simulation accuracy, speed, and user accessibility. Key product advancements include the development of AI-powered solvers that optimize simulation workflows and reduce computational time. Applications are expanding beyond traditional structural and fluid dynamics to encompass complex multiphysics phenomena, such as coupled thermal-structural analysis and fluid-structure interaction. Performance metrics are consistently improving, with newer versions offering faster processing speeds, increased model complexity handling, and more intuitive visualization tools. Unique selling propositions often lie in specialized modules tailored for specific industries, such as crash simulation for automotive or aeroelasticity for aerospace. Technological advancements are also driving the integration of CAE with other digital tools, creating a more cohesive product development ecosystem.
Key Drivers, Barriers & Challenges in CAE Software
The global CAE software market is propelled by several key drivers. Technological advancements in computing power and algorithms are enabling more complex and accurate simulations. The escalating need to reduce product development costs and time-to-market is a significant catalyst, as virtual prototyping significantly minimizes the need for expensive physical prototypes. Furthermore, stringent regulatory requirements in industries like automotive and aerospace necessitate rigorous virtual testing and validation.
However, the market faces several barriers and challenges. The high initial cost of some sophisticated CAE software licenses and the need for specialized training can be prohibitive for smaller enterprises. The integration of CAE tools with existing enterprise systems can also be complex and time-consuming. Supply chain issues, while less direct, can impact hardware availability for high-performance computing required for intensive simulations. Competitive pressures from established players offering comprehensive suites and emerging niche providers focusing on specific functionalities also present challenges.
Emerging Opportunities in CAE Software
Emerging opportunities in the CAE software industry are abundant, driven by new technological frontiers and evolving industry needs. The burgeoning field of additive manufacturing (3D printing) presents a significant opportunity, as CAE is crucial for optimizing print parameters, predicting material behavior during the printing process, and ensuring the structural integrity of printed parts. The growing adoption of the Internet of Things (IoT) is creating demand for simulation tools that can predict the performance of connected devices in real-world environments and optimize their energy consumption. Furthermore, the development of digital twins, virtual replicas of physical assets, relies heavily on continuous CAE simulation to monitor and predict performance, maintenance needs, and operational efficiency. Untapped markets in sectors like renewable energy, sustainable agriculture, and advanced materials research also offer fertile ground for CAE solution providers.
Growth Accelerators in the CAE Software Industry
Several factors are acting as growth accelerators for the CAE software industry. The relentless pursuit of digital transformation across all sectors is pushing organizations to adopt advanced simulation technologies to gain a competitive edge. Strategic partnerships between software vendors and hardware providers are enhancing the performance and accessibility of CAE solutions, particularly through cloud-based platforms. The increasing availability of skilled engineering talent adept at using CAE tools, coupled with educational initiatives, is further fueling adoption. Market expansion strategies by key players, including aggressive pricing models for SMEs and targeted marketing campaigns in emerging economies, are also contributing to accelerated growth.
Key Players Shaping the CAE Software Market
- Siemens PLM Software
- ANSYS
- Dassault Systemes
- Hexagon AB
- MSC Software
- Altair
- ESI
- PTC
- Autodesk
- COMSOL Multiphysics
- BETA CAE Systems
- Magma
- CoreTech System
- Toray Engineering
- Yuanjisuan
- Supcompute
Notable Milestones in CAE Software Sector
- 2019: Introduction of AI-powered solvers in leading CAE platforms, significantly reducing simulation times.
- 2020: Increased adoption of cloud-based CAE solutions for enhanced scalability and accessibility.
- 2021: Development of integrated multiphysics simulation capabilities, allowing for more complex and realistic analyses.
- 2022: Growing emphasis on user experience and intuitive interfaces, broadening CAE accessibility to a wider range of engineers.
- 2023: Significant advancements in generative design, enabling AI to suggest optimized product designs based on simulation inputs.
- 2024: Expansion of CAE applications into emerging sectors like additive manufacturing and digital twins.
In-Depth CAE Software Market Outlook
The future outlook for the CAE software market is exceptionally promising, driven by a convergence of technological innovation and industry-wide digital transformation. The ongoing development of AI and machine learning will continue to unlock new levels of simulation intelligence, enabling predictive analytics and autonomous design optimization. Cloud computing will further democratize access to powerful simulation capabilities, fostering wider adoption, especially among SMEs. The increasing demand for sustainable products and advanced manufacturing techniques will necessitate more sophisticated virtual validation processes. Strategic collaborations and the expansion of CAE into nascent application areas like quantum computing for material science simulations will act as significant growth accelerators, solidifying CAE software's position as an indispensable tool for engineering and innovation. The market is projected to reach $ZZ.ZZ billion by 2033.
CAE Software Segmentation
-
1. Application
- 1.1. Machine Tool Industry
- 1.2. Automobile & Train Industry
- 1.3. Shipbuilding Industry
- 1.4. Aerospace & Defense Industry
- 1.5. Other Applications
-
2. Types
- 2.1. Mono Functional
- 2.2. Multi Functional
CAE Software Segmentation By Geography
-
1. North America
- 1.1. United States
- 1.2. Canada
- 1.3. Mexico
-
2. South America
- 2.1. Brazil
- 2.2. Argentina
- 2.3. Rest of South America
-
3. Europe
- 3.1. United Kingdom
- 3.2. Germany
- 3.3. France
- 3.4. Italy
- 3.5. Spain
- 3.6. Russia
- 3.7. Benelux
- 3.8. Nordics
- 3.9. Rest of Europe
-
4. Middle East & Africa
- 4.1. Turkey
- 4.2. Israel
- 4.3. GCC
- 4.4. North Africa
- 4.5. South Africa
- 4.6. Rest of Middle East & Africa
-
5. Asia Pacific
- 5.1. China
- 5.2. India
- 5.3. Japan
- 5.4. South Korea
- 5.5. ASEAN
- 5.6. Oceania
- 5.7. Rest of Asia Pacific
CAE Software Regional Market Share
Geographic Coverage of CAE Software
CAE Software REPORT HIGHLIGHTS
| Aspects | Details |
|---|---|
| Study Period | 2020-2034 |
| Base Year | 2025 |
| Estimated Year | 2026 |
| Forecast Period | 2026-2034 |
| Historical Period | 2020-2025 |
| Growth Rate | CAGR of 10.1% from 2020-2034 |
| Segmentation |
|
Table of Contents
- 1. Introduction
- 1.1. Research Scope
- 1.2. Market Segmentation
- 1.3. Research Methodology
- 1.4. Definitions and Assumptions
- 2. Executive Summary
- 2.1. Introduction
- 3. Market Dynamics
- 3.1. Introduction
- 3.2. Market Drivers
- 3.3. Market Restrains
- 3.4. Market Trends
- 4. Market Factor Analysis
- 4.1. Porters Five Forces
- 4.2. Supply/Value Chain
- 4.3. PESTEL analysis
- 4.4. Market Entropy
- 4.5. Patent/Trademark Analysis
- 5. Global CAE Software Analysis, Insights and Forecast, 2020-2032
- 5.1. Market Analysis, Insights and Forecast - by Application
- 5.1.1. Machine Tool Industry
- 5.1.2. Automobile & Train Industry
- 5.1.3. Shipbuilding Industry
- 5.1.4. Aerospace & Defense Industry
- 5.1.5. Other Applications
- 5.2. Market Analysis, Insights and Forecast - by Types
- 5.2.1. Mono Functional
- 5.2.2. Multi Functional
- 5.3. Market Analysis, Insights and Forecast - by Region
- 5.3.1. North America
- 5.3.2. South America
- 5.3.3. Europe
- 5.3.4. Middle East & Africa
- 5.3.5. Asia Pacific
- 5.1. Market Analysis, Insights and Forecast - by Application
- 6. North America CAE Software Analysis, Insights and Forecast, 2020-2032
- 6.1. Market Analysis, Insights and Forecast - by Application
- 6.1.1. Machine Tool Industry
- 6.1.2. Automobile & Train Industry
- 6.1.3. Shipbuilding Industry
- 6.1.4. Aerospace & Defense Industry
- 6.1.5. Other Applications
- 6.2. Market Analysis, Insights and Forecast - by Types
- 6.2.1. Mono Functional
- 6.2.2. Multi Functional
- 6.1. Market Analysis, Insights and Forecast - by Application
- 7. South America CAE Software Analysis, Insights and Forecast, 2020-2032
- 7.1. Market Analysis, Insights and Forecast - by Application
- 7.1.1. Machine Tool Industry
- 7.1.2. Automobile & Train Industry
- 7.1.3. Shipbuilding Industry
- 7.1.4. Aerospace & Defense Industry
- 7.1.5. Other Applications
- 7.2. Market Analysis, Insights and Forecast - by Types
- 7.2.1. Mono Functional
- 7.2.2. Multi Functional
- 7.1. Market Analysis, Insights and Forecast - by Application
- 8. Europe CAE Software Analysis, Insights and Forecast, 2020-2032
- 8.1. Market Analysis, Insights and Forecast - by Application
- 8.1.1. Machine Tool Industry
- 8.1.2. Automobile & Train Industry
- 8.1.3. Shipbuilding Industry
- 8.1.4. Aerospace & Defense Industry
- 8.1.5. Other Applications
- 8.2. Market Analysis, Insights and Forecast - by Types
- 8.2.1. Mono Functional
- 8.2.2. Multi Functional
- 8.1. Market Analysis, Insights and Forecast - by Application
- 9. Middle East & Africa CAE Software Analysis, Insights and Forecast, 2020-2032
- 9.1. Market Analysis, Insights and Forecast - by Application
- 9.1.1. Machine Tool Industry
- 9.1.2. Automobile & Train Industry
- 9.1.3. Shipbuilding Industry
- 9.1.4. Aerospace & Defense Industry
- 9.1.5. Other Applications
- 9.2. Market Analysis, Insights and Forecast - by Types
- 9.2.1. Mono Functional
- 9.2.2. Multi Functional
- 9.1. Market Analysis, Insights and Forecast - by Application
- 10. Asia Pacific CAE Software Analysis, Insights and Forecast, 2020-2032
- 10.1. Market Analysis, Insights and Forecast - by Application
- 10.1.1. Machine Tool Industry
- 10.1.2. Automobile & Train Industry
- 10.1.3. Shipbuilding Industry
- 10.1.4. Aerospace & Defense Industry
- 10.1.5. Other Applications
- 10.2. Market Analysis, Insights and Forecast - by Types
- 10.2.1. Mono Functional
- 10.2.2. Multi Functional
- 10.1. Market Analysis, Insights and Forecast - by Application
- 11. Competitive Analysis
- 11.1. Global Market Share Analysis 2025
- 11.2. Company Profiles
- 11.2.1 Siemens PLM Software
- 11.2.1.1. Overview
- 11.2.1.2. Products
- 11.2.1.3. SWOT Analysis
- 11.2.1.4. Recent Developments
- 11.2.1.5. Financials (Based on Availability)
- 11.2.2 ANSYS
- 11.2.2.1. Overview
- 11.2.2.2. Products
- 11.2.2.3. SWOT Analysis
- 11.2.2.4. Recent Developments
- 11.2.2.5. Financials (Based on Availability)
- 11.2.3 Dassault Systemes
- 11.2.3.1. Overview
- 11.2.3.2. Products
- 11.2.3.3. SWOT Analysis
- 11.2.3.4. Recent Developments
- 11.2.3.5. Financials (Based on Availability)
- 11.2.4 Hexagon AB
- 11.2.4.1. Overview
- 11.2.4.2. Products
- 11.2.4.3. SWOT Analysis
- 11.2.4.4. Recent Developments
- 11.2.4.5. Financials (Based on Availability)
- 11.2.5 MSC Software
- 11.2.5.1. Overview
- 11.2.5.2. Products
- 11.2.5.3. SWOT Analysis
- 11.2.5.4. Recent Developments
- 11.2.5.5. Financials (Based on Availability)
- 11.2.6 Alatir
- 11.2.6.1. Overview
- 11.2.6.2. Products
- 11.2.6.3. SWOT Analysis
- 11.2.6.4. Recent Developments
- 11.2.6.5. Financials (Based on Availability)
- 11.2.7 ESI
- 11.2.7.1. Overview
- 11.2.7.2. Products
- 11.2.7.3. SWOT Analysis
- 11.2.7.4. Recent Developments
- 11.2.7.5. Financials (Based on Availability)
- 11.2.8 PTC
- 11.2.8.1. Overview
- 11.2.8.2. Products
- 11.2.8.3. SWOT Analysis
- 11.2.8.4. Recent Developments
- 11.2.8.5. Financials (Based on Availability)
- 11.2.9 Autodesk
- 11.2.9.1. Overview
- 11.2.9.2. Products
- 11.2.9.3. SWOT Analysis
- 11.2.9.4. Recent Developments
- 11.2.9.5. Financials (Based on Availability)
- 11.2.10 COMSOL Multiphysics
- 11.2.10.1. Overview
- 11.2.10.2. Products
- 11.2.10.3. SWOT Analysis
- 11.2.10.4. Recent Developments
- 11.2.10.5. Financials (Based on Availability)
- 11.2.11 BETA CAE Systems
- 11.2.11.1. Overview
- 11.2.11.2. Products
- 11.2.11.3. SWOT Analysis
- 11.2.11.4. Recent Developments
- 11.2.11.5. Financials (Based on Availability)
- 11.2.12 Magma
- 11.2.12.1. Overview
- 11.2.12.2. Products
- 11.2.12.3. SWOT Analysis
- 11.2.12.4. Recent Developments
- 11.2.12.5. Financials (Based on Availability)
- 11.2.13 CoreTech System
- 11.2.13.1. Overview
- 11.2.13.2. Products
- 11.2.13.3. SWOT Analysis
- 11.2.13.4. Recent Developments
- 11.2.13.5. Financials (Based on Availability)
- 11.2.14 Toray Engineering
- 11.2.14.1. Overview
- 11.2.14.2. Products
- 11.2.14.3. SWOT Analysis
- 11.2.14.4. Recent Developments
- 11.2.14.5. Financials (Based on Availability)
- 11.2.15 Yuanjisuan
- 11.2.15.1. Overview
- 11.2.15.2. Products
- 11.2.15.3. SWOT Analysis
- 11.2.15.4. Recent Developments
- 11.2.15.5. Financials (Based on Availability)
- 11.2.16 Supcompute
- 11.2.16.1. Overview
- 11.2.16.2. Products
- 11.2.16.3. SWOT Analysis
- 11.2.16.4. Recent Developments
- 11.2.16.5. Financials (Based on Availability)
- 11.2.1 Siemens PLM Software
List of Figures
- Figure 1: Global CAE Software Revenue Breakdown (undefined, %) by Region 2025 & 2033
- Figure 2: North America CAE Software Revenue (undefined), by Application 2025 & 2033
- Figure 3: North America CAE Software Revenue Share (%), by Application 2025 & 2033
- Figure 4: North America CAE Software Revenue (undefined), by Types 2025 & 2033
- Figure 5: North America CAE Software Revenue Share (%), by Types 2025 & 2033
- Figure 6: North America CAE Software Revenue (undefined), by Country 2025 & 2033
- Figure 7: North America CAE Software Revenue Share (%), by Country 2025 & 2033
- Figure 8: South America CAE Software Revenue (undefined), by Application 2025 & 2033
- Figure 9: South America CAE Software Revenue Share (%), by Application 2025 & 2033
- Figure 10: South America CAE Software Revenue (undefined), by Types 2025 & 2033
- Figure 11: South America CAE Software Revenue Share (%), by Types 2025 & 2033
- Figure 12: South America CAE Software Revenue (undefined), by Country 2025 & 2033
- Figure 13: South America CAE Software Revenue Share (%), by Country 2025 & 2033
- Figure 14: Europe CAE Software Revenue (undefined), by Application 2025 & 2033
- Figure 15: Europe CAE Software Revenue Share (%), by Application 2025 & 2033
- Figure 16: Europe CAE Software Revenue (undefined), by Types 2025 & 2033
- Figure 17: Europe CAE Software Revenue Share (%), by Types 2025 & 2033
- Figure 18: Europe CAE Software Revenue (undefined), by Country 2025 & 2033
- Figure 19: Europe CAE Software Revenue Share (%), by Country 2025 & 2033
- Figure 20: Middle East & Africa CAE Software Revenue (undefined), by Application 2025 & 2033
- Figure 21: Middle East & Africa CAE Software Revenue Share (%), by Application 2025 & 2033
- Figure 22: Middle East & Africa CAE Software Revenue (undefined), by Types 2025 & 2033
- Figure 23: Middle East & Africa CAE Software Revenue Share (%), by Types 2025 & 2033
- Figure 24: Middle East & Africa CAE Software Revenue (undefined), by Country 2025 & 2033
- Figure 25: Middle East & Africa CAE Software Revenue Share (%), by Country 2025 & 2033
- Figure 26: Asia Pacific CAE Software Revenue (undefined), by Application 2025 & 2033
- Figure 27: Asia Pacific CAE Software Revenue Share (%), by Application 2025 & 2033
- Figure 28: Asia Pacific CAE Software Revenue (undefined), by Types 2025 & 2033
- Figure 29: Asia Pacific CAE Software Revenue Share (%), by Types 2025 & 2033
- Figure 30: Asia Pacific CAE Software Revenue (undefined), by Country 2025 & 2033
- Figure 31: Asia Pacific CAE Software Revenue Share (%), by Country 2025 & 2033
List of Tables
- Table 1: Global CAE Software Revenue undefined Forecast, by Application 2020 & 2033
- Table 2: Global CAE Software Revenue undefined Forecast, by Types 2020 & 2033
- Table 3: Global CAE Software Revenue undefined Forecast, by Region 2020 & 2033
- Table 4: Global CAE Software Revenue undefined Forecast, by Application 2020 & 2033
- Table 5: Global CAE Software Revenue undefined Forecast, by Types 2020 & 2033
- Table 6: Global CAE Software Revenue undefined Forecast, by Country 2020 & 2033
- Table 7: United States CAE Software Revenue (undefined) Forecast, by Application 2020 & 2033
- Table 8: Canada CAE Software Revenue (undefined) Forecast, by Application 2020 & 2033
- Table 9: Mexico CAE Software Revenue (undefined) Forecast, by Application 2020 & 2033
- Table 10: Global CAE Software Revenue undefined Forecast, by Application 2020 & 2033
- Table 11: Global CAE Software Revenue undefined Forecast, by Types 2020 & 2033
- Table 12: Global CAE Software Revenue undefined Forecast, by Country 2020 & 2033
- Table 13: Brazil CAE Software Revenue (undefined) Forecast, by Application 2020 & 2033
- Table 14: Argentina CAE Software Revenue (undefined) Forecast, by Application 2020 & 2033
- Table 15: Rest of South America CAE Software Revenue (undefined) Forecast, by Application 2020 & 2033
- Table 16: Global CAE Software Revenue undefined Forecast, by Application 2020 & 2033
- Table 17: Global CAE Software Revenue undefined Forecast, by Types 2020 & 2033
- Table 18: Global CAE Software Revenue undefined Forecast, by Country 2020 & 2033
- Table 19: United Kingdom CAE Software Revenue (undefined) Forecast, by Application 2020 & 2033
- Table 20: Germany CAE Software Revenue (undefined) Forecast, by Application 2020 & 2033
- Table 21: France CAE Software Revenue (undefined) Forecast, by Application 2020 & 2033
- Table 22: Italy CAE Software Revenue (undefined) Forecast, by Application 2020 & 2033
- Table 23: Spain CAE Software Revenue (undefined) Forecast, by Application 2020 & 2033
- Table 24: Russia CAE Software Revenue (undefined) Forecast, by Application 2020 & 2033
- Table 25: Benelux CAE Software Revenue (undefined) Forecast, by Application 2020 & 2033
- Table 26: Nordics CAE Software Revenue (undefined) Forecast, by Application 2020 & 2033
- Table 27: Rest of Europe CAE Software Revenue (undefined) Forecast, by Application 2020 & 2033
- Table 28: Global CAE Software Revenue undefined Forecast, by Application 2020 & 2033
- Table 29: Global CAE Software Revenue undefined Forecast, by Types 2020 & 2033
- Table 30: Global CAE Software Revenue undefined Forecast, by Country 2020 & 2033
- Table 31: Turkey CAE Software Revenue (undefined) Forecast, by Application 2020 & 2033
- Table 32: Israel CAE Software Revenue (undefined) Forecast, by Application 2020 & 2033
- Table 33: GCC CAE Software Revenue (undefined) Forecast, by Application 2020 & 2033
- Table 34: North Africa CAE Software Revenue (undefined) Forecast, by Application 2020 & 2033
- Table 35: South Africa CAE Software Revenue (undefined) Forecast, by Application 2020 & 2033
- Table 36: Rest of Middle East & Africa CAE Software Revenue (undefined) Forecast, by Application 2020 & 2033
- Table 37: Global CAE Software Revenue undefined Forecast, by Application 2020 & 2033
- Table 38: Global CAE Software Revenue undefined Forecast, by Types 2020 & 2033
- Table 39: Global CAE Software Revenue undefined Forecast, by Country 2020 & 2033
- Table 40: China CAE Software Revenue (undefined) Forecast, by Application 2020 & 2033
- Table 41: India CAE Software Revenue (undefined) Forecast, by Application 2020 & 2033
- Table 42: Japan CAE Software Revenue (undefined) Forecast, by Application 2020 & 2033
- Table 43: South Korea CAE Software Revenue (undefined) Forecast, by Application 2020 & 2033
- Table 44: ASEAN CAE Software Revenue (undefined) Forecast, by Application 2020 & 2033
- Table 45: Oceania CAE Software Revenue (undefined) Forecast, by Application 2020 & 2033
- Table 46: Rest of Asia Pacific CAE Software Revenue (undefined) Forecast, by Application 2020 & 2033
Frequently Asked Questions
1. What is the projected Compound Annual Growth Rate (CAGR) of the CAE Software?
The projected CAGR is approximately 10.1%.
2. Which companies are prominent players in the CAE Software?
Key companies in the market include Siemens PLM Software, ANSYS, Dassault Systemes, Hexagon AB, MSC Software, Alatir, ESI, PTC, Autodesk, COMSOL Multiphysics, BETA CAE Systems, Magma, CoreTech System, Toray Engineering, Yuanjisuan, Supcompute.
3. What are the main segments of the CAE Software?
The market segments include Application, Types.
4. Can you provide details about the market size?
The market size is estimated to be USD XXX N/A as of 2022.
5. What are some drivers contributing to market growth?
N/A
6. What are the notable trends driving market growth?
N/A
7. Are there any restraints impacting market growth?
N/A
8. Can you provide examples of recent developments in the market?
N/A
9. What pricing options are available for accessing the report?
Pricing options include single-user, multi-user, and enterprise licenses priced at USD 2900.00, USD 4350.00, and USD 5800.00 respectively.
10. Is the market size provided in terms of value or volume?
The market size is provided in terms of value, measured in N/A.
11. Are there any specific market keywords associated with the report?
Yes, the market keyword associated with the report is "CAE Software," which aids in identifying and referencing the specific market segment covered.
12. How do I determine which pricing option suits my needs best?
The pricing options vary based on user requirements and access needs. Individual users may opt for single-user licenses, while businesses requiring broader access may choose multi-user or enterprise licenses for cost-effective access to the report.
13. Are there any additional resources or data provided in the CAE Software report?
While the report offers comprehensive insights, it's advisable to review the specific contents or supplementary materials provided to ascertain if additional resources or data are available.
14. How can I stay updated on further developments or reports in the CAE Software?
To stay informed about further developments, trends, and reports in the CAE Software, consider subscribing to industry newsletters, following relevant companies and organizations, or regularly checking reputable industry news sources and publications.
Methodology
Step 1 - Identification of Relevant Samples Size from Population Database


Step 2 - Approaches for Defining Global Market Size (Value, Volume* & Price*)

Note*: In applicable scenarios
Step 3 - Data Sources
Primary Research
- Web Analytics
- Survey Reports
- Research Institute
- Latest Research Reports
- Opinion Leaders
Secondary Research
- Annual Reports
- White Paper
- Latest Press Release
- Industry Association
- Paid Database
- Investor Presentations

Step 4 - Data Triangulation
Involves using different sources of information in order to increase the validity of a study
These sources are likely to be stakeholders in a program - participants, other researchers, program staff, other community members, and so on.
Then we put all data in single framework & apply various statistical tools to find out the dynamic on the market.
During the analysis stage, feedback from the stakeholder groups would be compared to determine areas of agreement as well as areas of divergence