

Key Insights
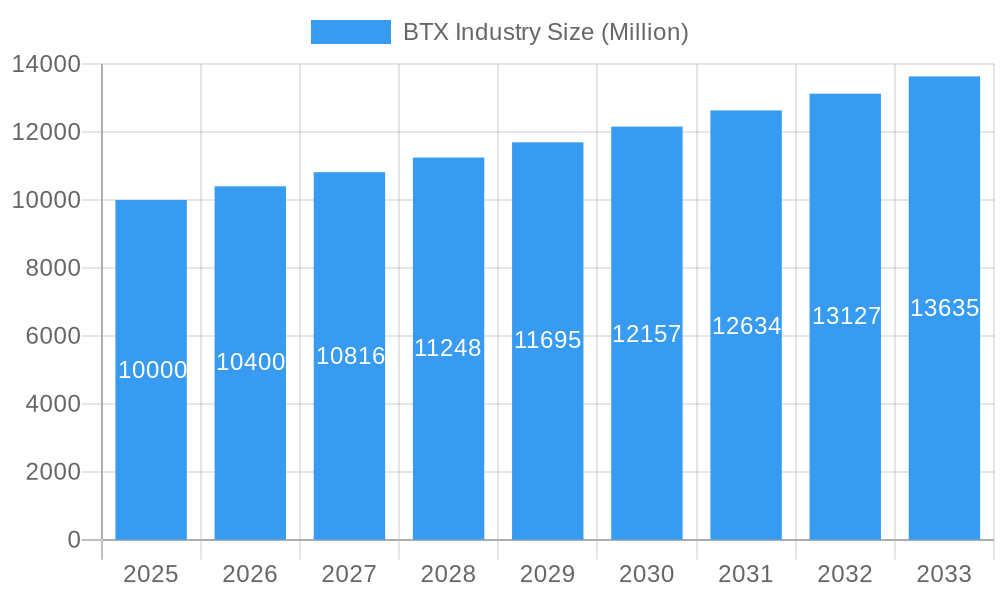
The global BTX (Benzene, Toluene, Xylene) market is projected for substantial growth, propelled by escalating demand from the petrochemical sector. With a current market size of $8.07 billion and a projected Compound Annual Growth Rate (CAGR) of 4.6% from the base year 2025 to 2033, this expansion is underpinned by the increasing production of plastics, synthetic fibers, and downstream products crucial for the automotive, construction, and packaging industries. Significant market influence stems from geographic expansion, particularly within the rapidly developing economies of the Asia-Pacific region. While fluctuating crude oil prices and environmental regulations present challenges, innovations in production technology and the development of sustainable BTX derivatives are expected to mitigate these impacts.
BTX Industry Market Size (In Billion)
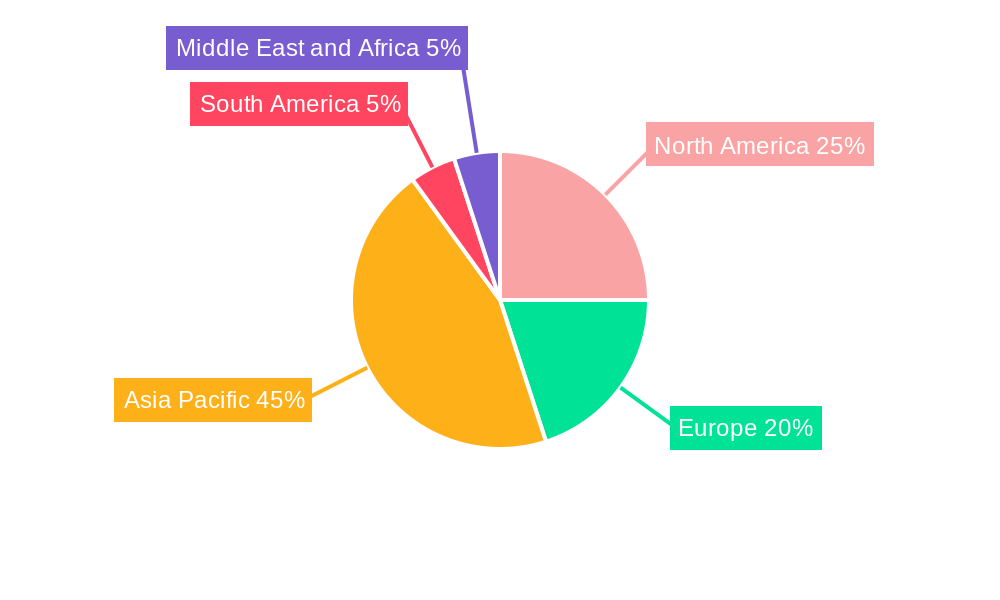
The competitive BTX market comprises integrated petrochemical giants and specialized manufacturers. Leading entities such as Shell, ExxonMobil, and SINOPEC dominate due to their extensive production capabilities and global presence. Emerging companies are focusing on specialized applications and sustainable strategies. The market is segmented by BTX type and application, with Benzene being a key component for plastics and synthetic fibers, and Toluene vital for solvents and fuels. The Asia-Pacific region, led by China and India, is a primary market driven by rapid industrialization and manufacturing growth. North America and Europe also maintain strong market positions, supported by established petrochemical infrastructure and consistent demand for related products. Future market dynamics will be shaped by technological advancements, evolving regulatory frameworks, and global energy consumption trends.
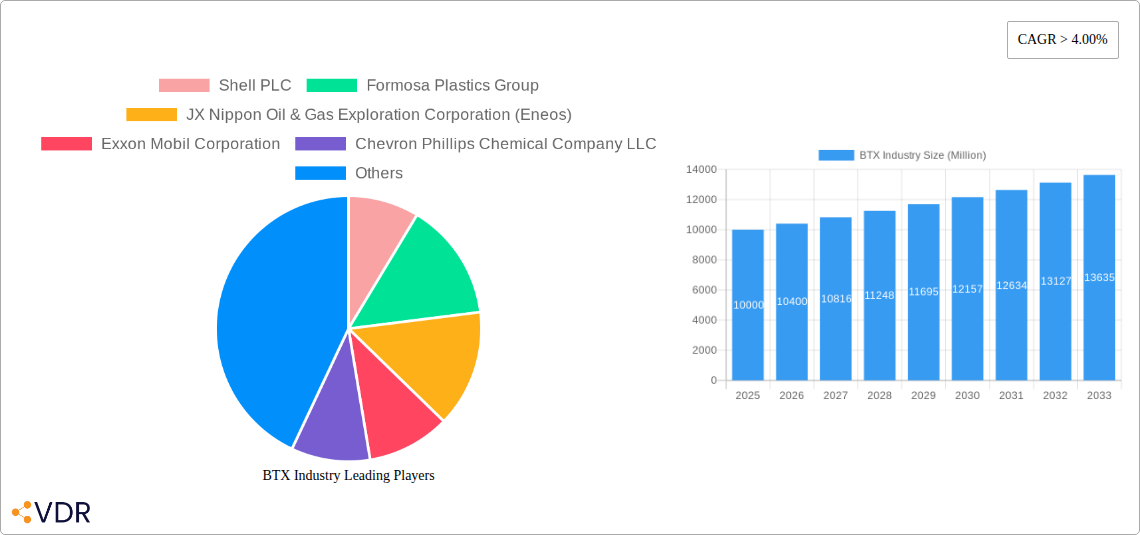
BTX Industry Company Market Share
BTX Industry Market Report: 2019-2033 Forecast
This comprehensive BTX Industry market report provides an in-depth analysis of the global market, covering the period 2019-2033. With a focus on Benzene, Toluene, and Xylene (BTX) segments and their applications, this report is essential for industry professionals, investors, and strategic planners seeking to understand current market dynamics and future growth opportunities. The report leverages extensive data analysis to deliver actionable insights, covering market size, growth trends, competitive landscape, and emerging opportunities within the parent chemical industry and its child BTX market. The base year for this report is 2025, with an estimated year of 2025 and a forecast period spanning 2025-2033. The historical period covered is 2019-2024. The market size is presented in million units.
BTX Industry Market Dynamics & Structure
This section analyzes the BTX market's competitive landscape, highlighting key drivers and challenges shaping its evolution. We examine market concentration, technological innovation, regulatory influences, and the role of substitute products. The impact of mergers and acquisitions (M&A) activity on market structure is also assessed.
- Market Concentration: The BTX market exhibits a moderately concentrated structure, with a few major players holding significant market share. xx% of the market is controlled by the top 5 players in 2025.
- Technological Innovation: Advancements in refining technologies and production processes are driving efficiency gains and cost reductions. However, high capital investment requirements pose a barrier to entry for new players.
- Regulatory Landscape: Environmental regulations and safety standards significantly impact BTX production and distribution. Compliance costs and potential penalties influence industry profitability.
- Competitive Substitutes: The availability of alternative materials and processes presents a competitive challenge to BTX applications in certain sectors.
- End-User Demographics: Demand for BTX is driven by various end-use sectors, including plastics, fibers, and solvents. Growth in these sectors directly impacts BTX market size.
- M&A Activity: Consolidation through M&A activities has been observed, with xx major deals recorded between 2019 and 2024, totaling approximately xx million units in value. These deals aim to enhance market share and streamline operations.
BTX Industry Growth Trends & Insights
This section delves into the historical and projected growth trajectory of the BTX market. We analyze market size evolution, adoption rates across various applications, and the impact of technological disruptions and evolving consumer preferences. Specific metrics like compound annual growth rate (CAGR) and market penetration rates are provided for a detailed understanding. The analysis incorporates data from various sources to deliver a comprehensive overview of the market's growth dynamics. The BTX market is projected to experience a CAGR of xx% during the forecast period (2025-2033), reaching a market size of xx million units by 2033, driven by increasing demand from downstream industries. This growth is also influenced by factors like technological advancements in production processes and expansion of application areas.
Dominant Regions, Countries, or Segments in BTX Industry
This section identifies the leading regions, countries, and segments within the BTX market driving overall growth. Key drivers for each dominant area are highlighted, along with analysis of market share and growth potential.
- Dominant Region: Asia Pacific is projected to be the dominant region for BTX production and consumption, fueled by robust economic growth and increasing industrialization in countries like China and India.
- Key Drivers:
- Rapid industrialization and urbanization in Asia-Pacific.
- Favorable government policies supporting the petrochemical industry.
- Increasing demand from downstream sectors like plastics and packaging.
- Dominant Segment: The Benzene segment is expected to maintain its dominant position due to its widespread use in various applications, including plastics and synthetic fibers.
- Growth Potential: Significant growth potential exists in emerging markets in Africa and South America, driven by growing demand from various industries.
BTX Industry Product Landscape
The BTX market features a range of products with diverse applications. Continuous innovation leads to enhanced product performance, including improved efficiency, lower environmental impact, and wider applications. Companies are constantly improving their formulations and manufacturing processes, seeking to enhance product quality and competitiveness. This leads to the development of specialized BTX products tailored to specific application requirements. For example, high-purity BTX is increasingly favored in applications requiring stringent quality standards.
Key Drivers, Barriers & Challenges in BTX Industry
Key Drivers: Growing demand from the plastics, fibers, and solvents industries, coupled with technological advancements in BTX production, are major drivers. Favorable government policies supporting the chemical sector in key regions also contribute to market expansion.
Key Barriers and Challenges: Fluctuations in crude oil prices pose a significant challenge, impacting the cost of BTX production. Stricter environmental regulations increase compliance costs, affecting profitability. Intense competition among existing players and the emergence of substitutes further constrain growth. Supply chain disruptions, exacerbated by geopolitical instability, also create uncertainties in the market.
Emerging Opportunities in BTX Industry
Emerging opportunities include expanding into new applications for BTX derivatives, such as in advanced materials and specialty chemicals. This requires ongoing R&D investment and strategic collaborations to capitalize on growth in niche markets. Furthermore, utilizing sustainable and environmentally friendly production processes will be vital for maintaining market competitiveness and complying with evolving regulations.
Growth Accelerators in the BTX Industry Industry
Technological breakthroughs in refining and production processes, aimed at enhancing efficiency and reducing costs, are key growth accelerators. Strategic partnerships and collaborations between BTX producers and downstream users will streamline supply chains and facilitate product development. Geographical expansion into new markets, particularly in emerging economies, will also contribute to substantial growth.
Key Players Shaping the BTX Industry Market
- Shell PLC
- Formosa Plastics Group
- JX Nippon Oil & Gas Exploration Corporation (Eneos)
- Exxon Mobil Corporation
- Chevron Phillips Chemical Company LLC
- YeoChun NCC CO LTD
- IRPC Public Company Limited
- INEOS
- China Petroleum & Chemical Corporation Limited (SINOPEC)
- Reliance Industries Limited
- China National Petroleum Corporation
- China National Offshore Oil Corporation (CNOOC)
- BASF SE
- OCI LTD
- Totalenergies
- SABIC
- Dow
- MITSUBISHI GAS CHEMICAL COMPANY INC
- GS Caltex Corporation
- JFE Chemical Corporation
- SK Innovation Co Ltd
- BP PLC
- S-OIL Corporation
Notable Milestones in BTX Industry Sector
- 2020: Several major players announced investments in new BTX production facilities to meet growing demand.
- 2021: A significant merger between two BTX producers reshaped the market landscape.
- 2022: New environmental regulations were implemented, leading to increased operational costs for many companies.
- 2023: Several companies announced the development of new, more sustainable BTX production technologies.
- 2024: A major disruption to the global supply chain impacted BTX availability and prices. (Further details in the full report)
In-Depth BTX Industry Market Outlook
The BTX market is poised for continued growth, driven by increasing demand from downstream industries and technological advancements. Strategic acquisitions, capacity expansions, and innovation in product applications will shape the market's future trajectory. Companies that prioritize sustainability and efficiency in their operations will be well-positioned to capture significant market share. Further opportunities exist in expanding into new and emerging markets worldwide.
BTX Industry Segmentation
-
1. Type
- 1.1. Benzene
- 1.2. Toluene
-
1.3. Xylene
- 1.3.1. Ortho-xylene
- 1.3.2. Meta-xylene
- 1.3.3. Para-xylene
-
2. Product Application
-
2.1. Benzene By Application
- 2.1.1. Ethylbenzene
- 2.1.2. Cyclohexane
- 2.1.3. Alkylbenzene
- 2.1.4. Cumene
- 2.1.5. Nitrobenzene
- 2.1.6. Other Applications
-
2.2. Toluene By Application
- 2.2.1. Paints and Coatings
- 2.2.2. Adhesives and Inks
- 2.2.3. Explosives
- 2.2.4. Chemical Industry
-
2.3. Xylene By Application
- 2.3.1. Solvent
- 2.3.2. Monomer
-
2.1. Benzene By Application
BTX Industry Segmentation By Geography
-
1. Asia Pacific
- 1.1. China
- 1.2. India
- 1.3. Japan
- 1.4. South Korea
- 1.5. Rest of Asia Pacific
-
2. North America
- 2.1. United States
- 2.2. Canada
- 2.3. Mexico
-
3. Europe
- 3.1. Germany
- 3.2. United Kingdom
- 3.3. Italy
- 3.4. France
- 3.5. Rest of Europe
-
4. South America
- 4.1. Brazil
- 4.2. Argentina
- 4.3. Rest of South America
-
5. Middle East and Africa
- 5.1. Saudi Arabia
- 5.2. South Africa
- 5.3. Rest of Middle East and Africa
BTX Industry Regional Market Share
Geographic Coverage of BTX Industry
BTX Industry REPORT HIGHLIGHTS
| Aspects | Details |
|---|---|
| Study Period | 2020-2034 |
| Base Year | 2025 |
| Estimated Year | 2026 |
| Forecast Period | 2026-2034 |
| Historical Period | 2020-2025 |
| Growth Rate | CAGR of 4.6% from 2020-2034 |
| Segmentation |
|
Table of Contents
- 1. Introduction
- 1.1. Research Scope
- 1.2. Market Segmentation
- 1.3. Research Objective
- 1.4. Definitions and Assumptions
- 2. Executive Summary
- 2.1. Market Snapshot
- 3. Market Dynamics
- 3.1. Market Drivers
- 3.2. Market Restrains
- 3.3. Market Trends
- 3.4. Market Opportunities
- 4. Market Factor Analysis
- 4.1. Porters Five Forces
- 4.1.1. Bargaining Power of Suppliers
- 4.1.2. Bargaining Power of Buyers
- 4.1.3. Threat of New Entrants
- 4.1.4. Threat of Substitutes
- 4.1.5. Competitive Rivalry
- 4.2. PESTEL analysis
- 4.3. BCG Analysis
- 4.3.1. Stars (High Growth, High Market Share)
- 4.3.2. Cash Cows (Low Growth, High Market Share)
- 4.3.3. Question Mark (High Growth, Low Market Share)
- 4.3.4. Dogs (Low Growth, Low Market Share)
- 4.4. Ansoff Matrix Analysis
- 4.5. Supply Chain Analysis
- 4.6. Regulatory Landscape
- 4.7. Current Market Potential and Opportunity Assessment (TAM–SAM–SOM Framework)
- 4.8. VDR Analyst Note
- 4.1. Porters Five Forces
- 5. Market Analysis, Insights and Forecast 2021-2033
- 5.1. Market Analysis, Insights and Forecast - by Type
- 5.1.1. Benzene
- 5.1.2. Toluene
- 5.1.3. Xylene
- 5.1.3.1. Ortho-xylene
- 5.1.3.2. Meta-xylene
- 5.1.3.3. Para-xylene
- 5.2. Market Analysis, Insights and Forecast - by Product Application
- 5.2.1. Benzene By Application
- 5.2.1.1. Ethylbenzene
- 5.2.1.2. Cyclohexane
- 5.2.1.3. Alkylbenzene
- 5.2.1.4. Cumene
- 5.2.1.5. Nitrobenzene
- 5.2.1.6. Other Applications
- 5.2.2. Toluene By Application
- 5.2.2.1. Paints and Coatings
- 5.2.2.2. Adhesives and Inks
- 5.2.2.3. Explosives
- 5.2.2.4. Chemical Industry
- 5.2.3. Xylene By Application
- 5.2.3.1. Solvent
- 5.2.3.2. Monomer
- 5.2.1. Benzene By Application
- 5.3. Market Analysis, Insights and Forecast - by Region
- 5.3.1. Asia Pacific
- 5.3.2. North America
- 5.3.3. Europe
- 5.3.4. South America
- 5.3.5. Middle East and Africa
- 5.1. Market Analysis, Insights and Forecast - by Type
- 6. Global BTX Industry Analysis, Insights and Forecast, 2021-2033
- 6.1. Market Analysis, Insights and Forecast - by Type
- 6.1.1. Benzene
- 6.1.2. Toluene
- 6.1.3. Xylene
- 6.1.3.1. Ortho-xylene
- 6.1.3.2. Meta-xylene
- 6.1.3.3. Para-xylene
- 6.2. Market Analysis, Insights and Forecast - by Product Application
- 6.2.1. Benzene By Application
- 6.2.1.1. Ethylbenzene
- 6.2.1.2. Cyclohexane
- 6.2.1.3. Alkylbenzene
- 6.2.1.4. Cumene
- 6.2.1.5. Nitrobenzene
- 6.2.1.6. Other Applications
- 6.2.2. Toluene By Application
- 6.2.2.1. Paints and Coatings
- 6.2.2.2. Adhesives and Inks
- 6.2.2.3. Explosives
- 6.2.2.4. Chemical Industry
- 6.2.3. Xylene By Application
- 6.2.3.1. Solvent
- 6.2.3.2. Monomer
- 6.2.1. Benzene By Application
- 6.1. Market Analysis, Insights and Forecast - by Type
- 7. Asia Pacific BTX Industry Analysis, Insights and Forecast, 2021-2033
- 7.1. Market Analysis, Insights and Forecast - by Type
- 7.1.1. Benzene
- 7.1.2. Toluene
- 7.1.3. Xylene
- 7.1.3.1. Ortho-xylene
- 7.1.3.2. Meta-xylene
- 7.1.3.3. Para-xylene
- 7.2. Market Analysis, Insights and Forecast - by Product Application
- 7.2.1. Benzene By Application
- 7.2.1.1. Ethylbenzene
- 7.2.1.2. Cyclohexane
- 7.2.1.3. Alkylbenzene
- 7.2.1.4. Cumene
- 7.2.1.5. Nitrobenzene
- 7.2.1.6. Other Applications
- 7.2.2. Toluene By Application
- 7.2.2.1. Paints and Coatings
- 7.2.2.2. Adhesives and Inks
- 7.2.2.3. Explosives
- 7.2.2.4. Chemical Industry
- 7.2.3. Xylene By Application
- 7.2.3.1. Solvent
- 7.2.3.2. Monomer
- 7.2.1. Benzene By Application
- 7.1. Market Analysis, Insights and Forecast - by Type
- 8. North America BTX Industry Analysis, Insights and Forecast, 2021-2033
- 8.1. Market Analysis, Insights and Forecast - by Type
- 8.1.1. Benzene
- 8.1.2. Toluene
- 8.1.3. Xylene
- 8.1.3.1. Ortho-xylene
- 8.1.3.2. Meta-xylene
- 8.1.3.3. Para-xylene
- 8.2. Market Analysis, Insights and Forecast - by Product Application
- 8.2.1. Benzene By Application
- 8.2.1.1. Ethylbenzene
- 8.2.1.2. Cyclohexane
- 8.2.1.3. Alkylbenzene
- 8.2.1.4. Cumene
- 8.2.1.5. Nitrobenzene
- 8.2.1.6. Other Applications
- 8.2.2. Toluene By Application
- 8.2.2.1. Paints and Coatings
- 8.2.2.2. Adhesives and Inks
- 8.2.2.3. Explosives
- 8.2.2.4. Chemical Industry
- 8.2.3. Xylene By Application
- 8.2.3.1. Solvent
- 8.2.3.2. Monomer
- 8.2.1. Benzene By Application
- 8.1. Market Analysis, Insights and Forecast - by Type
- 9. Europe BTX Industry Analysis, Insights and Forecast, 2021-2033
- 9.1. Market Analysis, Insights and Forecast - by Type
- 9.1.1. Benzene
- 9.1.2. Toluene
- 9.1.3. Xylene
- 9.1.3.1. Ortho-xylene
- 9.1.3.2. Meta-xylene
- 9.1.3.3. Para-xylene
- 9.2. Market Analysis, Insights and Forecast - by Product Application
- 9.2.1. Benzene By Application
- 9.2.1.1. Ethylbenzene
- 9.2.1.2. Cyclohexane
- 9.2.1.3. Alkylbenzene
- 9.2.1.4. Cumene
- 9.2.1.5. Nitrobenzene
- 9.2.1.6. Other Applications
- 9.2.2. Toluene By Application
- 9.2.2.1. Paints and Coatings
- 9.2.2.2. Adhesives and Inks
- 9.2.2.3. Explosives
- 9.2.2.4. Chemical Industry
- 9.2.3. Xylene By Application
- 9.2.3.1. Solvent
- 9.2.3.2. Monomer
- 9.2.1. Benzene By Application
- 9.1. Market Analysis, Insights and Forecast - by Type
- 10. South America BTX Industry Analysis, Insights and Forecast, 2021-2033
- 10.1. Market Analysis, Insights and Forecast - by Type
- 10.1.1. Benzene
- 10.1.2. Toluene
- 10.1.3. Xylene
- 10.1.3.1. Ortho-xylene
- 10.1.3.2. Meta-xylene
- 10.1.3.3. Para-xylene
- 10.2. Market Analysis, Insights and Forecast - by Product Application
- 10.2.1. Benzene By Application
- 10.2.1.1. Ethylbenzene
- 10.2.1.2. Cyclohexane
- 10.2.1.3. Alkylbenzene
- 10.2.1.4. Cumene
- 10.2.1.5. Nitrobenzene
- 10.2.1.6. Other Applications
- 10.2.2. Toluene By Application
- 10.2.2.1. Paints and Coatings
- 10.2.2.2. Adhesives and Inks
- 10.2.2.3. Explosives
- 10.2.2.4. Chemical Industry
- 10.2.3. Xylene By Application
- 10.2.3.1. Solvent
- 10.2.3.2. Monomer
- 10.2.1. Benzene By Application
- 10.1. Market Analysis, Insights and Forecast - by Type
- 11. Middle East and Africa BTX Industry Analysis, Insights and Forecast, 2021-2033
- 11.1. Market Analysis, Insights and Forecast - by Type
- 11.1.1. Benzene
- 11.1.2. Toluene
- 11.1.3. Xylene
- 11.1.3.1. Ortho-xylene
- 11.1.3.2. Meta-xylene
- 11.1.3.3. Para-xylene
- 11.2. Market Analysis, Insights and Forecast - by Product Application
- 11.2.1. Benzene By Application
- 11.2.1.1. Ethylbenzene
- 11.2.1.2. Cyclohexane
- 11.2.1.3. Alkylbenzene
- 11.2.1.4. Cumene
- 11.2.1.5. Nitrobenzene
- 11.2.1.6. Other Applications
- 11.2.2. Toluene By Application
- 11.2.2.1. Paints and Coatings
- 11.2.2.2. Adhesives and Inks
- 11.2.2.3. Explosives
- 11.2.2.4. Chemical Industry
- 11.2.3. Xylene By Application
- 11.2.3.1. Solvent
- 11.2.3.2. Monomer
- 11.2.1. Benzene By Application
- 11.1. Market Analysis, Insights and Forecast - by Type
- 12. Competitive Analysis
- 12.1. Company Profiles
- 12.1.1 Shell PLC
- 12.1.1.1. Company Overview
- 12.1.1.2. Products
- 12.1.1.3. Company Financials
- 12.1.1.4. SWOT Analysis
- 12.1.2 Formosa Plastics Group
- 12.1.2.1. Company Overview
- 12.1.2.2. Products
- 12.1.2.3. Company Financials
- 12.1.2.4. SWOT Analysis
- 12.1.3 JX Nippon Oil & Gas Exploration Corporation (Eneos)
- 12.1.3.1. Company Overview
- 12.1.3.2. Products
- 12.1.3.3. Company Financials
- 12.1.3.4. SWOT Analysis
- 12.1.4 Exxon Mobil Corporation
- 12.1.4.1. Company Overview
- 12.1.4.2. Products
- 12.1.4.3. Company Financials
- 12.1.4.4. SWOT Analysis
- 12.1.5 Chevron Phillips Chemical Company LLC
- 12.1.5.1. Company Overview
- 12.1.5.2. Products
- 12.1.5.3. Company Financials
- 12.1.5.4. SWOT Analysis
- 12.1.6 YEOCHUN NCC CO LTD*List Not Exhaustive
- 12.1.6.1. Company Overview
- 12.1.6.2. Products
- 12.1.6.3. Company Financials
- 12.1.6.4. SWOT Analysis
- 12.1.7 IRPC Public Company Limited
- 12.1.7.1. Company Overview
- 12.1.7.2. Products
- 12.1.7.3. Company Financials
- 12.1.7.4. SWOT Analysis
- 12.1.8 INEOS
- 12.1.8.1. Company Overview
- 12.1.8.2. Products
- 12.1.8.3. Company Financials
- 12.1.8.4. SWOT Analysis
- 12.1.9 China Petroleum & Chemical Corporation Limited (SINOPEC)
- 12.1.9.1. Company Overview
- 12.1.9.2. Products
- 12.1.9.3. Company Financials
- 12.1.9.4. SWOT Analysis
- 12.1.10 Reliance Industries Limited
- 12.1.10.1. Company Overview
- 12.1.10.2. Products
- 12.1.10.3. Company Financials
- 12.1.10.4. SWOT Analysis
- 12.1.11 China National Petroleum Corporation
- 12.1.11.1. Company Overview
- 12.1.11.2. Products
- 12.1.11.3. Company Financials
- 12.1.11.4. SWOT Analysis
- 12.1.12 China National Offshore Oil Corporation (CNOOC)
- 12.1.12.1. Company Overview
- 12.1.12.2. Products
- 12.1.12.3. Company Financials
- 12.1.12.4. SWOT Analysis
- 12.1.13 BASF SE
- 12.1.13.1. Company Overview
- 12.1.13.2. Products
- 12.1.13.3. Company Financials
- 12.1.13.4. SWOT Analysis
- 12.1.14 OCI LTD
- 12.1.14.1. Company Overview
- 12.1.14.2. Products
- 12.1.14.3. Company Financials
- 12.1.14.4. SWOT Analysis
- 12.1.15 Totalenergies
- 12.1.15.1. Company Overview
- 12.1.15.2. Products
- 12.1.15.3. Company Financials
- 12.1.15.4. SWOT Analysis
- 12.1.16 SABIC
- 12.1.16.1. Company Overview
- 12.1.16.2. Products
- 12.1.16.3. Company Financials
- 12.1.16.4. SWOT Analysis
- 12.1.17 Dow
- 12.1.17.1. Company Overview
- 12.1.17.2. Products
- 12.1.17.3. Company Financials
- 12.1.17.4. SWOT Analysis
- 12.1.18 MITSUBISHI GAS CHEMICAL COMPANY INC
- 12.1.18.1. Company Overview
- 12.1.18.2. Products
- 12.1.18.3. Company Financials
- 12.1.18.4. SWOT Analysis
- 12.1.19 GS Caltex Corporation
- 12.1.19.1. Company Overview
- 12.1.19.2. Products
- 12.1.19.3. Company Financials
- 12.1.19.4. SWOT Analysis
- 12.1.20 JFE Chemical Corporation
- 12.1.20.1. Company Overview
- 12.1.20.2. Products
- 12.1.20.3. Company Financials
- 12.1.20.4. SWOT Analysis
- 12.1.21 SK Innovation Co Ltd
- 12.1.21.1. Company Overview
- 12.1.21.2. Products
- 12.1.21.3. Company Financials
- 12.1.21.4. SWOT Analysis
- 12.1.22 BP PLC
- 12.1.22.1. Company Overview
- 12.1.22.2. Products
- 12.1.22.3. Company Financials
- 12.1.22.4. SWOT Analysis
- 12.1.23 S-OIL Corporation
- 12.1.23.1. Company Overview
- 12.1.23.2. Products
- 12.1.23.3. Company Financials
- 12.1.23.4. SWOT Analysis
- 12.1.1 Shell PLC
- 12.2. Market Entropy
- 12.2.1 Company's Key Areas Served
- 12.2.2 Recent Developments
- 12.3. Company Market Share Analysis 2025
- 12.3.1 Top 5 Companies Market Share Analysis
- 12.3.2 Top 3 Companies Market Share Analysis
- 12.4. List of Potential Customers
- 13. Research Methodology
List of Figures
- Figure 1: Global BTX Industry Revenue Breakdown (billion, %) by Region 2025 & 2033
- Figure 2: Global BTX Industry Volume Breakdown (Million, %) by Region 2025 & 2033
- Figure 3: Asia Pacific BTX Industry Revenue (billion), by Type 2025 & 2033
- Figure 4: Asia Pacific BTX Industry Volume (Million), by Type 2025 & 2033
- Figure 5: Asia Pacific BTX Industry Revenue Share (%), by Type 2025 & 2033
- Figure 6: Asia Pacific BTX Industry Volume Share (%), by Type 2025 & 2033
- Figure 7: Asia Pacific BTX Industry Revenue (billion), by Product Application 2025 & 2033
- Figure 8: Asia Pacific BTX Industry Volume (Million), by Product Application 2025 & 2033
- Figure 9: Asia Pacific BTX Industry Revenue Share (%), by Product Application 2025 & 2033
- Figure 10: Asia Pacific BTX Industry Volume Share (%), by Product Application 2025 & 2033
- Figure 11: Asia Pacific BTX Industry Revenue (billion), by Country 2025 & 2033
- Figure 12: Asia Pacific BTX Industry Volume (Million), by Country 2025 & 2033
- Figure 13: Asia Pacific BTX Industry Revenue Share (%), by Country 2025 & 2033
- Figure 14: Asia Pacific BTX Industry Volume Share (%), by Country 2025 & 2033
- Figure 15: North America BTX Industry Revenue (billion), by Type 2025 & 2033
- Figure 16: North America BTX Industry Volume (Million), by Type 2025 & 2033
- Figure 17: North America BTX Industry Revenue Share (%), by Type 2025 & 2033
- Figure 18: North America BTX Industry Volume Share (%), by Type 2025 & 2033
- Figure 19: North America BTX Industry Revenue (billion), by Product Application 2025 & 2033
- Figure 20: North America BTX Industry Volume (Million), by Product Application 2025 & 2033
- Figure 21: North America BTX Industry Revenue Share (%), by Product Application 2025 & 2033
- Figure 22: North America BTX Industry Volume Share (%), by Product Application 2025 & 2033
- Figure 23: North America BTX Industry Revenue (billion), by Country 2025 & 2033
- Figure 24: North America BTX Industry Volume (Million), by Country 2025 & 2033
- Figure 25: North America BTX Industry Revenue Share (%), by Country 2025 & 2033
- Figure 26: North America BTX Industry Volume Share (%), by Country 2025 & 2033
- Figure 27: Europe BTX Industry Revenue (billion), by Type 2025 & 2033
- Figure 28: Europe BTX Industry Volume (Million), by Type 2025 & 2033
- Figure 29: Europe BTX Industry Revenue Share (%), by Type 2025 & 2033
- Figure 30: Europe BTX Industry Volume Share (%), by Type 2025 & 2033
- Figure 31: Europe BTX Industry Revenue (billion), by Product Application 2025 & 2033
- Figure 32: Europe BTX Industry Volume (Million), by Product Application 2025 & 2033
- Figure 33: Europe BTX Industry Revenue Share (%), by Product Application 2025 & 2033
- Figure 34: Europe BTX Industry Volume Share (%), by Product Application 2025 & 2033
- Figure 35: Europe BTX Industry Revenue (billion), by Country 2025 & 2033
- Figure 36: Europe BTX Industry Volume (Million), by Country 2025 & 2033
- Figure 37: Europe BTX Industry Revenue Share (%), by Country 2025 & 2033
- Figure 38: Europe BTX Industry Volume Share (%), by Country 2025 & 2033
- Figure 39: South America BTX Industry Revenue (billion), by Type 2025 & 2033
- Figure 40: South America BTX Industry Volume (Million), by Type 2025 & 2033
- Figure 41: South America BTX Industry Revenue Share (%), by Type 2025 & 2033
- Figure 42: South America BTX Industry Volume Share (%), by Type 2025 & 2033
- Figure 43: South America BTX Industry Revenue (billion), by Product Application 2025 & 2033
- Figure 44: South America BTX Industry Volume (Million), by Product Application 2025 & 2033
- Figure 45: South America BTX Industry Revenue Share (%), by Product Application 2025 & 2033
- Figure 46: South America BTX Industry Volume Share (%), by Product Application 2025 & 2033
- Figure 47: South America BTX Industry Revenue (billion), by Country 2025 & 2033
- Figure 48: South America BTX Industry Volume (Million), by Country 2025 & 2033
- Figure 49: South America BTX Industry Revenue Share (%), by Country 2025 & 2033
- Figure 50: South America BTX Industry Volume Share (%), by Country 2025 & 2033
- Figure 51: Middle East and Africa BTX Industry Revenue (billion), by Type 2025 & 2033
- Figure 52: Middle East and Africa BTX Industry Volume (Million), by Type 2025 & 2033
- Figure 53: Middle East and Africa BTX Industry Revenue Share (%), by Type 2025 & 2033
- Figure 54: Middle East and Africa BTX Industry Volume Share (%), by Type 2025 & 2033
- Figure 55: Middle East and Africa BTX Industry Revenue (billion), by Product Application 2025 & 2033
- Figure 56: Middle East and Africa BTX Industry Volume (Million), by Product Application 2025 & 2033
- Figure 57: Middle East and Africa BTX Industry Revenue Share (%), by Product Application 2025 & 2033
- Figure 58: Middle East and Africa BTX Industry Volume Share (%), by Product Application 2025 & 2033
- Figure 59: Middle East and Africa BTX Industry Revenue (billion), by Country 2025 & 2033
- Figure 60: Middle East and Africa BTX Industry Volume (Million), by Country 2025 & 2033
- Figure 61: Middle East and Africa BTX Industry Revenue Share (%), by Country 2025 & 2033
- Figure 62: Middle East and Africa BTX Industry Volume Share (%), by Country 2025 & 2033
List of Tables
- Table 1: Global BTX Industry Revenue billion Forecast, by Type 2020 & 2033
- Table 2: Global BTX Industry Volume Million Forecast, by Type 2020 & 2033
- Table 3: Global BTX Industry Revenue billion Forecast, by Product Application 2020 & 2033
- Table 4: Global BTX Industry Volume Million Forecast, by Product Application 2020 & 2033
- Table 5: Global BTX Industry Revenue billion Forecast, by Region 2020 & 2033
- Table 6: Global BTX Industry Volume Million Forecast, by Region 2020 & 2033
- Table 7: Global BTX Industry Revenue billion Forecast, by Type 2020 & 2033
- Table 8: Global BTX Industry Volume Million Forecast, by Type 2020 & 2033
- Table 9: Global BTX Industry Revenue billion Forecast, by Product Application 2020 & 2033
- Table 10: Global BTX Industry Volume Million Forecast, by Product Application 2020 & 2033
- Table 11: Global BTX Industry Revenue billion Forecast, by Country 2020 & 2033
- Table 12: Global BTX Industry Volume Million Forecast, by Country 2020 & 2033
- Table 13: China BTX Industry Revenue (billion) Forecast, by Application 2020 & 2033
- Table 14: China BTX Industry Volume (Million) Forecast, by Application 2020 & 2033
- Table 15: India BTX Industry Revenue (billion) Forecast, by Application 2020 & 2033
- Table 16: India BTX Industry Volume (Million) Forecast, by Application 2020 & 2033
- Table 17: Japan BTX Industry Revenue (billion) Forecast, by Application 2020 & 2033
- Table 18: Japan BTX Industry Volume (Million) Forecast, by Application 2020 & 2033
- Table 19: South Korea BTX Industry Revenue (billion) Forecast, by Application 2020 & 2033
- Table 20: South Korea BTX Industry Volume (Million) Forecast, by Application 2020 & 2033
- Table 21: Rest of Asia Pacific BTX Industry Revenue (billion) Forecast, by Application 2020 & 2033
- Table 22: Rest of Asia Pacific BTX Industry Volume (Million) Forecast, by Application 2020 & 2033
- Table 23: Global BTX Industry Revenue billion Forecast, by Type 2020 & 2033
- Table 24: Global BTX Industry Volume Million Forecast, by Type 2020 & 2033
- Table 25: Global BTX Industry Revenue billion Forecast, by Product Application 2020 & 2033
- Table 26: Global BTX Industry Volume Million Forecast, by Product Application 2020 & 2033
- Table 27: Global BTX Industry Revenue billion Forecast, by Country 2020 & 2033
- Table 28: Global BTX Industry Volume Million Forecast, by Country 2020 & 2033
- Table 29: United States BTX Industry Revenue (billion) Forecast, by Application 2020 & 2033
- Table 30: United States BTX Industry Volume (Million) Forecast, by Application 2020 & 2033
- Table 31: Canada BTX Industry Revenue (billion) Forecast, by Application 2020 & 2033
- Table 32: Canada BTX Industry Volume (Million) Forecast, by Application 2020 & 2033
- Table 33: Mexico BTX Industry Revenue (billion) Forecast, by Application 2020 & 2033
- Table 34: Mexico BTX Industry Volume (Million) Forecast, by Application 2020 & 2033
- Table 35: Global BTX Industry Revenue billion Forecast, by Type 2020 & 2033
- Table 36: Global BTX Industry Volume Million Forecast, by Type 2020 & 2033
- Table 37: Global BTX Industry Revenue billion Forecast, by Product Application 2020 & 2033
- Table 38: Global BTX Industry Volume Million Forecast, by Product Application 2020 & 2033
- Table 39: Global BTX Industry Revenue billion Forecast, by Country 2020 & 2033
- Table 40: Global BTX Industry Volume Million Forecast, by Country 2020 & 2033
- Table 41: Germany BTX Industry Revenue (billion) Forecast, by Application 2020 & 2033
- Table 42: Germany BTX Industry Volume (Million) Forecast, by Application 2020 & 2033
- Table 43: United Kingdom BTX Industry Revenue (billion) Forecast, by Application 2020 & 2033
- Table 44: United Kingdom BTX Industry Volume (Million) Forecast, by Application 2020 & 2033
- Table 45: Italy BTX Industry Revenue (billion) Forecast, by Application 2020 & 2033
- Table 46: Italy BTX Industry Volume (Million) Forecast, by Application 2020 & 2033
- Table 47: France BTX Industry Revenue (billion) Forecast, by Application 2020 & 2033
- Table 48: France BTX Industry Volume (Million) Forecast, by Application 2020 & 2033
- Table 49: Rest of Europe BTX Industry Revenue (billion) Forecast, by Application 2020 & 2033
- Table 50: Rest of Europe BTX Industry Volume (Million) Forecast, by Application 2020 & 2033
- Table 51: Global BTX Industry Revenue billion Forecast, by Type 2020 & 2033
- Table 52: Global BTX Industry Volume Million Forecast, by Type 2020 & 2033
- Table 53: Global BTX Industry Revenue billion Forecast, by Product Application 2020 & 2033
- Table 54: Global BTX Industry Volume Million Forecast, by Product Application 2020 & 2033
- Table 55: Global BTX Industry Revenue billion Forecast, by Country 2020 & 2033
- Table 56: Global BTX Industry Volume Million Forecast, by Country 2020 & 2033
- Table 57: Brazil BTX Industry Revenue (billion) Forecast, by Application 2020 & 2033
- Table 58: Brazil BTX Industry Volume (Million) Forecast, by Application 2020 & 2033
- Table 59: Argentina BTX Industry Revenue (billion) Forecast, by Application 2020 & 2033
- Table 60: Argentina BTX Industry Volume (Million) Forecast, by Application 2020 & 2033
- Table 61: Rest of South America BTX Industry Revenue (billion) Forecast, by Application 2020 & 2033
- Table 62: Rest of South America BTX Industry Volume (Million) Forecast, by Application 2020 & 2033
- Table 63: Global BTX Industry Revenue billion Forecast, by Type 2020 & 2033
- Table 64: Global BTX Industry Volume Million Forecast, by Type 2020 & 2033
- Table 65: Global BTX Industry Revenue billion Forecast, by Product Application 2020 & 2033
- Table 66: Global BTX Industry Volume Million Forecast, by Product Application 2020 & 2033
- Table 67: Global BTX Industry Revenue billion Forecast, by Country 2020 & 2033
- Table 68: Global BTX Industry Volume Million Forecast, by Country 2020 & 2033
- Table 69: Saudi Arabia BTX Industry Revenue (billion) Forecast, by Application 2020 & 2033
- Table 70: Saudi Arabia BTX Industry Volume (Million) Forecast, by Application 2020 & 2033
- Table 71: South Africa BTX Industry Revenue (billion) Forecast, by Application 2020 & 2033
- Table 72: South Africa BTX Industry Volume (Million) Forecast, by Application 2020 & 2033
- Table 73: Rest of Middle East and Africa BTX Industry Revenue (billion) Forecast, by Application 2020 & 2033
- Table 74: Rest of Middle East and Africa BTX Industry Volume (Million) Forecast, by Application 2020 & 2033
Frequently Asked Questions
1. What is the projected Compound Annual Growth Rate (CAGR) of the BTX Industry?
The projected CAGR is approximately 4.6%.
2. Which companies are prominent players in the BTX Industry?
Key companies in the market include Shell PLC, Formosa Plastics Group, JX Nippon Oil & Gas Exploration Corporation (Eneos), Exxon Mobil Corporation, Chevron Phillips Chemical Company LLC, YEOCHUN NCC CO LTD*List Not Exhaustive, IRPC Public Company Limited, INEOS, China Petroleum & Chemical Corporation Limited (SINOPEC), Reliance Industries Limited, China National Petroleum Corporation, China National Offshore Oil Corporation (CNOOC), BASF SE, OCI LTD, Totalenergies, SABIC, Dow, MITSUBISHI GAS CHEMICAL COMPANY INC, GS Caltex Corporation, JFE Chemical Corporation, SK Innovation Co Ltd, BP PLC, S-OIL Corporation.
3. What are the main segments of the BTX Industry?
The market segments include Type, Product Application .
4. Can you provide details about the market size?
The market size is estimated to be USD 8.07 billion as of 2022.
5. What are some drivers contributing to market growth?
Increasing Investments in Capacity Expansions is Driving the Growth of Paraxylene. Xylene. and Benzene; Increasing Demand for Toluene from Paints. Coatings. and Adhesives.
6. What are the notable trends driving market growth?
Ethylbenzene is Expected to Dominate the Benzene by Application Segment.
7. Are there any restraints impacting market growth?
Hazards Associated with Benzene-toluene-xylene (BTX).
8. Can you provide examples of recent developments in the market?
The recent developments pertaining to the major players in the market are being covered in the complete study.
9. What pricing options are available for accessing the report?
Pricing options include single-user, multi-user, and enterprise licenses priced at USD 4750, USD 5250, and USD 8750 respectively.
10. Is the market size provided in terms of value or volume?
The market size is provided in terms of value, measured in billion and volume, measured in Million.
11. Are there any specific market keywords associated with the report?
Yes, the market keyword associated with the report is "BTX Industry," which aids in identifying and referencing the specific market segment covered.
12. How do I determine which pricing option suits my needs best?
The pricing options vary based on user requirements and access needs. Individual users may opt for single-user licenses, while businesses requiring broader access may choose multi-user or enterprise licenses for cost-effective access to the report.
13. Are there any additional resources or data provided in the BTX Industry report?
While the report offers comprehensive insights, it's advisable to review the specific contents or supplementary materials provided to ascertain if additional resources or data are available.
14. How can I stay updated on further developments or reports in the BTX Industry?
To stay informed about further developments, trends, and reports in the BTX Industry, consider subscribing to industry newsletters, following relevant companies and organizations, or regularly checking reputable industry news sources and publications.
Methodology
Step 1 - Identification of Relevant Samples Size from Population Database


Step 2 - Approaches for Defining Global Market Size (Value, Volume* & Price*)

Note*: In applicable scenarios
Step 3 - Data Sources
Primary Research
- Web Analytics
- Survey Reports
- Research Institute
- Latest Research Reports
- Opinion Leaders
Secondary Research
- Annual Reports
- White Paper
- Latest Press Release
- Industry Association
- Paid Database
- Investor Presentations

Step 4 - Data Triangulation
Involves using different sources of information in order to increase the validity of a study
These sources are likely to be stakeholders in a program - participants, other researchers, program staff, other community members, and so on.
Then we put all data in single framework & apply various statistical tools to find out the dynamic on the market.
During the analysis stage, feedback from the stakeholder groups would be compared to determine areas of agreement as well as areas of divergence