


Key Insights
The global Brain Imaging Modalities and Software market is set for substantial growth, projected to reach $5.08 billion by 2025, with a Compound Annual Growth Rate (CAGR) of 7.2% through 2033. This expansion is driven by the increasing incidence of neurological conditions like Alzheimer's, Parkinson's, epilepsy, and stroke, necessitating advanced diagnostic and analytical tools. Innovations in imaging technologies, such as enhanced resolution, reduced scan times, and multi-modal integration, are key accelerators. The development of sophisticated AI-driven brain analysis software is transforming image interpretation, facilitating earlier and more accurate diagnoses, personalized treatment strategies, and improved patient outcomes. Growing applications in adult and pediatric neurology, alongside increased investment in neurodegenerative disease research, further bolster this market's upward trend.

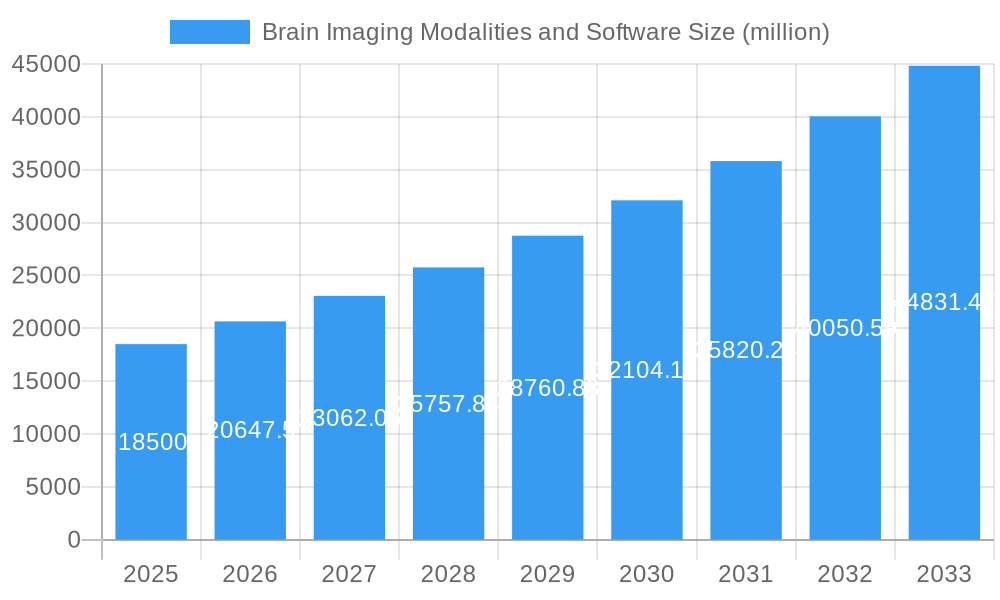
Brain Imaging Modalities and Software Market Size (In Billion)

Key market trends influencing expansion include the significant adoption of Artificial Intelligence (AI) and Machine Learning (ML) for predictive image analysis, easing the burden on radiologists. The integration of diverse brain imaging modalities (MRI, CT, PET, EEG) offers a holistic view of brain function and pathology. Rising healthcare expenditures, particularly in emerging economies, and increased public awareness of early neurological health assessment contribute to market penetration. Potential growth moderation may arise from the high cost of advanced imaging equipment and the requirement for skilled personnel. However, the persistent demand for precise neurological diagnostics and continuous innovation in hardware and software are expected to overcome these challenges, ensuring a positive market outlook.
Brain Imaging Modalities and Software Company Market Share
This report provides a comprehensive analysis of the Brain Imaging Modalities and Software market, detailing market size, growth forecasts, and competitive dynamics from 2019 to 2033, with a base year of 2025. It offers critical insights for stakeholders navigating the evolving landscape of neurological diagnostics and therapeutics, examining market interdependencies and identifying future opportunities in brain health.
Brain Imaging Modalities and Software Market Dynamics & Structure
The global brain imaging modalities and software market is characterized by moderate concentration, with key players investing heavily in research and development to drive technological innovation. Factors such as advancements in MRI, CT, PET, and EEG technologies, coupled with sophisticated AI-powered analysis software, are pivotal to market expansion. Stringent regulatory frameworks from bodies like the FDA and EMA ensure the safety and efficacy of new products, while also presenting innovation barriers. Competitive product substitutes, though evolving, are primarily focused on enhancing diagnostic accuracy and reducing examination times. The end-user demographic is broad, encompassing adults with a wide range of neurological conditions and a growing pediatric and infant segment, demanding specialized imaging solutions. Mergers and acquisitions (M&A) are becoming increasingly prevalent as larger companies seek to consolidate their market positions and acquire novel technologies. For instance, the past few years have seen an average of 3-5 significant M&A deals annually, indicating strategic consolidation.
- Market Concentration: Moderate, with a mix of large established players and innovative smaller companies.
- Technological Innovation Drivers: AI/ML integration, higher resolution imaging, portable imaging solutions, and advanced data processing.
- Regulatory Frameworks: FDA, EMA, and other national health authorities play a crucial role in product approval and market access.
- Competitive Product Substitutes: While distinct, advancements in one modality can impact the adoption of others (e.g., improved MRI resolution potentially reducing reliance on certain CT applications).
- End-User Demographics: Adults (neurological disorders, aging population) and Pediatrics & Infants (developmental disorders, congenital anomalies).
- M&A Trends: Strategic acquisitions focused on AI capabilities and specialized imaging software are on the rise.
Brain Imaging Modalities and Software Growth Trends & Insights
The brain imaging modalities and software market is poised for robust expansion, driven by an escalating global burden of neurological disorders and an increasing demand for accurate and early diagnosis. Our analysis, leveraging [placeholder for data source - e.g., comprehensive market research data], indicates a significant market size evolution. In the base year of 2025, the market is estimated to be valued at approximately $18,500 million, with a projected Compound Annual Growth Rate (CAGR) of 7.5% during the forecast period of 2025–2033. This growth is fueled by remarkable adoption rates of advanced imaging techniques, particularly within the Brain Analysis Software segment, which is experiencing a CAGR of 9.2% due to the integration of artificial intelligence and machine learning for enhanced pattern recognition and predictive diagnostics. Technological disruptions, such as the development of functional MRI (fMRI) and diffusion tensor imaging (DTI), are revolutionizing our understanding of brain function and connectivity, leading to improved diagnostic capabilities for conditions like Alzheimer's disease, Parkinson's disease, and stroke.
Consumer behavior shifts are also playing a crucial role. There is a growing patient and physician preference for non-invasive diagnostic procedures that offer higher precision. This trend is driving demand for sophisticated Brain Imaging Modalities like high-resolution MRI and advanced PET scanners. The increasing awareness and early screening initiatives for neurological diseases contribute to a higher market penetration, especially in developed economies. Furthermore, the pediatric and infant segment, while smaller, presents a significant growth opportunity due to the critical need for early detection of developmental and congenital brain abnormalities. The overall market penetration for advanced brain imaging solutions, which stood at approximately 35% in 2019, is projected to reach over 60% by 2033. The integration of cloud-based platforms for data storage and remote analysis further enhances accessibility and collaborative research, accelerating market growth.
Dominant Regions, Countries, or Segments in Brain Imaging Modalities and Software
North America, particularly the United States, is a dominant force in the brain imaging modalities and software market, driven by a confluence of factors that foster innovation and adoption. In the base year of 2025, North America is estimated to hold a market share of approximately 38% of the global market, with a projected growth rate of 8.1% during the forecast period. The region's dominance is fueled by a robust healthcare infrastructure, significant government and private funding for neurological research, and a high prevalence of neurological disorders, including Alzheimer's disease and stroke, which are major drivers for brain imaging utilization in the Adults application segment. Furthermore, the presence of leading research institutions and a substantial number of key industry players, such as General Electric, Siemens Healthineers AG, and Koninklijke Philips N.V., contribute to a highly competitive and innovative market environment.
The Brain Analysis Software segment is a key growth driver within North America, experiencing a CAGR of 9.5% due to the rapid integration of AI and machine learning technologies. This segment is critical for interpreting the complex data generated by advanced Brain Imaging Modalities. The Pediatrics and Infants segment, while smaller in absolute market size, exhibits a higher growth potential due to the increasing focus on early diagnosis and intervention for pediatric neurological conditions. Government initiatives promoting precision medicine and early disease detection further bolster the market in this region. Economic policies that incentivize technological adoption in healthcare, coupled with a well-established reimbursement landscape for advanced diagnostic procedures, create a favorable ecosystem for market expansion. The United States, specifically, accounts for the largest share within North America, estimated at 75% of the regional market in 2025, owing to its advanced healthcare system and substantial investment in R&D.
- Dominant Region: North America, led by the United States.
- Key Drivers in North America:
- High prevalence of neurological disorders (Alzheimer's, stroke).
- Advanced healthcare infrastructure and reimbursement policies.
- Significant R&D investment and presence of major industry players.
- Rapid adoption of AI in brain analysis software.
- Government initiatives promoting precision medicine and early diagnosis.
- Dominant Application Segment: Adults.
- Dominant Type Segment: Brain Analysis Software.
- Growth Potential in Pediatrics and Infants: High due to focus on early intervention.
- Market Share (North America, 2025): ~38%.
- CAGR (North America, 2025-2033): ~8.1%.
Brain Imaging Modalities and Software Product Landscape
The Brain Imaging Modalities and Software market is characterized by continuous product innovation, focusing on enhanced resolution, faster scan times, and portable designs for Brain Imaging Modalities. Technologies like 7T MRI scanners and advanced PET tracers offer unprecedented detail, enabling earlier and more accurate diagnosis of complex neurological conditions. Simultaneously, Brain Analysis Software is evolving with sophisticated AI algorithms capable of automating image segmentation, identifying subtle anomalies, and predicting disease progression. Quantib and Brainomix are at the forefront of developing AI-powered solutions for stroke and neurodegenerative disease analysis, while companies like Siemens Healthineers AG and Koninklijke Philips N.V. are integrating advanced AI into their comprehensive imaging platforms. Fujifilm Holdings is also making strides in dual-energy CT for enhanced neuroimaging.
Key Drivers, Barriers & Challenges in Brain Imaging Modalities and Software
Key Drivers:
- Increasing Prevalence of Neurological Disorders: Rising rates of Alzheimer's, Parkinson's, stroke, and epilepsy globally are a primary growth catalyst.
- Technological Advancements: Development of higher resolution imaging modalities (e.g., 7T MRI) and sophisticated AI-powered analysis software.
- Growing Awareness and Early Diagnosis Initiatives: Increased patient and clinician focus on early detection and intervention for better treatment outcomes.
- Government Support and Funding: Investments in neuroscience research and healthcare infrastructure modernization.
- Demand for Precision Medicine: Tailoring treatments based on individual patient data, heavily reliant on advanced imaging.
Barriers & Challenges:
- High Cost of Equipment and Software: Significant capital investment is required for advanced brain imaging modalities and their associated software, limiting adoption in resource-constrained settings.
- Regulatory Hurdles: Stringent approval processes for new imaging techniques and AI algorithms can lead to lengthy market entry times.
- Data Security and Privacy Concerns: The sensitive nature of brain imaging data necessitates robust cybersecurity measures, adding complexity and cost.
- Reimbursement Policies: Inconsistent or inadequate reimbursement for advanced neuroimaging procedures in some regions can hinder market growth.
- Shortage of Skilled Professionals: A lack of trained radiologists, neurologists, and data scientists proficient in interpreting advanced brain imaging data poses a challenge.
- Integration Challenges: Seamless integration of new imaging modalities and software with existing hospital IT systems can be complex.
Emerging Opportunities in Brain Imaging Modalities and Software
Emerging opportunities lie in the development of portable and cost-effective brain imaging solutions for remote and underserved areas, expanding access to critical diagnostics. The integration of quantitative imaging biomarkers derived from AI analysis software into clinical decision-making for a wider range of neurological conditions presents a significant avenue. Furthermore, the application of brain imaging in psychiatric disorders and personalized treatment response monitoring is a rapidly growing field. The development of advanced neurofeedback systems powered by real-time brain imaging data also holds immense potential. Collaborations between imaging companies and pharmaceutical firms for drug development and clinical trial support using imaging endpoints are expected to increase.
Growth Accelerators in the Brain Imaging Modalities and Software Industry
Several factors are accelerating growth in the brain imaging modalities and software industry. The relentless pace of technological innovation, particularly in artificial intelligence and machine learning, is enhancing diagnostic accuracy and efficiency. Strategic partnerships between modality manufacturers and software developers are creating integrated solutions that streamline workflows. The increasing focus on preventative healthcare and the proactive management of neurological diseases are driving demand for early detection tools. Furthermore, the expanding application of brain imaging beyond traditional neurological disorders into areas like mental health and cognitive neuroscience is opening new market avenues. The growing elderly population globally, prone to neurodegenerative diseases, also represents a significant long-term growth driver.
Key Players Shaping the Brain Imaging Modalities and Software Market
- Quantib
- Brainomix
- General Electric
- Imaging Biometrics
- United Imaging Healthcare Co
- Siemens Healthineers AG
- Koninklijke Philips N.V.
- Canon
- Vuno
- Aspect Imaging
- IXICO
- QMENTA
- I. Analysis
- Fujifilm Holdings
- Other Prominent Players
Notable Milestones in Brain Imaging Modalities and Software Sector
- 2019: Launch of advanced AI algorithms for stroke imaging analysis by companies like Viz.ai, significantly improving triage times.
- 2020: Introduction of novel PET tracers for earlier detection of amyloid plaques associated with Alzheimer's disease.
- 2021: Siemens Healthineers AG announces significant investments in AI research for neuroimaging, focusing on automation and predictive analytics.
- 2022: Koninklijke Philips N.V. expands its portfolio with integrated solutions for neurological imaging and analysis, emphasizing patient-centric workflows.
- 2023: Quantib receives FDA clearance for its AI-powered software to quantify white matter hyperintensities, aiding in the assessment of small vessel disease.
- 2024: Brainomix launches its latest AI platform for comprehensive stroke management, integrating imaging and clinical data for faster decision-making.
- 2024: United Imaging Healthcare Co. showcases its next-generation MRI technology with enhanced resolution and speed for complex brain imaging.
In-Depth Brain Imaging Modalities and Software Market Outlook
The Brain Imaging Modalities and Software market is set for a period of sustained and accelerated growth. The confluence of technological advancements, particularly in AI, and the escalating global demand for improved neurological diagnostics will act as primary growth accelerators. Strategic collaborations and the development of integrated, end-to-end solutions will further empower healthcare providers. The increasing recognition of the importance of early intervention for neurological conditions, coupled with a growing elderly population, underpins a robust long-term market potential. Companies that can effectively leverage AI, offer scalable and accessible solutions, and adapt to evolving regulatory landscapes will be best positioned to capitalize on the significant opportunities within this vital sector of healthcare.
Brain Imaging Modalities and Software Segmentation
-
1. Application
- 1.1. Adults
- 1.2. Pediatrics and Infants
-
2. Types
- 2.1. Brain Imaging Modalities
- 2.2. Brain Analysis Software
Brain Imaging Modalities and Software Segmentation By Geography
-
1. North America
- 1.1. United States
- 1.2. Canada
- 1.3. Mexico
-
2. South America
- 2.1. Brazil
- 2.2. Argentina
- 2.3. Rest of South America
-
3. Europe
- 3.1. United Kingdom
- 3.2. Germany
- 3.3. France
- 3.4. Italy
- 3.5. Spain
- 3.6. Russia
- 3.7. Benelux
- 3.8. Nordics
- 3.9. Rest of Europe
-
4. Middle East & Africa
- 4.1. Turkey
- 4.2. Israel
- 4.3. GCC
- 4.4. North Africa
- 4.5. South Africa
- 4.6. Rest of Middle East & Africa
-
5. Asia Pacific
- 5.1. China
- 5.2. India
- 5.3. Japan
- 5.4. South Korea
- 5.5. ASEAN
- 5.6. Oceania
- 5.7. Rest of Asia Pacific

Brain Imaging Modalities and Software Regional Market Share
Geographic Coverage of Brain Imaging Modalities and Software
Brain Imaging Modalities and Software REPORT HIGHLIGHTS
| Aspects | Details |
|---|---|
| Study Period | 2020-2034 |
| Base Year | 2025 |
| Estimated Year | 2026 |
| Forecast Period | 2026-2034 |
| Historical Period | 2020-2025 |
| Growth Rate | CAGR of 7.2% from 2020-2034 |
| Segmentation |
|
Table of Contents
- 1. Introduction
- 1.1. Research Scope
- 1.2. Market Segmentation
- 1.3. Research Methodology
- 1.4. Definitions and Assumptions
- 2. Executive Summary
- 2.1. Introduction
- 3. Market Dynamics
- 3.1. Introduction
- 3.2. Market Drivers
- 3.3. Market Restrains
- 3.4. Market Trends
- 4. Market Factor Analysis
- 4.1. Porters Five Forces
- 4.2. Supply/Value Chain
- 4.3. PESTEL analysis
- 4.4. Market Entropy
- 4.5. Patent/Trademark Analysis
- 5. Global Brain Imaging Modalities and Software Analysis, Insights and Forecast, 2020-2032
- 5.1. Market Analysis, Insights and Forecast - by Application
- 5.1.1. Adults
- 5.1.2. Pediatrics and Infants
- 5.2. Market Analysis, Insights and Forecast - by Types
- 5.2.1. Brain Imaging Modalities
- 5.2.2. Brain Analysis Software
- 5.3. Market Analysis, Insights and Forecast - by Region
- 5.3.1. North America
- 5.3.2. South America
- 5.3.3. Europe
- 5.3.4. Middle East & Africa
- 5.3.5. Asia Pacific
- 5.1. Market Analysis, Insights and Forecast - by Application
- 6. North America Brain Imaging Modalities and Software Analysis, Insights and Forecast, 2020-2032
- 6.1. Market Analysis, Insights and Forecast - by Application
- 6.1.1. Adults
- 6.1.2. Pediatrics and Infants
- 6.2. Market Analysis, Insights and Forecast - by Types
- 6.2.1. Brain Imaging Modalities
- 6.2.2. Brain Analysis Software
- 6.1. Market Analysis, Insights and Forecast - by Application
- 7. South America Brain Imaging Modalities and Software Analysis, Insights and Forecast, 2020-2032
- 7.1. Market Analysis, Insights and Forecast - by Application
- 7.1.1. Adults
- 7.1.2. Pediatrics and Infants
- 7.2. Market Analysis, Insights and Forecast - by Types
- 7.2.1. Brain Imaging Modalities
- 7.2.2. Brain Analysis Software
- 7.1. Market Analysis, Insights and Forecast - by Application
- 8. Europe Brain Imaging Modalities and Software Analysis, Insights and Forecast, 2020-2032
- 8.1. Market Analysis, Insights and Forecast - by Application
- 8.1.1. Adults
- 8.1.2. Pediatrics and Infants
- 8.2. Market Analysis, Insights and Forecast - by Types
- 8.2.1. Brain Imaging Modalities
- 8.2.2. Brain Analysis Software
- 8.1. Market Analysis, Insights and Forecast - by Application
- 9. Middle East & Africa Brain Imaging Modalities and Software Analysis, Insights and Forecast, 2020-2032
- 9.1. Market Analysis, Insights and Forecast - by Application
- 9.1.1. Adults
- 9.1.2. Pediatrics and Infants
- 9.2. Market Analysis, Insights and Forecast - by Types
- 9.2.1. Brain Imaging Modalities
- 9.2.2. Brain Analysis Software
- 9.1. Market Analysis, Insights and Forecast - by Application
- 10. Asia Pacific Brain Imaging Modalities and Software Analysis, Insights and Forecast, 2020-2032
- 10.1. Market Analysis, Insights and Forecast - by Application
- 10.1.1. Adults
- 10.1.2. Pediatrics and Infants
- 10.2. Market Analysis, Insights and Forecast - by Types
- 10.2.1. Brain Imaging Modalities
- 10.2.2. Brain Analysis Software
- 10.1. Market Analysis, Insights and Forecast - by Application
- 11. Competitive Analysis
- 11.1. Global Market Share Analysis 2025
- 11.2. Company Profiles
- 11.2.1 Quantib
- 11.2.1.1. Overview
- 11.2.1.2. Products
- 11.2.1.3. SWOT Analysis
- 11.2.1.4. Recent Developments
- 11.2.1.5. Financials (Based on Availability)
- 11.2.2 Brainomix
- 11.2.2.1. Overview
- 11.2.2.2. Products
- 11.2.2.3. SWOT Analysis
- 11.2.2.4. Recent Developments
- 11.2.2.5. Financials (Based on Availability)
- 11.2.3 General Electric
- 11.2.3.1. Overview
- 11.2.3.2. Products
- 11.2.3.3. SWOT Analysis
- 11.2.3.4. Recent Developments
- 11.2.3.5. Financials (Based on Availability)
- 11.2.4 Imaging Biometrics
- 11.2.4.1. Overview
- 11.2.4.2. Products
- 11.2.4.3. SWOT Analysis
- 11.2.4.4. Recent Developments
- 11.2.4.5. Financials (Based on Availability)
- 11.2.5 United Imaging Healthcare Co
- 11.2.5.1. Overview
- 11.2.5.2. Products
- 11.2.5.3. SWOT Analysis
- 11.2.5.4. Recent Developments
- 11.2.5.5. Financials (Based on Availability)
- 11.2.6 Siemens
- 11.2.6.1. Overview
- 11.2.6.2. Products
- 11.2.6.3. SWOT Analysis
- 11.2.6.4. Recent Developments
- 11.2.6.5. Financials (Based on Availability)
- 11.2.7 Healthineers AG
- 11.2.7.1. Overview
- 11.2.7.2. Products
- 11.2.7.3. SWOT Analysis
- 11.2.7.4. Recent Developments
- 11.2.7.5. Financials (Based on Availability)
- 11.2.8 Koninklijke Philips N.V.
- 11.2.8.1. Overview
- 11.2.8.2. Products
- 11.2.8.3. SWOT Analysis
- 11.2.8.4. Recent Developments
- 11.2.8.5. Financials (Based on Availability)
- 11.2.9 Canon
- 11.2.9.1. Overview
- 11.2.9.2. Products
- 11.2.9.3. SWOT Analysis
- 11.2.9.4. Recent Developments
- 11.2.9.5. Financials (Based on Availability)
- 11.2.10 Vuno
- 11.2.10.1. Overview
- 11.2.10.2. Products
- 11.2.10.3. SWOT Analysis
- 11.2.10.4. Recent Developments
- 11.2.10.5. Financials (Based on Availability)
- 11.2.11 Aspect Imaging
- 11.2.11.1. Overview
- 11.2.11.2. Products
- 11.2.11.3. SWOT Analysis
- 11.2.11.4. Recent Developments
- 11.2.11.5. Financials (Based on Availability)
- 11.2.12 IXICO
- 11.2.12.1. Overview
- 11.2.12.2. Products
- 11.2.12.3. SWOT Analysis
- 11.2.12.4. Recent Developments
- 11.2.12.5. Financials (Based on Availability)
- 11.2.13 QMENTA
- 11.2.13.1. Overview
- 11.2.13.2. Products
- 11.2.13.3. SWOT Analysis
- 11.2.13.4. Recent Developments
- 11.2.13.5. Financials (Based on Availability)
- 11.2.14 I. Analysis
- 11.2.14.1. Overview
- 11.2.14.2. Products
- 11.2.14.3. SWOT Analysis
- 11.2.14.4. Recent Developments
- 11.2.14.5. Financials (Based on Availability)
- 11.2.15 Fujifilm Holdings
- 11.2.15.1. Overview
- 11.2.15.2. Products
- 11.2.15.3. SWOT Analysis
- 11.2.15.4. Recent Developments
- 11.2.15.5. Financials (Based on Availability)
- 11.2.16 Other Prominent Players
- 11.2.16.1. Overview
- 11.2.16.2. Products
- 11.2.16.3. SWOT Analysis
- 11.2.16.4. Recent Developments
- 11.2.16.5. Financials (Based on Availability)
- 11.2.1 Quantib
List of Figures
- Figure 1: Global Brain Imaging Modalities and Software Revenue Breakdown (billion, %) by Region 2025 & 2033
- Figure 2: North America Brain Imaging Modalities and Software Revenue (billion), by Application 2025 & 2033
- Figure 3: North America Brain Imaging Modalities and Software Revenue Share (%), by Application 2025 & 2033
- Figure 4: North America Brain Imaging Modalities and Software Revenue (billion), by Types 2025 & 2033
- Figure 5: North America Brain Imaging Modalities and Software Revenue Share (%), by Types 2025 & 2033
- Figure 6: North America Brain Imaging Modalities and Software Revenue (billion), by Country 2025 & 2033
- Figure 7: North America Brain Imaging Modalities and Software Revenue Share (%), by Country 2025 & 2033
- Figure 8: South America Brain Imaging Modalities and Software Revenue (billion), by Application 2025 & 2033
- Figure 9: South America Brain Imaging Modalities and Software Revenue Share (%), by Application 2025 & 2033
- Figure 10: South America Brain Imaging Modalities and Software Revenue (billion), by Types 2025 & 2033
- Figure 11: South America Brain Imaging Modalities and Software Revenue Share (%), by Types 2025 & 2033
- Figure 12: South America Brain Imaging Modalities and Software Revenue (billion), by Country 2025 & 2033
- Figure 13: South America Brain Imaging Modalities and Software Revenue Share (%), by Country 2025 & 2033
- Figure 14: Europe Brain Imaging Modalities and Software Revenue (billion), by Application 2025 & 2033
- Figure 15: Europe Brain Imaging Modalities and Software Revenue Share (%), by Application 2025 & 2033
- Figure 16: Europe Brain Imaging Modalities and Software Revenue (billion), by Types 2025 & 2033
- Figure 17: Europe Brain Imaging Modalities and Software Revenue Share (%), by Types 2025 & 2033
- Figure 18: Europe Brain Imaging Modalities and Software Revenue (billion), by Country 2025 & 2033
- Figure 19: Europe Brain Imaging Modalities and Software Revenue Share (%), by Country 2025 & 2033
- Figure 20: Middle East & Africa Brain Imaging Modalities and Software Revenue (billion), by Application 2025 & 2033
- Figure 21: Middle East & Africa Brain Imaging Modalities and Software Revenue Share (%), by Application 2025 & 2033
- Figure 22: Middle East & Africa Brain Imaging Modalities and Software Revenue (billion), by Types 2025 & 2033
- Figure 23: Middle East & Africa Brain Imaging Modalities and Software Revenue Share (%), by Types 2025 & 2033
- Figure 24: Middle East & Africa Brain Imaging Modalities and Software Revenue (billion), by Country 2025 & 2033
- Figure 25: Middle East & Africa Brain Imaging Modalities and Software Revenue Share (%), by Country 2025 & 2033
- Figure 26: Asia Pacific Brain Imaging Modalities and Software Revenue (billion), by Application 2025 & 2033
- Figure 27: Asia Pacific Brain Imaging Modalities and Software Revenue Share (%), by Application 2025 & 2033
- Figure 28: Asia Pacific Brain Imaging Modalities and Software Revenue (billion), by Types 2025 & 2033
- Figure 29: Asia Pacific Brain Imaging Modalities and Software Revenue Share (%), by Types 2025 & 2033
- Figure 30: Asia Pacific Brain Imaging Modalities and Software Revenue (billion), by Country 2025 & 2033
- Figure 31: Asia Pacific Brain Imaging Modalities and Software Revenue Share (%), by Country 2025 & 2033
List of Tables
- Table 1: Global Brain Imaging Modalities and Software Revenue billion Forecast, by Application 2020 & 2033
- Table 2: Global Brain Imaging Modalities and Software Revenue billion Forecast, by Types 2020 & 2033
- Table 3: Global Brain Imaging Modalities and Software Revenue billion Forecast, by Region 2020 & 2033
- Table 4: Global Brain Imaging Modalities and Software Revenue billion Forecast, by Application 2020 & 2033
- Table 5: Global Brain Imaging Modalities and Software Revenue billion Forecast, by Types 2020 & 2033
- Table 6: Global Brain Imaging Modalities and Software Revenue billion Forecast, by Country 2020 & 2033
- Table 7: United States Brain Imaging Modalities and Software Revenue (billion) Forecast, by Application 2020 & 2033
- Table 8: Canada Brain Imaging Modalities and Software Revenue (billion) Forecast, by Application 2020 & 2033
- Table 9: Mexico Brain Imaging Modalities and Software Revenue (billion) Forecast, by Application 2020 & 2033
- Table 10: Global Brain Imaging Modalities and Software Revenue billion Forecast, by Application 2020 & 2033
- Table 11: Global Brain Imaging Modalities and Software Revenue billion Forecast, by Types 2020 & 2033
- Table 12: Global Brain Imaging Modalities and Software Revenue billion Forecast, by Country 2020 & 2033
- Table 13: Brazil Brain Imaging Modalities and Software Revenue (billion) Forecast, by Application 2020 & 2033
- Table 14: Argentina Brain Imaging Modalities and Software Revenue (billion) Forecast, by Application 2020 & 2033
- Table 15: Rest of South America Brain Imaging Modalities and Software Revenue (billion) Forecast, by Application 2020 & 2033
- Table 16: Global Brain Imaging Modalities and Software Revenue billion Forecast, by Application 2020 & 2033
- Table 17: Global Brain Imaging Modalities and Software Revenue billion Forecast, by Types 2020 & 2033
- Table 18: Global Brain Imaging Modalities and Software Revenue billion Forecast, by Country 2020 & 2033
- Table 19: United Kingdom Brain Imaging Modalities and Software Revenue (billion) Forecast, by Application 2020 & 2033
- Table 20: Germany Brain Imaging Modalities and Software Revenue (billion) Forecast, by Application 2020 & 2033
- Table 21: France Brain Imaging Modalities and Software Revenue (billion) Forecast, by Application 2020 & 2033
- Table 22: Italy Brain Imaging Modalities and Software Revenue (billion) Forecast, by Application 2020 & 2033
- Table 23: Spain Brain Imaging Modalities and Software Revenue (billion) Forecast, by Application 2020 & 2033
- Table 24: Russia Brain Imaging Modalities and Software Revenue (billion) Forecast, by Application 2020 & 2033
- Table 25: Benelux Brain Imaging Modalities and Software Revenue (billion) Forecast, by Application 2020 & 2033
- Table 26: Nordics Brain Imaging Modalities and Software Revenue (billion) Forecast, by Application 2020 & 2033
- Table 27: Rest of Europe Brain Imaging Modalities and Software Revenue (billion) Forecast, by Application 2020 & 2033
- Table 28: Global Brain Imaging Modalities and Software Revenue billion Forecast, by Application 2020 & 2033
- Table 29: Global Brain Imaging Modalities and Software Revenue billion Forecast, by Types 2020 & 2033
- Table 30: Global Brain Imaging Modalities and Software Revenue billion Forecast, by Country 2020 & 2033
- Table 31: Turkey Brain Imaging Modalities and Software Revenue (billion) Forecast, by Application 2020 & 2033
- Table 32: Israel Brain Imaging Modalities and Software Revenue (billion) Forecast, by Application 2020 & 2033
- Table 33: GCC Brain Imaging Modalities and Software Revenue (billion) Forecast, by Application 2020 & 2033
- Table 34: North Africa Brain Imaging Modalities and Software Revenue (billion) Forecast, by Application 2020 & 2033
- Table 35: South Africa Brain Imaging Modalities and Software Revenue (billion) Forecast, by Application 2020 & 2033
- Table 36: Rest of Middle East & Africa Brain Imaging Modalities and Software Revenue (billion) Forecast, by Application 2020 & 2033
- Table 37: Global Brain Imaging Modalities and Software Revenue billion Forecast, by Application 2020 & 2033
- Table 38: Global Brain Imaging Modalities and Software Revenue billion Forecast, by Types 2020 & 2033
- Table 39: Global Brain Imaging Modalities and Software Revenue billion Forecast, by Country 2020 & 2033
- Table 40: China Brain Imaging Modalities and Software Revenue (billion) Forecast, by Application 2020 & 2033
- Table 41: India Brain Imaging Modalities and Software Revenue (billion) Forecast, by Application 2020 & 2033
- Table 42: Japan Brain Imaging Modalities and Software Revenue (billion) Forecast, by Application 2020 & 2033
- Table 43: South Korea Brain Imaging Modalities and Software Revenue (billion) Forecast, by Application 2020 & 2033
- Table 44: ASEAN Brain Imaging Modalities and Software Revenue (billion) Forecast, by Application 2020 & 2033
- Table 45: Oceania Brain Imaging Modalities and Software Revenue (billion) Forecast, by Application 2020 & 2033
- Table 46: Rest of Asia Pacific Brain Imaging Modalities and Software Revenue (billion) Forecast, by Application 2020 & 2033
Frequently Asked Questions
1. What is the projected Compound Annual Growth Rate (CAGR) of the Brain Imaging Modalities and Software?
The projected CAGR is approximately 7.2%.
2. Which companies are prominent players in the Brain Imaging Modalities and Software?
Key companies in the market include Quantib, Brainomix, General Electric, Imaging Biometrics, United Imaging Healthcare Co, Siemens, Healthineers AG, Koninklijke Philips N.V., Canon, Vuno, Aspect Imaging, IXICO, QMENTA, I. Analysis, Fujifilm Holdings, Other Prominent Players.
3. What are the main segments of the Brain Imaging Modalities and Software?
The market segments include Application, Types.
4. Can you provide details about the market size?
The market size is estimated to be USD 5.08 billion as of 2022.
5. What are some drivers contributing to market growth?
N/A
6. What are the notable trends driving market growth?
N/A
7. Are there any restraints impacting market growth?
N/A
8. Can you provide examples of recent developments in the market?
N/A
9. What pricing options are available for accessing the report?
Pricing options include single-user, multi-user, and enterprise licenses priced at USD 4350.00, USD 6525.00, and USD 8700.00 respectively.
10. Is the market size provided in terms of value or volume?
The market size is provided in terms of value, measured in billion.
11. Are there any specific market keywords associated with the report?
Yes, the market keyword associated with the report is "Brain Imaging Modalities and Software," which aids in identifying and referencing the specific market segment covered.
12. How do I determine which pricing option suits my needs best?
The pricing options vary based on user requirements and access needs. Individual users may opt for single-user licenses, while businesses requiring broader access may choose multi-user or enterprise licenses for cost-effective access to the report.
13. Are there any additional resources or data provided in the Brain Imaging Modalities and Software report?
While the report offers comprehensive insights, it's advisable to review the specific contents or supplementary materials provided to ascertain if additional resources or data are available.
14. How can I stay updated on further developments or reports in the Brain Imaging Modalities and Software?
To stay informed about further developments, trends, and reports in the Brain Imaging Modalities and Software, consider subscribing to industry newsletters, following relevant companies and organizations, or regularly checking reputable industry news sources and publications.
Methodology
Step 1 - Identification of Relevant Samples Size from Population Database


Step 2 - Approaches for Defining Global Market Size (Value, Volume* & Price*)

Note*: In applicable scenarios
Step 3 - Data Sources
Primary Research
- Web Analytics
- Survey Reports
- Research Institute
- Latest Research Reports
- Opinion Leaders
Secondary Research
- Annual Reports
- White Paper
- Latest Press Release
- Industry Association
- Paid Database
- Investor Presentations

Step 4 - Data Triangulation
Involves using different sources of information in order to increase the validity of a study
These sources are likely to be stakeholders in a program - participants, other researchers, program staff, other community members, and so on.
Then we put all data in single framework & apply various statistical tools to find out the dynamic on the market.
During the analysis stage, feedback from the stakeholder groups would be compared to determine areas of agreement as well as areas of divergence