
Key Insights
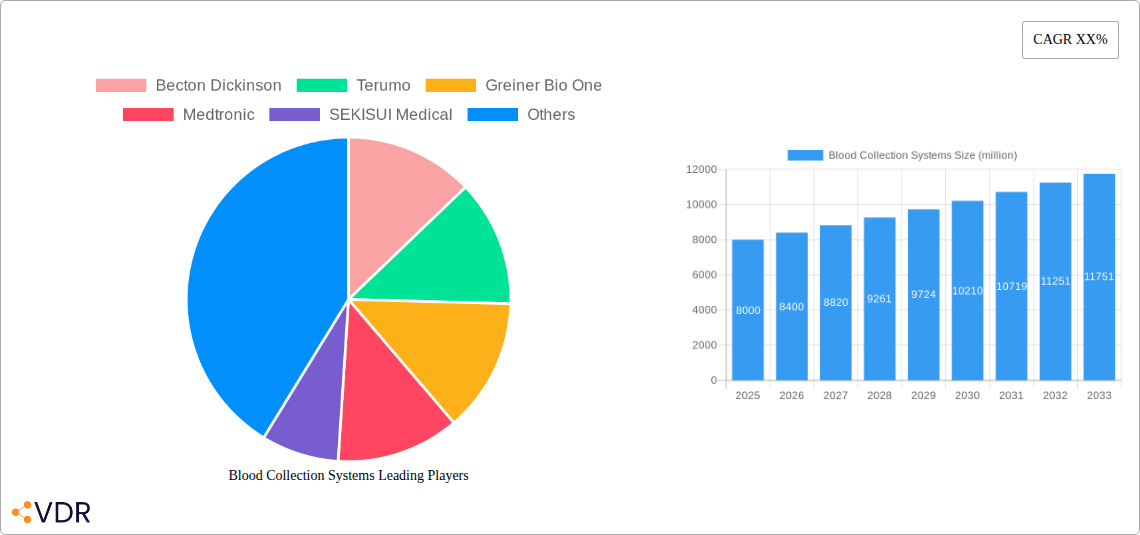
The global blood collection systems market is experiencing robust growth, driven by several key factors. The increasing prevalence of chronic diseases necessitating frequent blood tests, coupled with advancements in minimally invasive procedures and point-of-care diagnostics, fuels demand for efficient and reliable blood collection systems. Technological innovations, such as vacuum blood collection tubes with improved safety features and integrated barcode technology for enhanced sample tracking and reduced errors, are further stimulating market expansion. The rising geriatric population, a significant contributor to the demand for blood tests, is another key driver. Furthermore, government initiatives promoting preventative healthcare and disease screening programs are contributing to the market's overall expansion. We estimate the market size in 2025 to be around $8 billion, with a Compound Annual Growth Rate (CAGR) of approximately 5% projected for the forecast period (2025-2033). This growth, however, faces some restraints. Price sensitivity in certain emerging markets and stringent regulatory approvals for new products can pose challenges.
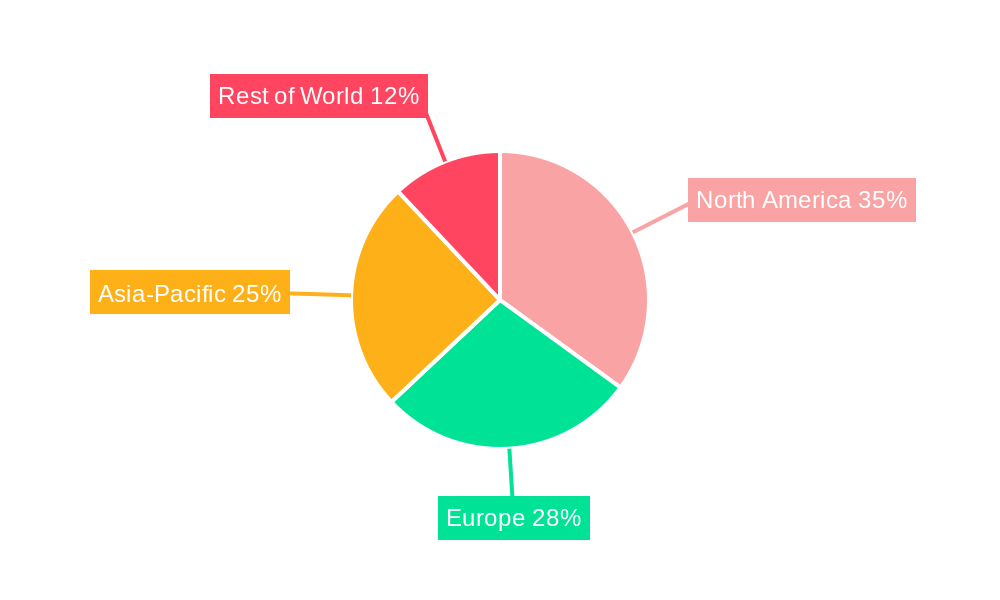
The market is segmented by product type (needles, tubes, collection sets, etc.), end-user (hospitals, diagnostic laboratories, etc.), and geography. Key players like Becton Dickinson, Terumo, Greiner Bio-One, and Medtronic are leveraging their strong distribution networks and research capabilities to maintain their market positions. The competitive landscape is characterized by both established players and emerging companies vying for market share through product innovation and strategic partnerships. Regional growth is expected to vary, with North America and Europe maintaining significant shares due to established healthcare infrastructure and high adoption rates of advanced technologies. However, rapidly developing economies in Asia-Pacific are expected to show significant growth potential owing to rising healthcare expenditure and increasing awareness of preventative healthcare.
Blood Collection Systems Market Report: 2019-2033
This comprehensive report provides a detailed analysis of the global Blood Collection Systems market, encompassing historical data (2019-2024), current estimates (2025), and future forecasts (2025-2033). The report segments the market by product type (e.g., Vacuum Blood Collection Tubes, Syringes, Needles, Safety-engineered devices) and end-users (hospitals, diagnostic labs, blood banks, home healthcare). It examines market dynamics, growth trends, regional performance, and competitive landscapes, offering invaluable insights for stakeholders across the parent market (Medical Devices) and child market (In-vitro diagnostics). The market size is valued in million units.
Blood Collection Systems Market Dynamics & Structure
The global Blood Collection Systems market exhibits moderate concentration, with key players such as Becton Dickinson, Terumo, and Greiner Bio-One holding significant market share (estimated at xx% combined in 2025). Technological innovation, particularly in safety features and automation, is a primary driver. Stringent regulatory frameworks, varying by region, influence market access and product design. Competitive substitutes, such as alternative blood collection methods, pose a moderate challenge. End-user demographics, with an aging global population increasing demand for diagnostic testing, fuel market growth. M&A activity has been moderate in recent years, with approximately xx deals recorded between 2019 and 2024.
- Market Concentration: Moderately concentrated, with top 3 players holding xx% market share in 2025.
- Technological Innovation: Focus on safety, automation, and improved sample quality.
- Regulatory Frameworks: Varying regulations across regions impact product approvals and market access.
- Competitive Substitutes: Alternative blood collection methods present moderate competition.
- End-User Demographics: Aging population and increasing demand for diagnostics drive growth.
- M&A Activity: Approximately xx deals between 2019 and 2024.
Blood Collection Systems Growth Trends & Insights
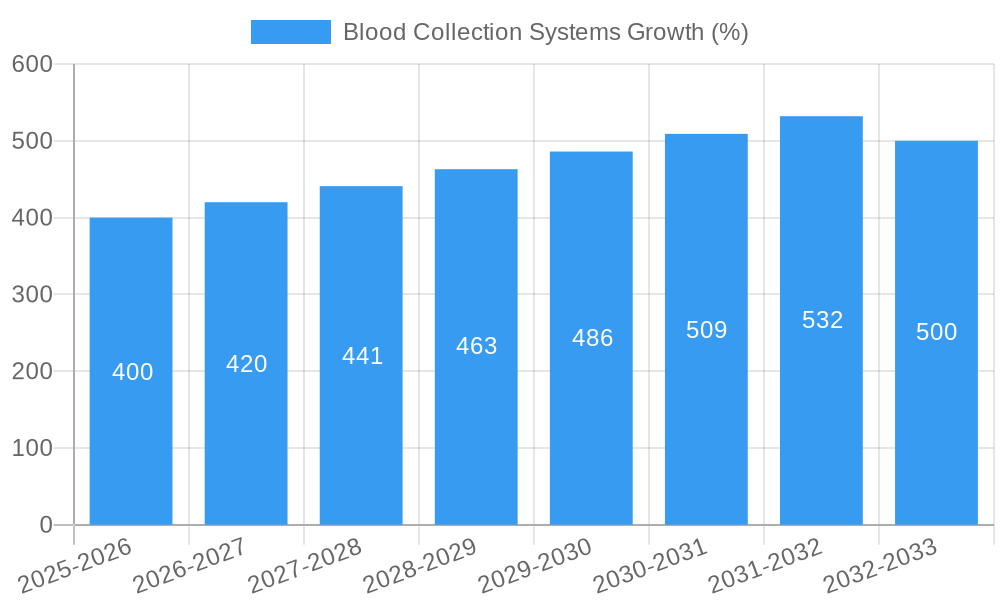
The global Blood Collection Systems market experienced a CAGR of xx% during the historical period (2019-2024), reaching an estimated market size of xx million units in 2025. Adoption rates are influenced by factors such as healthcare infrastructure development, rising prevalence of chronic diseases, and increasing awareness of preventive healthcare. Technological advancements, including the introduction of advanced safety features and automated systems, are driving market growth. Shifting consumer preferences toward convenient and efficient healthcare solutions also contribute to market expansion. The forecast period (2025-2033) projects a CAGR of xx%, driven by continuous technological advancements, increasing demand from emerging economies, and rising healthcare expenditure. Market penetration in developing regions remains a key opportunity.
Dominant Regions, Countries, or Segments in Blood Collection Systems
North America currently holds the largest market share in Blood Collection Systems, driven by advanced healthcare infrastructure, high healthcare expenditure, and a large aging population. Europe follows as a significant market, with strong regulatory frameworks and a well-established healthcare system. Asia-Pacific is experiencing rapid growth, fueled by rising healthcare spending, increasing prevalence of chronic diseases, and expanding healthcare infrastructure.
- North America: High healthcare expenditure, advanced infrastructure, and aging population drive dominance.
- Europe: Strong regulatory frameworks and established healthcare systems contribute to significant market share.
- Asia-Pacific: Rapid growth fueled by rising healthcare spending and expanding infrastructure.
- Other Regions: Significant growth potential in developing economies with increasing healthcare investment.
Blood Collection Systems Product Landscape
The blood collection systems market offers a diverse product landscape, encompassing vacuum blood collection tubes (various additives), syringes, needles, and increasingly, safety-engineered devices designed to minimize needlestick injuries. Technological advancements focus on improved sample quality, reduced hemolysis, and enhanced safety features. Unique selling propositions include rapid sample processing capabilities and integrated barcode systems for efficient tracking and identification.
Key Drivers, Barriers & Challenges in Blood Collection Systems
Key Drivers: Rising prevalence of chronic diseases, increasing diagnostic testing volume, technological advancements (e.g., automation, safety features), and growing healthcare infrastructure in emerging markets.
Key Challenges: Stringent regulatory approvals impacting product launches (estimated xx% delay in time-to-market), supply chain disruptions affecting raw material availability and manufacturing (xx% increase in production costs in 2024 due to supply chain issues), and intense competition among established and emerging players.
Emerging Opportunities in Blood Collection Systems
Emerging opportunities include the growing adoption of point-of-care diagnostics, increasing demand for home healthcare solutions, and the development of innovative products with improved safety and efficiency. Untapped markets in developing countries and the potential for integration with other healthcare technologies (e.g., lab information systems) present significant growth potential.
Growth Accelerators in the Blood Collection Systems Industry
Technological breakthroughs in areas such as automated blood collection systems and improved sample handling techniques are accelerating market growth. Strategic partnerships between manufacturers and healthcare providers, coupled with expansion into emerging markets, further contribute to long-term growth.
Key Players Shaping the Blood Collection Systems Market
- Becton Dickinson
- Terumo
- Greiner Bio-One
- Medtronic
- SEKISUI Medical
- Sarstedt
- Narang Medical
- F.L. Medical
- Improve-medical
- Hongyu Medical
Notable Milestones in Blood Collection Systems Sector
- 2020: Introduction of a new automated blood collection system by Becton Dickinson.
- 2022: Launch of a safety-engineered needle by Terumo.
- 2023: Acquisition of a smaller blood collection company by Greiner Bio-One. (Further details would be needed for specific dates on these milestones).
In-Depth Blood Collection Systems Market Outlook
The future of the Blood Collection Systems market is bright, driven by continuous technological innovation, increasing demand from emerging markets, and rising healthcare expenditure. Strategic partnerships, focus on safety and efficiency, and expansion into new applications will be crucial for success. The market is poised for significant growth, with a projected market size of xx million units by 2033.
Blood Collection Systems Segmentation
-
1. Application
- 1.1. Venous Blood Collection
- 1.2. Capillary Blood Collection
-
2. Types
- 2.1. Serum Separating Tubes
- 2.2. EDTA Tubes
- 2.3. Plasma Separation Tube
- 2.4. Others
Blood Collection Systems Segmentation By Geography
-
1. North America
- 1.1. United States
- 1.2. Canada
- 1.3. Mexico
-
2. South America
- 2.1. Brazil
- 2.2. Argentina
- 2.3. Rest of South America
-
3. Europe
- 3.1. United Kingdom
- 3.2. Germany
- 3.3. France
- 3.4. Italy
- 3.5. Spain
- 3.6. Russia
- 3.7. Benelux
- 3.8. Nordics
- 3.9. Rest of Europe
-
4. Middle East & Africa
- 4.1. Turkey
- 4.2. Israel
- 4.3. GCC
- 4.4. North Africa
- 4.5. South Africa
- 4.6. Rest of Middle East & Africa
-
5. Asia Pacific
- 5.1. China
- 5.2. India
- 5.3. Japan
- 5.4. South Korea
- 5.5. ASEAN
- 5.6. Oceania
- 5.7. Rest of Asia Pacific
Blood Collection Systems REPORT HIGHLIGHTS
| Aspects | Details |
|---|---|
| Study Period | 2019-2033 |
| Base Year | 2024 |
| Estimated Year | 2025 |
| Forecast Period | 2025-2033 |
| Historical Period | 2019-2024 |
| Growth Rate | CAGR of XX% from 2019-2033 |
| Segmentation |
|
Table of Contents
- 1. Introduction
- 1.1. Research Scope
- 1.2. Market Segmentation
- 1.3. Research Methodology
- 1.4. Definitions and Assumptions
- 2. Executive Summary
- 2.1. Introduction
- 3. Market Dynamics
- 3.1. Introduction
- 3.2. Market Drivers
- 3.3. Market Restrains
- 3.4. Market Trends
- 4. Market Factor Analysis
- 4.1. Porters Five Forces
- 4.2. Supply/Value Chain
- 4.3. PESTEL analysis
- 4.4. Market Entropy
- 4.5. Patent/Trademark Analysis
- 5. Global Blood Collection Systems Analysis, Insights and Forecast, 2019-2031
- 5.1. Market Analysis, Insights and Forecast - by Application
- 5.1.1. Venous Blood Collection
- 5.1.2. Capillary Blood Collection
- 5.2. Market Analysis, Insights and Forecast - by Types
- 5.2.1. Serum Separating Tubes
- 5.2.2. EDTA Tubes
- 5.2.3. Plasma Separation Tube
- 5.2.4. Others
- 5.3. Market Analysis, Insights and Forecast - by Region
- 5.3.1. North America
- 5.3.2. South America
- 5.3.3. Europe
- 5.3.4. Middle East & Africa
- 5.3.5. Asia Pacific
- 5.1. Market Analysis, Insights and Forecast - by Application
- 6. North America Blood Collection Systems Analysis, Insights and Forecast, 2019-2031
- 6.1. Market Analysis, Insights and Forecast - by Application
- 6.1.1. Venous Blood Collection
- 6.1.2. Capillary Blood Collection
- 6.2. Market Analysis, Insights and Forecast - by Types
- 6.2.1. Serum Separating Tubes
- 6.2.2. EDTA Tubes
- 6.2.3. Plasma Separation Tube
- 6.2.4. Others
- 6.1. Market Analysis, Insights and Forecast - by Application
- 7. South America Blood Collection Systems Analysis, Insights and Forecast, 2019-2031
- 7.1. Market Analysis, Insights and Forecast - by Application
- 7.1.1. Venous Blood Collection
- 7.1.2. Capillary Blood Collection
- 7.2. Market Analysis, Insights and Forecast - by Types
- 7.2.1. Serum Separating Tubes
- 7.2.2. EDTA Tubes
- 7.2.3. Plasma Separation Tube
- 7.2.4. Others
- 7.1. Market Analysis, Insights and Forecast - by Application
- 8. Europe Blood Collection Systems Analysis, Insights and Forecast, 2019-2031
- 8.1. Market Analysis, Insights and Forecast - by Application
- 8.1.1. Venous Blood Collection
- 8.1.2. Capillary Blood Collection
- 8.2. Market Analysis, Insights and Forecast - by Types
- 8.2.1. Serum Separating Tubes
- 8.2.2. EDTA Tubes
- 8.2.3. Plasma Separation Tube
- 8.2.4. Others
- 8.1. Market Analysis, Insights and Forecast - by Application
- 9. Middle East & Africa Blood Collection Systems Analysis, Insights and Forecast, 2019-2031
- 9.1. Market Analysis, Insights and Forecast - by Application
- 9.1.1. Venous Blood Collection
- 9.1.2. Capillary Blood Collection
- 9.2. Market Analysis, Insights and Forecast - by Types
- 9.2.1. Serum Separating Tubes
- 9.2.2. EDTA Tubes
- 9.2.3. Plasma Separation Tube
- 9.2.4. Others
- 9.1. Market Analysis, Insights and Forecast - by Application
- 10. Asia Pacific Blood Collection Systems Analysis, Insights and Forecast, 2019-2031
- 10.1. Market Analysis, Insights and Forecast - by Application
- 10.1.1. Venous Blood Collection
- 10.1.2. Capillary Blood Collection
- 10.2. Market Analysis, Insights and Forecast - by Types
- 10.2.1. Serum Separating Tubes
- 10.2.2. EDTA Tubes
- 10.2.3. Plasma Separation Tube
- 10.2.4. Others
- 10.1. Market Analysis, Insights and Forecast - by Application
- 11. Competitive Analysis
- 11.1. Global Market Share Analysis 2024
- 11.2. Company Profiles
- 11.2.1 Becton Dickinson
- 11.2.1.1. Overview
- 11.2.1.2. Products
- 11.2.1.3. SWOT Analysis
- 11.2.1.4. Recent Developments
- 11.2.1.5. Financials (Based on Availability)
- 11.2.2 Terumo
- 11.2.2.1. Overview
- 11.2.2.2. Products
- 11.2.2.3. SWOT Analysis
- 11.2.2.4. Recent Developments
- 11.2.2.5. Financials (Based on Availability)
- 11.2.3 Greiner Bio One
- 11.2.3.1. Overview
- 11.2.3.2. Products
- 11.2.3.3. SWOT Analysis
- 11.2.3.4. Recent Developments
- 11.2.3.5. Financials (Based on Availability)
- 11.2.4 Medtronic
- 11.2.4.1. Overview
- 11.2.4.2. Products
- 11.2.4.3. SWOT Analysis
- 11.2.4.4. Recent Developments
- 11.2.4.5. Financials (Based on Availability)
- 11.2.5 SEKISUI Medical
- 11.2.5.1. Overview
- 11.2.5.2. Products
- 11.2.5.3. SWOT Analysis
- 11.2.5.4. Recent Developments
- 11.2.5.5. Financials (Based on Availability)
- 11.2.6 Sarstedt
- 11.2.6.1. Overview
- 11.2.6.2. Products
- 11.2.6.3. SWOT Analysis
- 11.2.6.4. Recent Developments
- 11.2.6.5. Financials (Based on Availability)
- 11.2.7 Narang Medical
- 11.2.7.1. Overview
- 11.2.7.2. Products
- 11.2.7.3. SWOT Analysis
- 11.2.7.4. Recent Developments
- 11.2.7.5. Financials (Based on Availability)
- 11.2.8 F.L. Medical
- 11.2.8.1. Overview
- 11.2.8.2. Products
- 11.2.8.3. SWOT Analysis
- 11.2.8.4. Recent Developments
- 11.2.8.5. Financials (Based on Availability)
- 11.2.9 Improve-medical
- 11.2.9.1. Overview
- 11.2.9.2. Products
- 11.2.9.3. SWOT Analysis
- 11.2.9.4. Recent Developments
- 11.2.9.5. Financials (Based on Availability)
- 11.2.10 Hongyu Medical
- 11.2.10.1. Overview
- 11.2.10.2. Products
- 11.2.10.3. SWOT Analysis
- 11.2.10.4. Recent Developments
- 11.2.10.5. Financials (Based on Availability)
- 11.2.1 Becton Dickinson
List of Figures
- Figure 1: Global Blood Collection Systems Revenue Breakdown (million, %) by Region 2024 & 2032
- Figure 2: Global Blood Collection Systems Volume Breakdown (K, %) by Region 2024 & 2032
- Figure 3: North America Blood Collection Systems Revenue (million), by Application 2024 & 2032
- Figure 4: North America Blood Collection Systems Volume (K), by Application 2024 & 2032
- Figure 5: North America Blood Collection Systems Revenue Share (%), by Application 2024 & 2032
- Figure 6: North America Blood Collection Systems Volume Share (%), by Application 2024 & 2032
- Figure 7: North America Blood Collection Systems Revenue (million), by Types 2024 & 2032
- Figure 8: North America Blood Collection Systems Volume (K), by Types 2024 & 2032
- Figure 9: North America Blood Collection Systems Revenue Share (%), by Types 2024 & 2032
- Figure 10: North America Blood Collection Systems Volume Share (%), by Types 2024 & 2032
- Figure 11: North America Blood Collection Systems Revenue (million), by Country 2024 & 2032
- Figure 12: North America Blood Collection Systems Volume (K), by Country 2024 & 2032
- Figure 13: North America Blood Collection Systems Revenue Share (%), by Country 2024 & 2032
- Figure 14: North America Blood Collection Systems Volume Share (%), by Country 2024 & 2032
- Figure 15: South America Blood Collection Systems Revenue (million), by Application 2024 & 2032
- Figure 16: South America Blood Collection Systems Volume (K), by Application 2024 & 2032
- Figure 17: South America Blood Collection Systems Revenue Share (%), by Application 2024 & 2032
- Figure 18: South America Blood Collection Systems Volume Share (%), by Application 2024 & 2032
- Figure 19: South America Blood Collection Systems Revenue (million), by Types 2024 & 2032
- Figure 20: South America Blood Collection Systems Volume (K), by Types 2024 & 2032
- Figure 21: South America Blood Collection Systems Revenue Share (%), by Types 2024 & 2032
- Figure 22: South America Blood Collection Systems Volume Share (%), by Types 2024 & 2032
- Figure 23: South America Blood Collection Systems Revenue (million), by Country 2024 & 2032
- Figure 24: South America Blood Collection Systems Volume (K), by Country 2024 & 2032
- Figure 25: South America Blood Collection Systems Revenue Share (%), by Country 2024 & 2032
- Figure 26: South America Blood Collection Systems Volume Share (%), by Country 2024 & 2032
- Figure 27: Europe Blood Collection Systems Revenue (million), by Application 2024 & 2032
- Figure 28: Europe Blood Collection Systems Volume (K), by Application 2024 & 2032
- Figure 29: Europe Blood Collection Systems Revenue Share (%), by Application 2024 & 2032
- Figure 30: Europe Blood Collection Systems Volume Share (%), by Application 2024 & 2032
- Figure 31: Europe Blood Collection Systems Revenue (million), by Types 2024 & 2032
- Figure 32: Europe Blood Collection Systems Volume (K), by Types 2024 & 2032
- Figure 33: Europe Blood Collection Systems Revenue Share (%), by Types 2024 & 2032
- Figure 34: Europe Blood Collection Systems Volume Share (%), by Types 2024 & 2032
- Figure 35: Europe Blood Collection Systems Revenue (million), by Country 2024 & 2032
- Figure 36: Europe Blood Collection Systems Volume (K), by Country 2024 & 2032
- Figure 37: Europe Blood Collection Systems Revenue Share (%), by Country 2024 & 2032
- Figure 38: Europe Blood Collection Systems Volume Share (%), by Country 2024 & 2032
- Figure 39: Middle East & Africa Blood Collection Systems Revenue (million), by Application 2024 & 2032
- Figure 40: Middle East & Africa Blood Collection Systems Volume (K), by Application 2024 & 2032
- Figure 41: Middle East & Africa Blood Collection Systems Revenue Share (%), by Application 2024 & 2032
- Figure 42: Middle East & Africa Blood Collection Systems Volume Share (%), by Application 2024 & 2032
- Figure 43: Middle East & Africa Blood Collection Systems Revenue (million), by Types 2024 & 2032
- Figure 44: Middle East & Africa Blood Collection Systems Volume (K), by Types 2024 & 2032
- Figure 45: Middle East & Africa Blood Collection Systems Revenue Share (%), by Types 2024 & 2032
- Figure 46: Middle East & Africa Blood Collection Systems Volume Share (%), by Types 2024 & 2032
- Figure 47: Middle East & Africa Blood Collection Systems Revenue (million), by Country 2024 & 2032
- Figure 48: Middle East & Africa Blood Collection Systems Volume (K), by Country 2024 & 2032
- Figure 49: Middle East & Africa Blood Collection Systems Revenue Share (%), by Country 2024 & 2032
- Figure 50: Middle East & Africa Blood Collection Systems Volume Share (%), by Country 2024 & 2032
- Figure 51: Asia Pacific Blood Collection Systems Revenue (million), by Application 2024 & 2032
- Figure 52: Asia Pacific Blood Collection Systems Volume (K), by Application 2024 & 2032
- Figure 53: Asia Pacific Blood Collection Systems Revenue Share (%), by Application 2024 & 2032
- Figure 54: Asia Pacific Blood Collection Systems Volume Share (%), by Application 2024 & 2032
- Figure 55: Asia Pacific Blood Collection Systems Revenue (million), by Types 2024 & 2032
- Figure 56: Asia Pacific Blood Collection Systems Volume (K), by Types 2024 & 2032
- Figure 57: Asia Pacific Blood Collection Systems Revenue Share (%), by Types 2024 & 2032
- Figure 58: Asia Pacific Blood Collection Systems Volume Share (%), by Types 2024 & 2032
- Figure 59: Asia Pacific Blood Collection Systems Revenue (million), by Country 2024 & 2032
- Figure 60: Asia Pacific Blood Collection Systems Volume (K), by Country 2024 & 2032
- Figure 61: Asia Pacific Blood Collection Systems Revenue Share (%), by Country 2024 & 2032
- Figure 62: Asia Pacific Blood Collection Systems Volume Share (%), by Country 2024 & 2032
List of Tables
- Table 1: Global Blood Collection Systems Revenue million Forecast, by Region 2019 & 2032
- Table 2: Global Blood Collection Systems Volume K Forecast, by Region 2019 & 2032
- Table 3: Global Blood Collection Systems Revenue million Forecast, by Application 2019 & 2032
- Table 4: Global Blood Collection Systems Volume K Forecast, by Application 2019 & 2032
- Table 5: Global Blood Collection Systems Revenue million Forecast, by Types 2019 & 2032
- Table 6: Global Blood Collection Systems Volume K Forecast, by Types 2019 & 2032
- Table 7: Global Blood Collection Systems Revenue million Forecast, by Region 2019 & 2032
- Table 8: Global Blood Collection Systems Volume K Forecast, by Region 2019 & 2032
- Table 9: Global Blood Collection Systems Revenue million Forecast, by Application 2019 & 2032
- Table 10: Global Blood Collection Systems Volume K Forecast, by Application 2019 & 2032
- Table 11: Global Blood Collection Systems Revenue million Forecast, by Types 2019 & 2032
- Table 12: Global Blood Collection Systems Volume K Forecast, by Types 2019 & 2032
- Table 13: Global Blood Collection Systems Revenue million Forecast, by Country 2019 & 2032
- Table 14: Global Blood Collection Systems Volume K Forecast, by Country 2019 & 2032
- Table 15: United States Blood Collection Systems Revenue (million) Forecast, by Application 2019 & 2032
- Table 16: United States Blood Collection Systems Volume (K) Forecast, by Application 2019 & 2032
- Table 17: Canada Blood Collection Systems Revenue (million) Forecast, by Application 2019 & 2032
- Table 18: Canada Blood Collection Systems Volume (K) Forecast, by Application 2019 & 2032
- Table 19: Mexico Blood Collection Systems Revenue (million) Forecast, by Application 2019 & 2032
- Table 20: Mexico Blood Collection Systems Volume (K) Forecast, by Application 2019 & 2032
- Table 21: Global Blood Collection Systems Revenue million Forecast, by Application 2019 & 2032
- Table 22: Global Blood Collection Systems Volume K Forecast, by Application 2019 & 2032
- Table 23: Global Blood Collection Systems Revenue million Forecast, by Types 2019 & 2032
- Table 24: Global Blood Collection Systems Volume K Forecast, by Types 2019 & 2032
- Table 25: Global Blood Collection Systems Revenue million Forecast, by Country 2019 & 2032
- Table 26: Global Blood Collection Systems Volume K Forecast, by Country 2019 & 2032
- Table 27: Brazil Blood Collection Systems Revenue (million) Forecast, by Application 2019 & 2032
- Table 28: Brazil Blood Collection Systems Volume (K) Forecast, by Application 2019 & 2032
- Table 29: Argentina Blood Collection Systems Revenue (million) Forecast, by Application 2019 & 2032
- Table 30: Argentina Blood Collection Systems Volume (K) Forecast, by Application 2019 & 2032
- Table 31: Rest of South America Blood Collection Systems Revenue (million) Forecast, by Application 2019 & 2032
- Table 32: Rest of South America Blood Collection Systems Volume (K) Forecast, by Application 2019 & 2032
- Table 33: Global Blood Collection Systems Revenue million Forecast, by Application 2019 & 2032
- Table 34: Global Blood Collection Systems Volume K Forecast, by Application 2019 & 2032
- Table 35: Global Blood Collection Systems Revenue million Forecast, by Types 2019 & 2032
- Table 36: Global Blood Collection Systems Volume K Forecast, by Types 2019 & 2032
- Table 37: Global Blood Collection Systems Revenue million Forecast, by Country 2019 & 2032
- Table 38: Global Blood Collection Systems Volume K Forecast, by Country 2019 & 2032
- Table 39: United Kingdom Blood Collection Systems Revenue (million) Forecast, by Application 2019 & 2032
- Table 40: United Kingdom Blood Collection Systems Volume (K) Forecast, by Application 2019 & 2032
- Table 41: Germany Blood Collection Systems Revenue (million) Forecast, by Application 2019 & 2032
- Table 42: Germany Blood Collection Systems Volume (K) Forecast, by Application 2019 & 2032
- Table 43: France Blood Collection Systems Revenue (million) Forecast, by Application 2019 & 2032
- Table 44: France Blood Collection Systems Volume (K) Forecast, by Application 2019 & 2032
- Table 45: Italy Blood Collection Systems Revenue (million) Forecast, by Application 2019 & 2032
- Table 46: Italy Blood Collection Systems Volume (K) Forecast, by Application 2019 & 2032
- Table 47: Spain Blood Collection Systems Revenue (million) Forecast, by Application 2019 & 2032
- Table 48: Spain Blood Collection Systems Volume (K) Forecast, by Application 2019 & 2032
- Table 49: Russia Blood Collection Systems Revenue (million) Forecast, by Application 2019 & 2032
- Table 50: Russia Blood Collection Systems Volume (K) Forecast, by Application 2019 & 2032
- Table 51: Benelux Blood Collection Systems Revenue (million) Forecast, by Application 2019 & 2032
- Table 52: Benelux Blood Collection Systems Volume (K) Forecast, by Application 2019 & 2032
- Table 53: Nordics Blood Collection Systems Revenue (million) Forecast, by Application 2019 & 2032
- Table 54: Nordics Blood Collection Systems Volume (K) Forecast, by Application 2019 & 2032
- Table 55: Rest of Europe Blood Collection Systems Revenue (million) Forecast, by Application 2019 & 2032
- Table 56: Rest of Europe Blood Collection Systems Volume (K) Forecast, by Application 2019 & 2032
- Table 57: Global Blood Collection Systems Revenue million Forecast, by Application 2019 & 2032
- Table 58: Global Blood Collection Systems Volume K Forecast, by Application 2019 & 2032
- Table 59: Global Blood Collection Systems Revenue million Forecast, by Types 2019 & 2032
- Table 60: Global Blood Collection Systems Volume K Forecast, by Types 2019 & 2032
- Table 61: Global Blood Collection Systems Revenue million Forecast, by Country 2019 & 2032
- Table 62: Global Blood Collection Systems Volume K Forecast, by Country 2019 & 2032
- Table 63: Turkey Blood Collection Systems Revenue (million) Forecast, by Application 2019 & 2032
- Table 64: Turkey Blood Collection Systems Volume (K) Forecast, by Application 2019 & 2032
- Table 65: Israel Blood Collection Systems Revenue (million) Forecast, by Application 2019 & 2032
- Table 66: Israel Blood Collection Systems Volume (K) Forecast, by Application 2019 & 2032
- Table 67: GCC Blood Collection Systems Revenue (million) Forecast, by Application 2019 & 2032
- Table 68: GCC Blood Collection Systems Volume (K) Forecast, by Application 2019 & 2032
- Table 69: North Africa Blood Collection Systems Revenue (million) Forecast, by Application 2019 & 2032
- Table 70: North Africa Blood Collection Systems Volume (K) Forecast, by Application 2019 & 2032
- Table 71: South Africa Blood Collection Systems Revenue (million) Forecast, by Application 2019 & 2032
- Table 72: South Africa Blood Collection Systems Volume (K) Forecast, by Application 2019 & 2032
- Table 73: Rest of Middle East & Africa Blood Collection Systems Revenue (million) Forecast, by Application 2019 & 2032
- Table 74: Rest of Middle East & Africa Blood Collection Systems Volume (K) Forecast, by Application 2019 & 2032
- Table 75: Global Blood Collection Systems Revenue million Forecast, by Application 2019 & 2032
- Table 76: Global Blood Collection Systems Volume K Forecast, by Application 2019 & 2032
- Table 77: Global Blood Collection Systems Revenue million Forecast, by Types 2019 & 2032
- Table 78: Global Blood Collection Systems Volume K Forecast, by Types 2019 & 2032
- Table 79: Global Blood Collection Systems Revenue million Forecast, by Country 2019 & 2032
- Table 80: Global Blood Collection Systems Volume K Forecast, by Country 2019 & 2032
- Table 81: China Blood Collection Systems Revenue (million) Forecast, by Application 2019 & 2032
- Table 82: China Blood Collection Systems Volume (K) Forecast, by Application 2019 & 2032
- Table 83: India Blood Collection Systems Revenue (million) Forecast, by Application 2019 & 2032
- Table 84: India Blood Collection Systems Volume (K) Forecast, by Application 2019 & 2032
- Table 85: Japan Blood Collection Systems Revenue (million) Forecast, by Application 2019 & 2032
- Table 86: Japan Blood Collection Systems Volume (K) Forecast, by Application 2019 & 2032
- Table 87: South Korea Blood Collection Systems Revenue (million) Forecast, by Application 2019 & 2032
- Table 88: South Korea Blood Collection Systems Volume (K) Forecast, by Application 2019 & 2032
- Table 89: ASEAN Blood Collection Systems Revenue (million) Forecast, by Application 2019 & 2032
- Table 90: ASEAN Blood Collection Systems Volume (K) Forecast, by Application 2019 & 2032
- Table 91: Oceania Blood Collection Systems Revenue (million) Forecast, by Application 2019 & 2032
- Table 92: Oceania Blood Collection Systems Volume (K) Forecast, by Application 2019 & 2032
- Table 93: Rest of Asia Pacific Blood Collection Systems Revenue (million) Forecast, by Application 2019 & 2032
- Table 94: Rest of Asia Pacific Blood Collection Systems Volume (K) Forecast, by Application 2019 & 2032
Frequently Asked Questions
1. What is the projected Compound Annual Growth Rate (CAGR) of the Blood Collection Systems?
The projected CAGR is approximately XX%.
2. Which companies are prominent players in the Blood Collection Systems?
Key companies in the market include Becton Dickinson, Terumo, Greiner Bio One, Medtronic, SEKISUI Medical, Sarstedt, Narang Medical, F.L. Medical, Improve-medical, Hongyu Medical.
3. What are the main segments of the Blood Collection Systems?
The market segments include Application, Types.
4. Can you provide details about the market size?
The market size is estimated to be USD XXX million as of 2022.
5. What are some drivers contributing to market growth?
N/A
6. What are the notable trends driving market growth?
N/A
7. Are there any restraints impacting market growth?
N/A
8. Can you provide examples of recent developments in the market?
N/A
9. What pricing options are available for accessing the report?
Pricing options include single-user, multi-user, and enterprise licenses priced at USD 3350.00, USD 5025.00, and USD 6700.00 respectively.
10. Is the market size provided in terms of value or volume?
The market size is provided in terms of value, measured in million and volume, measured in K.
11. Are there any specific market keywords associated with the report?
Yes, the market keyword associated with the report is "Blood Collection Systems," which aids in identifying and referencing the specific market segment covered.
12. How do I determine which pricing option suits my needs best?
The pricing options vary based on user requirements and access needs. Individual users may opt for single-user licenses, while businesses requiring broader access may choose multi-user or enterprise licenses for cost-effective access to the report.
13. Are there any additional resources or data provided in the Blood Collection Systems report?
While the report offers comprehensive insights, it's advisable to review the specific contents or supplementary materials provided to ascertain if additional resources or data are available.
14. How can I stay updated on further developments or reports in the Blood Collection Systems?
To stay informed about further developments, trends, and reports in the Blood Collection Systems, consider subscribing to industry newsletters, following relevant companies and organizations, or regularly checking reputable industry news sources and publications.
Methodology
Step 1 - Identification of Relevant Samples Size from Population Database


Step 2 - Approaches for Defining Global Market Size (Value, Volume* & Price*)

Note*: In applicable scenarios
Step 3 - Data Sources
Primary Research
- Web Analytics
- Survey Reports
- Research Institute
- Latest Research Reports
- Opinion Leaders
Secondary Research
- Annual Reports
- White Paper
- Latest Press Release
- Industry Association
- Paid Database
- Investor Presentations

Step 4 - Data Triangulation
Involves using different sources of information in order to increase the validity of a study
These sources are likely to be stakeholders in a program - participants, other researchers, program staff, other community members, and so on.
Then we put all data in single framework & apply various statistical tools to find out the dynamic on the market.
During the analysis stage, feedback from the stakeholder groups would be compared to determine areas of agreement as well as areas of divergence


