
Key Insights
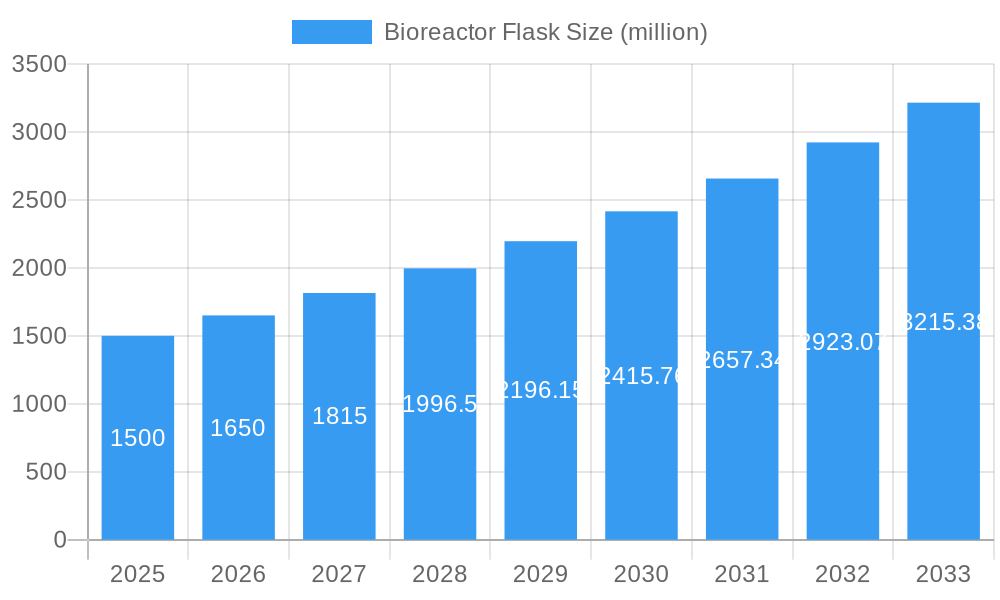
The global bioreactor flask market is projected for substantial growth, expected to reach $6.18 billion by 2025, with a Compound Annual Growth Rate (CAGR) of 9.45% through 2033. This expansion is driven by the increasing demand for cell culture-based therapeutics, such as monoclonal antibodies, vaccines, and gene therapies, within the pharmaceutical and biotechnology industries. Significant investments in R&D for novel drug discovery and personalized medicine further accelerate market growth. The rising adoption of single-use bioreactor systems, valued for their reduced contamination risk, expedited turnaround times, and lower capital expenditure, is a key growth enabler. Academic and research institutions also contribute significantly through the extensive use of bioreactor flasks in fundamental biological research and process development.
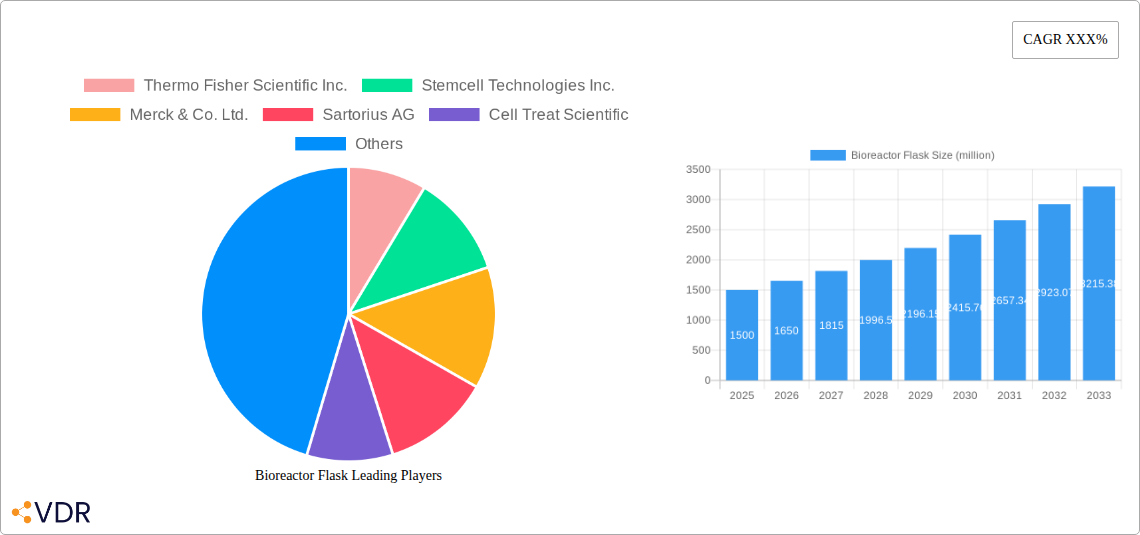
Bioreactor Flask Market Size (In Billion)

The market features a variety of bioreactor flask capacities, with 50 ml and 350 ml sizes being particularly popular for initial research, screening, and early-stage process development. However, demand for larger volumes, including 600 ml and 1000 ml, is steadily increasing as biomanufacturing processes scale up. Potential restraints include the high cost of advanced bioreactor systems and the availability of alternative cell culture technologies like microfluidics. Despite these challenges, continuous technological advancements, such as the integration of automation and sensor technologies for real-time monitoring and control, are expected to mitigate these limitations and unlock further growth avenues. Geographically, North America and Europe are anticipated to lead the market, supported by a strong presence of major pharmaceutical and biotechnology firms and substantial R&D investments. The Asia Pacific region, particularly China and India, is poised for the most rapid growth, driven by expanding biopharmaceutical manufacturing capabilities and increasing government support for biotechnology research.
Bioreactor Flask Company Market Share
Bioreactor Flask Market Dynamics & Structure
The global bioreactor flask market is characterized by a moderately concentrated structure, with key players like Thermo Fisher Scientific Inc., Stemcell Technologies Inc., Merck & Co. Ltd., Sartorius AG, Cell Treat Scientific, Greiner Bio-One, SorfaLifeScience, Crystalgen, Corning, WK Life Sciences Ltd., and Himedia Laboratories holding significant market share. Technological innovation is a primary driver, fueled by advancements in cell culture media, single-use bioreactor technologies, and automated cell processing. The market is shaped by stringent regulatory frameworks, particularly concerning the production of biopharmaceuticals and cell-based therapies, impacting product design and validation processes. Competitive product substitutes include traditional stirred tank bioreactors and microfluidic devices, offering alternative solutions for specific cell culture needs. End-user demographics span Pharmaceutical & Biotechnology Companies and Research and Academics, with a growing "Others" segment encompassing contract manufacturing organizations and specialized research labs. Mergers and acquisitions (M&A) trends indicate strategic consolidation to expand product portfolios and geographical reach, with approximately 5 major M&A deals observed in the historical period (2019-2024), valued at over $300 million. Barriers to innovation include the high cost of R&D, the need for extensive validation, and the complex regulatory approval pathways for novel bioreactor flask designs.
- Market Concentration: Moderately concentrated.
- Key Innovators: Thermo Fisher Scientific Inc., Stemcell Technologies Inc., Sartorius AG.
- Regulatory Influence: High, particularly for biopharmaceutical production.
- Competitive Landscape: Traditional stirred tank bioreactors, microfluidic devices.
- End-User Dominance: Pharmaceutical & Biotechnology Companies, Research and Academics.
- M&A Activity: Approximately 5 deals annually in the historical period, valued over $300 million.
- Innovation Barriers: High R&D costs, validation complexities, regulatory hurdles.
Bioreactor Flask Growth Trends & Insights
The global bioreactor flask market is poised for robust growth, projected to expand significantly from an estimated $2,500 million in the base year of 2025. This growth is underpinned by a confluence of factors, including escalating demand for biologics, an increasing prevalence of chronic diseases necessitating advanced therapeutic development, and a burgeoning research landscape focused on cell and gene therapies. The adoption rates of advanced bioreactor flask technologies, particularly those offering improved cell growth kinetics, enhanced scalability, and integrated monitoring capabilities, are steadily rising across both academic research institutions and industrial pharmaceutical settings. Technological disruptions are playing a pivotal role, with the emergence of novel materials, disposable technologies that minimize contamination risks and cleaning validation efforts, and smart sensor integrations for real-time process monitoring significantly reshaping the market. Consumer behavior shifts are evident, with a growing preference for user-friendly, high-throughput, and cost-effective solutions that accelerate drug discovery and development timelines.
The market size evolution is projected to witness a Compound Annual Growth Rate (CAGR) of approximately 9.5% during the forecast period of 2025–2033, reflecting sustained demand and continuous innovation. Market penetration is deepening, with smaller research labs and contract research organizations (CROs) increasingly adopting bioreactor flask solutions to streamline their experimental workflows and enhance reproducibility. Technological advancements are not only improving the efficiency of cell culture but also enabling the exploration of novel cell types and more complex biological systems, thereby expanding the potential applications of bioreactor flasks. The COVID-19 pandemic, while initially posing supply chain challenges, also accelerated the adoption of single-use technologies, including bioreactor flasks, due to their inherent flexibility and reduced need for sterilization infrastructure, contributing to their increased market penetration. Furthermore, the growing investment in personalized medicine and regenerative therapies directly translates into higher demand for specialized bioreactor flasks capable of handling sensitive cell lines and precise culture conditions. The anticipated market size is expected to reach over $5,000 million by the end of the forecast period.
- Projected Market Size (2025): $2,500 million.
- Projected CAGR (2025-2033): 9.5%.
- Key Growth Drivers: Demand for biologics, chronic disease prevalence, cell/gene therapy research.
- Technological Disruptions: Single-use technologies, advanced materials, integrated sensors.
- Consumer Behavior Shifts: Preference for user-friendly, high-throughput, cost-effective solutions.
- Market Penetration: Increasing in smaller research labs and CROs.
- Impact of COVID-19: Accelerated adoption of single-use technologies.
- Future Market Size (End of Forecast): Over $5,000 million.
Dominant Regions, Countries, or Segments in Bioreactor Flask
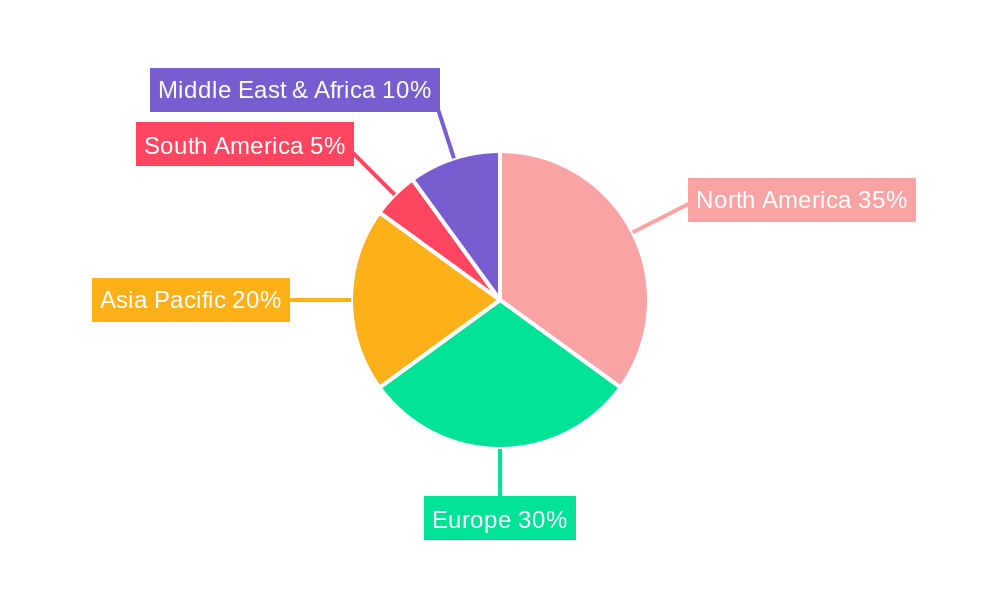
North America is emerging as the dominant region in the global bioreactor flask market, driven by its robust pharmaceutical and biotechnology industry, extensive research and academic infrastructure, and significant government funding for life sciences research. The United States, in particular, accounts for a substantial portion of this regional dominance due to the presence of leading biopharmaceutical companies, a strong network of universities and research institutions, and supportive regulatory environments that encourage innovation in drug discovery and development. Key drivers contributing to North America's leadership include substantial investments in biologics manufacturing, a growing pipeline of cell and gene therapies, and the increasing adoption of advanced biotechnologies.
Within the Application segment, Pharmaceutical & Biotechnology Companies represent the largest and fastest-growing segment, driven by the continuous need for efficient and scalable cell culture solutions in drug development, vaccine production, and biopharmaceutical manufacturing. The segment's growth is further propelled by increased research activities in areas like monoclonal antibodies, recombinant proteins, and personalized medicine. The Research and Academics segment also plays a crucial role, with universities and research centers utilizing bioreactor flasks for fundamental research, disease modeling, and exploring novel therapeutic avenues. The "Others" segment, encompassing contract manufacturing organizations (CMOs) and specialized research facilities, is also witnessing steady growth as outsourcing of biomanufacturing and specialized research services increases.
In terms of Type, the market exhibits strong demand across various capacities. The 350ml and 600 ml bioreactor flasks are particularly popular for mid-scale research and early-stage development due to their versatility and scalability. The 1000ml segment is gaining traction with the expansion of bioprocessing capabilities and the growing need for pilot-scale production. The 50 ml segment remains vital for high-throughput screening and initial cell line characterization. The "Others" category, which may include specialized custom-designed flasks or larger scale, is also contributing to market diversification. Factors like economic policies favorable to biotech research, investments in advanced laboratory infrastructure, and the presence of skilled scientific talent further solidify North America's leading position. The market share of North America is estimated at over 40% in the base year of 2025.
- Dominant Region: North America.
- Leading Country: United States.
- Key Drivers in North America: Robust pharma/biotech industry, strong research infrastructure, government funding.
- Dominant Application Segment: Pharmaceutical & Biotechnology Companies.
- Growing Application Segment: Research and Academics.
- Popular Bioreactor Flask Types: 350ml, 600 ml.
- Increasingly Relevant Type: 1000ml.
- North America Market Share (2025): Over 40%.
Bioreactor Flask Product Landscape
The bioreactor flask product landscape is characterized by continuous innovation focused on enhancing cell growth, improving process control, and ensuring aseptic handling. Key product innovations include the development of flasks with advanced surface treatments that promote cell adhesion and proliferation, integrated sampling ports for ease of use, and optically clear materials for real-time microscopic monitoring. Performance metrics are consistently being improved, with new designs offering higher viable cell densities and greater volumetric productivity compared to conventional static flasks. Applications span a wide range, from routine cell culture for research to the expansion of mammalian cells for biopharmaceutical production and the cultivation of stem cells for regenerative medicine. Unique selling propositions often revolve around ease of use, scalability from benchtop to pilot scale, and compatibility with automated systems. Technological advancements are also geared towards reducing the cost of cell culture while maintaining high product quality and yield.
Key Drivers, Barriers & Challenges in Bioreactor Flask
Key Drivers:
- Rising Demand for Biologics: The burgeoning biopharmaceutical sector, with a focus on monoclonal antibodies, recombinant proteins, and vaccines, drives the need for efficient cell culture solutions.
- Advancements in Cell and Gene Therapies: The rapid progress in these cutting-edge therapeutic areas necessitates sophisticated bioreactor flasks for cell expansion and manipulation.
- Technological Innovations: Development of single-use technologies, improved surface treatments, and integrated sensors enhances cell culture performance and process control.
- Government Funding and Initiatives: Increased investment in life sciences research and development globally fuels demand for advanced laboratory equipment.
- Outsourcing Trends: The growth of contract manufacturing organizations (CMOs) and contract research organizations (CROs) expands the customer base for bioreactor flasks.
Barriers & Challenges:
- High Cost of Advanced Technologies: Innovative bioreactor flasks with integrated features can have a higher upfront cost, posing a barrier for smaller research labs.
- Regulatory Compliance: Meeting stringent regulatory requirements for biopharmaceutical production, including validation and quality control, can be time-consuming and expensive.
- Scalability Concerns: While many bioreactor flasks are designed for scalability, transitioning from small-scale research to large-scale manufacturing can still present challenges.
- Competition from Traditional Methods: While single-use technologies are gaining traction, traditional reusable bioreactors and culture plates still hold a significant market share in certain applications.
- Supply Chain Volatility: Global events can impact the availability of raw materials and components, leading to potential supply chain disruptions. The impact of such disruptions can lead to delays in production, estimated at 5-10% for critical components in the historical period.
Emerging Opportunities in Bioreactor Flask
Emerging opportunities in the bioreactor flask market lie in the development of highly specialized flasks for niche applications, such as the culture of 3D cell spheroids or organoids for drug testing and regenerative medicine. The integration of advanced analytics and artificial intelligence (AI) with bioreactor flask systems to optimize cell culture conditions and predict outcomes presents a significant growth avenue. Furthermore, the expansion of bioreactor flask usage in emerging economies with growing biopharmaceutical sectors and increasing healthcare expenditure offers untapped market potential. The development of novel, sustainable materials for disposable bioreactor flasks also aligns with growing environmental consciousness and could create a competitive advantage. The market penetration in personalized medicine, where patient-specific cell therapies require tailored culture environments, is another key opportunity.
Growth Accelerators in the Bioreactor Flask Industry
Catalysts driving long-term growth in the bioreactor flask industry are multifaceted. Technological breakthroughs, such as the development of fully automated, closed-system bioreactor flasks with integrated real-time process analytics, are significant growth accelerators. Strategic partnerships between bioreactor flask manufacturers and biopharmaceutical companies or academic institutions can lead to co-development of tailored solutions and expanded market access. Market expansion strategies, including entry into underdeveloped geographical regions and the development of lower-cost, high-performance alternatives, are crucial for sustained growth. The increasing emphasis on process intensification and continuous manufacturing in bioprocessing also favors the adoption of advanced bioreactor flask technologies that support these methodologies.
Key Players Shaping the Bioreactor Flask Market
- Thermo Fisher Scientific Inc.
- Stemcell Technologies Inc.
- Merck & Co. Ltd.
- Sartorius AG
- Cell Treat Scientific
- Greiner Bio-One
- SorfaLifeScience
- Crystalgen
- Corning
- WK Life Sciences Ltd.
- Himedia Laboratories
Notable Milestones in Bioreactor Flask Sector
- 2019: Launch of advanced surface-treated bioreactor flasks by Corning, enhancing cell attachment and growth.
- 2020: Thermo Fisher Scientific Inc. expands its single-use bioreactor portfolio, including innovative flask designs.
- 2021: Stemcell Technologies Inc. introduces new bioreactor flasks optimized for stem cell expansion.
- 2022: Sartorius AG acquires a company specializing in advanced cell culture technologies, strengthening its bioreactor flask offerings.
- 2023: Greiner Bio-One launches new bioreactor flasks with improved optical clarity for enhanced microscopic observation.
- 2024: Merck & Co. Ltd. announces partnerships for the development of novel cell therapy manufacturing platforms, including specialized bioreactor flasks.
In-Depth Bioreactor Flask Market Outlook
The future of the bioreactor flask market is exceptionally promising, driven by ongoing technological advancements and the escalating global demand for advanced biotherapeutics. Growth accelerators such as the increasing adoption of single-use technologies, the expansion of cell and gene therapy applications, and the ongoing innovation in flask design are expected to sustain the robust growth trajectory. Strategic opportunities include further penetration into emerging markets, the development of smart, integrated bioreactor flask systems with predictive analytics, and the exploration of novel materials for enhanced sustainability. The market is well-positioned for significant expansion, with a clear path towards greater automation, efficiency, and precision in cell culture processes.
Bioreactor Flask Segmentation
-
1. Application
- 1.1. Pharmaceutical & Biotechnology Companies
- 1.2. Research and Academics
- 1.3. Others
-
2. Type
- 2.1. 50 ml
- 2.2. 350ml
- 2.3. 600 ml
- 2.4. 1000ml
- 2.5. Others
Bioreactor Flask Segmentation By Geography
-
1. North America
- 1.1. United States
- 1.2. Canada
- 1.3. Mexico
-
2. South America
- 2.1. Brazil
- 2.2. Argentina
- 2.3. Rest of South America
-
3. Europe
- 3.1. United Kingdom
- 3.2. Germany
- 3.3. France
- 3.4. Italy
- 3.5. Spain
- 3.6. Russia
- 3.7. Benelux
- 3.8. Nordics
- 3.9. Rest of Europe
-
4. Middle East & Africa
- 4.1. Turkey
- 4.2. Israel
- 4.3. GCC
- 4.4. North Africa
- 4.5. South Africa
- 4.6. Rest of Middle East & Africa
-
5. Asia Pacific
- 5.1. China
- 5.2. India
- 5.3. Japan
- 5.4. South Korea
- 5.5. ASEAN
- 5.6. Oceania
- 5.7. Rest of Asia Pacific
Bioreactor Flask Regional Market Share
Geographic Coverage of Bioreactor Flask
Bioreactor Flask REPORT HIGHLIGHTS
| Aspects | Details |
|---|---|
| Study Period | 2020-2034 |
| Base Year | 2025 |
| Estimated Year | 2026 |
| Forecast Period | 2026-2034 |
| Historical Period | 2020-2025 |
| Growth Rate | CAGR of 9.45% from 2020-2034 |
| Segmentation |
|
Table of Contents
- 1. Introduction
- 1.1. Research Scope
- 1.2. Market Segmentation
- 1.3. Research Objective
- 1.4. Definitions and Assumptions
- 2. Executive Summary
- 2.1. Market Snapshot
- 3. Market Dynamics
- 3.1. Market Drivers
- 3.2. Market Restrains
- 3.3. Market Trends
- 3.4. Market Opportunities
- 4. Market Factor Analysis
- 4.1. Porters Five Forces
- 4.1.1. Bargaining Power of Suppliers
- 4.1.2. Bargaining Power of Buyers
- 4.1.3. Threat of New Entrants
- 4.1.4. Threat of Substitutes
- 4.1.5. Competitive Rivalry
- 4.2. PESTEL analysis
- 4.3. BCG Analysis
- 4.3.1. Stars (High Growth, High Market Share)
- 4.3.2. Cash Cows (Low Growth, High Market Share)
- 4.3.3. Question Mark (High Growth, Low Market Share)
- 4.3.4. Dogs (Low Growth, Low Market Share)
- 4.4. Ansoff Matrix Analysis
- 4.5. Supply Chain Analysis
- 4.6. Regulatory Landscape
- 4.7. Current Market Potential and Opportunity Assessment (TAM–SAM–SOM Framework)
- 4.8. VDR Analyst Note
- 4.1. Porters Five Forces
- 5. Market Analysis, Insights and Forecast 2021-2033
- 5.1. Market Analysis, Insights and Forecast - by Application
- 5.1.1. Pharmaceutical & Biotechnology Companies
- 5.1.2. Research and Academics
- 5.1.3. Others
- 5.2. Market Analysis, Insights and Forecast - by Type
- 5.2.1. 50 ml
- 5.2.2. 350ml
- 5.2.3. 600 ml
- 5.2.4. 1000ml
- 5.2.5. Others
- 5.3. Market Analysis, Insights and Forecast - by Region
- 5.3.1. North America
- 5.3.2. South America
- 5.3.3. Europe
- 5.3.4. Middle East & Africa
- 5.3.5. Asia Pacific
- 5.1. Market Analysis, Insights and Forecast - by Application
- 6. Global Bioreactor Flask Analysis, Insights and Forecast, 2021-2033
- 6.1. Market Analysis, Insights and Forecast - by Application
- 6.1.1. Pharmaceutical & Biotechnology Companies
- 6.1.2. Research and Academics
- 6.1.3. Others
- 6.2. Market Analysis, Insights and Forecast - by Type
- 6.2.1. 50 ml
- 6.2.2. 350ml
- 6.2.3. 600 ml
- 6.2.4. 1000ml
- 6.2.5. Others
- 6.1. Market Analysis, Insights and Forecast - by Application
- 7. North America Bioreactor Flask Analysis, Insights and Forecast, 2021-2033
- 7.1. Market Analysis, Insights and Forecast - by Application
- 7.1.1. Pharmaceutical & Biotechnology Companies
- 7.1.2. Research and Academics
- 7.1.3. Others
- 7.2. Market Analysis, Insights and Forecast - by Type
- 7.2.1. 50 ml
- 7.2.2. 350ml
- 7.2.3. 600 ml
- 7.2.4. 1000ml
- 7.2.5. Others
- 7.1. Market Analysis, Insights and Forecast - by Application
- 8. South America Bioreactor Flask Analysis, Insights and Forecast, 2021-2033
- 8.1. Market Analysis, Insights and Forecast - by Application
- 8.1.1. Pharmaceutical & Biotechnology Companies
- 8.1.2. Research and Academics
- 8.1.3. Others
- 8.2. Market Analysis, Insights and Forecast - by Type
- 8.2.1. 50 ml
- 8.2.2. 350ml
- 8.2.3. 600 ml
- 8.2.4. 1000ml
- 8.2.5. Others
- 8.1. Market Analysis, Insights and Forecast - by Application
- 9. Europe Bioreactor Flask Analysis, Insights and Forecast, 2021-2033
- 9.1. Market Analysis, Insights and Forecast - by Application
- 9.1.1. Pharmaceutical & Biotechnology Companies
- 9.1.2. Research and Academics
- 9.1.3. Others
- 9.2. Market Analysis, Insights and Forecast - by Type
- 9.2.1. 50 ml
- 9.2.2. 350ml
- 9.2.3. 600 ml
- 9.2.4. 1000ml
- 9.2.5. Others
- 9.1. Market Analysis, Insights and Forecast - by Application
- 10. Middle East & Africa Bioreactor Flask Analysis, Insights and Forecast, 2021-2033
- 10.1. Market Analysis, Insights and Forecast - by Application
- 10.1.1. Pharmaceutical & Biotechnology Companies
- 10.1.2. Research and Academics
- 10.1.3. Others
- 10.2. Market Analysis, Insights and Forecast - by Type
- 10.2.1. 50 ml
- 10.2.2. 350ml
- 10.2.3. 600 ml
- 10.2.4. 1000ml
- 10.2.5. Others
- 10.1. Market Analysis, Insights and Forecast - by Application
- 11. Asia Pacific Bioreactor Flask Analysis, Insights and Forecast, 2021-2033
- 11.1. Market Analysis, Insights and Forecast - by Application
- 11.1.1. Pharmaceutical & Biotechnology Companies
- 11.1.2. Research and Academics
- 11.1.3. Others
- 11.2. Market Analysis, Insights and Forecast - by Type
- 11.2.1. 50 ml
- 11.2.2. 350ml
- 11.2.3. 600 ml
- 11.2.4. 1000ml
- 11.2.5. Others
- 11.1. Market Analysis, Insights and Forecast - by Application
- 12. Competitive Analysis
- 12.1. Company Profiles
- 12.1.1 Thermo Fisher Scientific Inc.
- 12.1.1.1. Company Overview
- 12.1.1.2. Products
- 12.1.1.3. Company Financials
- 12.1.1.4. SWOT Analysis
- 12.1.2 Stemcell Technologies Inc.
- 12.1.2.1. Company Overview
- 12.1.2.2. Products
- 12.1.2.3. Company Financials
- 12.1.2.4. SWOT Analysis
- 12.1.3 Merck & Co. Ltd.
- 12.1.3.1. Company Overview
- 12.1.3.2. Products
- 12.1.3.3. Company Financials
- 12.1.3.4. SWOT Analysis
- 12.1.4 Sartorius AG
- 12.1.4.1. Company Overview
- 12.1.4.2. Products
- 12.1.4.3. Company Financials
- 12.1.4.4. SWOT Analysis
- 12.1.5 Cell Treat Scientific
- 12.1.5.1. Company Overview
- 12.1.5.2. Products
- 12.1.5.3. Company Financials
- 12.1.5.4. SWOT Analysis
- 12.1.6 Greiner Bio-One
- 12.1.6.1. Company Overview
- 12.1.6.2. Products
- 12.1.6.3. Company Financials
- 12.1.6.4. SWOT Analysis
- 12.1.7 SorfaLifeScience
- 12.1.7.1. Company Overview
- 12.1.7.2. Products
- 12.1.7.3. Company Financials
- 12.1.7.4. SWOT Analysis
- 12.1.8 Crystalgen
- 12.1.8.1. Company Overview
- 12.1.8.2. Products
- 12.1.8.3. Company Financials
- 12.1.8.4. SWOT Analysis
- 12.1.9 Corning
- 12.1.9.1. Company Overview
- 12.1.9.2. Products
- 12.1.9.3. Company Financials
- 12.1.9.4. SWOT Analysis
- 12.1.10 WK Life Sciences Ltd.
- 12.1.10.1. Company Overview
- 12.1.10.2. Products
- 12.1.10.3. Company Financials
- 12.1.10.4. SWOT Analysis
- 12.1.11 Himedia Laboratories
- 12.1.11.1. Company Overview
- 12.1.11.2. Products
- 12.1.11.3. Company Financials
- 12.1.11.4. SWOT Analysis
- 12.1.1 Thermo Fisher Scientific Inc.
- 12.2. Market Entropy
- 12.2.1 Company's Key Areas Served
- 12.2.2 Recent Developments
- 12.3. Company Market Share Analysis 2025
- 12.3.1 Top 5 Companies Market Share Analysis
- 12.3.2 Top 3 Companies Market Share Analysis
- 12.4. List of Potential Customers
- 13. Research Methodology
List of Figures
- Figure 1: Global Bioreactor Flask Revenue Breakdown (billion, %) by Region 2025 & 2033
- Figure 2: Global Bioreactor Flask Volume Breakdown (K, %) by Region 2025 & 2033
- Figure 3: North America Bioreactor Flask Revenue (billion), by Application 2025 & 2033
- Figure 4: North America Bioreactor Flask Volume (K), by Application 2025 & 2033
- Figure 5: North America Bioreactor Flask Revenue Share (%), by Application 2025 & 2033
- Figure 6: North America Bioreactor Flask Volume Share (%), by Application 2025 & 2033
- Figure 7: North America Bioreactor Flask Revenue (billion), by Type 2025 & 2033
- Figure 8: North America Bioreactor Flask Volume (K), by Type 2025 & 2033
- Figure 9: North America Bioreactor Flask Revenue Share (%), by Type 2025 & 2033
- Figure 10: North America Bioreactor Flask Volume Share (%), by Type 2025 & 2033
- Figure 11: North America Bioreactor Flask Revenue (billion), by Country 2025 & 2033
- Figure 12: North America Bioreactor Flask Volume (K), by Country 2025 & 2033
- Figure 13: North America Bioreactor Flask Revenue Share (%), by Country 2025 & 2033
- Figure 14: North America Bioreactor Flask Volume Share (%), by Country 2025 & 2033
- Figure 15: South America Bioreactor Flask Revenue (billion), by Application 2025 & 2033
- Figure 16: South America Bioreactor Flask Volume (K), by Application 2025 & 2033
- Figure 17: South America Bioreactor Flask Revenue Share (%), by Application 2025 & 2033
- Figure 18: South America Bioreactor Flask Volume Share (%), by Application 2025 & 2033
- Figure 19: South America Bioreactor Flask Revenue (billion), by Type 2025 & 2033
- Figure 20: South America Bioreactor Flask Volume (K), by Type 2025 & 2033
- Figure 21: South America Bioreactor Flask Revenue Share (%), by Type 2025 & 2033
- Figure 22: South America Bioreactor Flask Volume Share (%), by Type 2025 & 2033
- Figure 23: South America Bioreactor Flask Revenue (billion), by Country 2025 & 2033
- Figure 24: South America Bioreactor Flask Volume (K), by Country 2025 & 2033
- Figure 25: South America Bioreactor Flask Revenue Share (%), by Country 2025 & 2033
- Figure 26: South America Bioreactor Flask Volume Share (%), by Country 2025 & 2033
- Figure 27: Europe Bioreactor Flask Revenue (billion), by Application 2025 & 2033
- Figure 28: Europe Bioreactor Flask Volume (K), by Application 2025 & 2033
- Figure 29: Europe Bioreactor Flask Revenue Share (%), by Application 2025 & 2033
- Figure 30: Europe Bioreactor Flask Volume Share (%), by Application 2025 & 2033
- Figure 31: Europe Bioreactor Flask Revenue (billion), by Type 2025 & 2033
- Figure 32: Europe Bioreactor Flask Volume (K), by Type 2025 & 2033
- Figure 33: Europe Bioreactor Flask Revenue Share (%), by Type 2025 & 2033
- Figure 34: Europe Bioreactor Flask Volume Share (%), by Type 2025 & 2033
- Figure 35: Europe Bioreactor Flask Revenue (billion), by Country 2025 & 2033
- Figure 36: Europe Bioreactor Flask Volume (K), by Country 2025 & 2033
- Figure 37: Europe Bioreactor Flask Revenue Share (%), by Country 2025 & 2033
- Figure 38: Europe Bioreactor Flask Volume Share (%), by Country 2025 & 2033
- Figure 39: Middle East & Africa Bioreactor Flask Revenue (billion), by Application 2025 & 2033
- Figure 40: Middle East & Africa Bioreactor Flask Volume (K), by Application 2025 & 2033
- Figure 41: Middle East & Africa Bioreactor Flask Revenue Share (%), by Application 2025 & 2033
- Figure 42: Middle East & Africa Bioreactor Flask Volume Share (%), by Application 2025 & 2033
- Figure 43: Middle East & Africa Bioreactor Flask Revenue (billion), by Type 2025 & 2033
- Figure 44: Middle East & Africa Bioreactor Flask Volume (K), by Type 2025 & 2033
- Figure 45: Middle East & Africa Bioreactor Flask Revenue Share (%), by Type 2025 & 2033
- Figure 46: Middle East & Africa Bioreactor Flask Volume Share (%), by Type 2025 & 2033
- Figure 47: Middle East & Africa Bioreactor Flask Revenue (billion), by Country 2025 & 2033
- Figure 48: Middle East & Africa Bioreactor Flask Volume (K), by Country 2025 & 2033
- Figure 49: Middle East & Africa Bioreactor Flask Revenue Share (%), by Country 2025 & 2033
- Figure 50: Middle East & Africa Bioreactor Flask Volume Share (%), by Country 2025 & 2033
- Figure 51: Asia Pacific Bioreactor Flask Revenue (billion), by Application 2025 & 2033
- Figure 52: Asia Pacific Bioreactor Flask Volume (K), by Application 2025 & 2033
- Figure 53: Asia Pacific Bioreactor Flask Revenue Share (%), by Application 2025 & 2033
- Figure 54: Asia Pacific Bioreactor Flask Volume Share (%), by Application 2025 & 2033
- Figure 55: Asia Pacific Bioreactor Flask Revenue (billion), by Type 2025 & 2033
- Figure 56: Asia Pacific Bioreactor Flask Volume (K), by Type 2025 & 2033
- Figure 57: Asia Pacific Bioreactor Flask Revenue Share (%), by Type 2025 & 2033
- Figure 58: Asia Pacific Bioreactor Flask Volume Share (%), by Type 2025 & 2033
- Figure 59: Asia Pacific Bioreactor Flask Revenue (billion), by Country 2025 & 2033
- Figure 60: Asia Pacific Bioreactor Flask Volume (K), by Country 2025 & 2033
- Figure 61: Asia Pacific Bioreactor Flask Revenue Share (%), by Country 2025 & 2033
- Figure 62: Asia Pacific Bioreactor Flask Volume Share (%), by Country 2025 & 2033
List of Tables
- Table 1: Global Bioreactor Flask Revenue billion Forecast, by Application 2020 & 2033
- Table 2: Global Bioreactor Flask Volume K Forecast, by Application 2020 & 2033
- Table 3: Global Bioreactor Flask Revenue billion Forecast, by Type 2020 & 2033
- Table 4: Global Bioreactor Flask Volume K Forecast, by Type 2020 & 2033
- Table 5: Global Bioreactor Flask Revenue billion Forecast, by Region 2020 & 2033
- Table 6: Global Bioreactor Flask Volume K Forecast, by Region 2020 & 2033
- Table 7: Global Bioreactor Flask Revenue billion Forecast, by Application 2020 & 2033
- Table 8: Global Bioreactor Flask Volume K Forecast, by Application 2020 & 2033
- Table 9: Global Bioreactor Flask Revenue billion Forecast, by Type 2020 & 2033
- Table 10: Global Bioreactor Flask Volume K Forecast, by Type 2020 & 2033
- Table 11: Global Bioreactor Flask Revenue billion Forecast, by Country 2020 & 2033
- Table 12: Global Bioreactor Flask Volume K Forecast, by Country 2020 & 2033
- Table 13: United States Bioreactor Flask Revenue (billion) Forecast, by Application 2020 & 2033
- Table 14: United States Bioreactor Flask Volume (K) Forecast, by Application 2020 & 2033
- Table 15: Canada Bioreactor Flask Revenue (billion) Forecast, by Application 2020 & 2033
- Table 16: Canada Bioreactor Flask Volume (K) Forecast, by Application 2020 & 2033
- Table 17: Mexico Bioreactor Flask Revenue (billion) Forecast, by Application 2020 & 2033
- Table 18: Mexico Bioreactor Flask Volume (K) Forecast, by Application 2020 & 2033
- Table 19: Global Bioreactor Flask Revenue billion Forecast, by Application 2020 & 2033
- Table 20: Global Bioreactor Flask Volume K Forecast, by Application 2020 & 2033
- Table 21: Global Bioreactor Flask Revenue billion Forecast, by Type 2020 & 2033
- Table 22: Global Bioreactor Flask Volume K Forecast, by Type 2020 & 2033
- Table 23: Global Bioreactor Flask Revenue billion Forecast, by Country 2020 & 2033
- Table 24: Global Bioreactor Flask Volume K Forecast, by Country 2020 & 2033
- Table 25: Brazil Bioreactor Flask Revenue (billion) Forecast, by Application 2020 & 2033
- Table 26: Brazil Bioreactor Flask Volume (K) Forecast, by Application 2020 & 2033
- Table 27: Argentina Bioreactor Flask Revenue (billion) Forecast, by Application 2020 & 2033
- Table 28: Argentina Bioreactor Flask Volume (K) Forecast, by Application 2020 & 2033
- Table 29: Rest of South America Bioreactor Flask Revenue (billion) Forecast, by Application 2020 & 2033
- Table 30: Rest of South America Bioreactor Flask Volume (K) Forecast, by Application 2020 & 2033
- Table 31: Global Bioreactor Flask Revenue billion Forecast, by Application 2020 & 2033
- Table 32: Global Bioreactor Flask Volume K Forecast, by Application 2020 & 2033
- Table 33: Global Bioreactor Flask Revenue billion Forecast, by Type 2020 & 2033
- Table 34: Global Bioreactor Flask Volume K Forecast, by Type 2020 & 2033
- Table 35: Global Bioreactor Flask Revenue billion Forecast, by Country 2020 & 2033
- Table 36: Global Bioreactor Flask Volume K Forecast, by Country 2020 & 2033
- Table 37: United Kingdom Bioreactor Flask Revenue (billion) Forecast, by Application 2020 & 2033
- Table 38: United Kingdom Bioreactor Flask Volume (K) Forecast, by Application 2020 & 2033
- Table 39: Germany Bioreactor Flask Revenue (billion) Forecast, by Application 2020 & 2033
- Table 40: Germany Bioreactor Flask Volume (K) Forecast, by Application 2020 & 2033
- Table 41: France Bioreactor Flask Revenue (billion) Forecast, by Application 2020 & 2033
- Table 42: France Bioreactor Flask Volume (K) Forecast, by Application 2020 & 2033
- Table 43: Italy Bioreactor Flask Revenue (billion) Forecast, by Application 2020 & 2033
- Table 44: Italy Bioreactor Flask Volume (K) Forecast, by Application 2020 & 2033
- Table 45: Spain Bioreactor Flask Revenue (billion) Forecast, by Application 2020 & 2033
- Table 46: Spain Bioreactor Flask Volume (K) Forecast, by Application 2020 & 2033
- Table 47: Russia Bioreactor Flask Revenue (billion) Forecast, by Application 2020 & 2033
- Table 48: Russia Bioreactor Flask Volume (K) Forecast, by Application 2020 & 2033
- Table 49: Benelux Bioreactor Flask Revenue (billion) Forecast, by Application 2020 & 2033
- Table 50: Benelux Bioreactor Flask Volume (K) Forecast, by Application 2020 & 2033
- Table 51: Nordics Bioreactor Flask Revenue (billion) Forecast, by Application 2020 & 2033
- Table 52: Nordics Bioreactor Flask Volume (K) Forecast, by Application 2020 & 2033
- Table 53: Rest of Europe Bioreactor Flask Revenue (billion) Forecast, by Application 2020 & 2033
- Table 54: Rest of Europe Bioreactor Flask Volume (K) Forecast, by Application 2020 & 2033
- Table 55: Global Bioreactor Flask Revenue billion Forecast, by Application 2020 & 2033
- Table 56: Global Bioreactor Flask Volume K Forecast, by Application 2020 & 2033
- Table 57: Global Bioreactor Flask Revenue billion Forecast, by Type 2020 & 2033
- Table 58: Global Bioreactor Flask Volume K Forecast, by Type 2020 & 2033
- Table 59: Global Bioreactor Flask Revenue billion Forecast, by Country 2020 & 2033
- Table 60: Global Bioreactor Flask Volume K Forecast, by Country 2020 & 2033
- Table 61: Turkey Bioreactor Flask Revenue (billion) Forecast, by Application 2020 & 2033
- Table 62: Turkey Bioreactor Flask Volume (K) Forecast, by Application 2020 & 2033
- Table 63: Israel Bioreactor Flask Revenue (billion) Forecast, by Application 2020 & 2033
- Table 64: Israel Bioreactor Flask Volume (K) Forecast, by Application 2020 & 2033
- Table 65: GCC Bioreactor Flask Revenue (billion) Forecast, by Application 2020 & 2033
- Table 66: GCC Bioreactor Flask Volume (K) Forecast, by Application 2020 & 2033
- Table 67: North Africa Bioreactor Flask Revenue (billion) Forecast, by Application 2020 & 2033
- Table 68: North Africa Bioreactor Flask Volume (K) Forecast, by Application 2020 & 2033
- Table 69: South Africa Bioreactor Flask Revenue (billion) Forecast, by Application 2020 & 2033
- Table 70: South Africa Bioreactor Flask Volume (K) Forecast, by Application 2020 & 2033
- Table 71: Rest of Middle East & Africa Bioreactor Flask Revenue (billion) Forecast, by Application 2020 & 2033
- Table 72: Rest of Middle East & Africa Bioreactor Flask Volume (K) Forecast, by Application 2020 & 2033
- Table 73: Global Bioreactor Flask Revenue billion Forecast, by Application 2020 & 2033
- Table 74: Global Bioreactor Flask Volume K Forecast, by Application 2020 & 2033
- Table 75: Global Bioreactor Flask Revenue billion Forecast, by Type 2020 & 2033
- Table 76: Global Bioreactor Flask Volume K Forecast, by Type 2020 & 2033
- Table 77: Global Bioreactor Flask Revenue billion Forecast, by Country 2020 & 2033
- Table 78: Global Bioreactor Flask Volume K Forecast, by Country 2020 & 2033
- Table 79: China Bioreactor Flask Revenue (billion) Forecast, by Application 2020 & 2033
- Table 80: China Bioreactor Flask Volume (K) Forecast, by Application 2020 & 2033
- Table 81: India Bioreactor Flask Revenue (billion) Forecast, by Application 2020 & 2033
- Table 82: India Bioreactor Flask Volume (K) Forecast, by Application 2020 & 2033
- Table 83: Japan Bioreactor Flask Revenue (billion) Forecast, by Application 2020 & 2033
- Table 84: Japan Bioreactor Flask Volume (K) Forecast, by Application 2020 & 2033
- Table 85: South Korea Bioreactor Flask Revenue (billion) Forecast, by Application 2020 & 2033
- Table 86: South Korea Bioreactor Flask Volume (K) Forecast, by Application 2020 & 2033
- Table 87: ASEAN Bioreactor Flask Revenue (billion) Forecast, by Application 2020 & 2033
- Table 88: ASEAN Bioreactor Flask Volume (K) Forecast, by Application 2020 & 2033
- Table 89: Oceania Bioreactor Flask Revenue (billion) Forecast, by Application 2020 & 2033
- Table 90: Oceania Bioreactor Flask Volume (K) Forecast, by Application 2020 & 2033
- Table 91: Rest of Asia Pacific Bioreactor Flask Revenue (billion) Forecast, by Application 2020 & 2033
- Table 92: Rest of Asia Pacific Bioreactor Flask Volume (K) Forecast, by Application 2020 & 2033
Frequently Asked Questions
1. What is the projected Compound Annual Growth Rate (CAGR) of the Bioreactor Flask?
The projected CAGR is approximately 9.45%.
2. Which companies are prominent players in the Bioreactor Flask?
Key companies in the market include Thermo Fisher Scientific Inc., Stemcell Technologies Inc., Merck & Co. Ltd., Sartorius AG, Cell Treat Scientific, Greiner Bio-One, SorfaLifeScience, Crystalgen, Corning, WK Life Sciences Ltd., Himedia Laboratories.
3. What are the main segments of the Bioreactor Flask?
The market segments include Application, Type.
4. Can you provide details about the market size?
The market size is estimated to be USD 6.18 billion as of 2022.
5. What are some drivers contributing to market growth?
N/A
6. What are the notable trends driving market growth?
N/A
7. Are there any restraints impacting market growth?
N/A
8. Can you provide examples of recent developments in the market?
N/A
9. What pricing options are available for accessing the report?
Pricing options include single-user, multi-user, and enterprise licenses priced at USD 3950.00, USD 5925.00, and USD 7900.00 respectively.
10. Is the market size provided in terms of value or volume?
The market size is provided in terms of value, measured in billion and volume, measured in K.
11. Are there any specific market keywords associated with the report?
Yes, the market keyword associated with the report is "Bioreactor Flask," which aids in identifying and referencing the specific market segment covered.
12. How do I determine which pricing option suits my needs best?
The pricing options vary based on user requirements and access needs. Individual users may opt for single-user licenses, while businesses requiring broader access may choose multi-user or enterprise licenses for cost-effective access to the report.
13. Are there any additional resources or data provided in the Bioreactor Flask report?
While the report offers comprehensive insights, it's advisable to review the specific contents or supplementary materials provided to ascertain if additional resources or data are available.
14. How can I stay updated on further developments or reports in the Bioreactor Flask?
To stay informed about further developments, trends, and reports in the Bioreactor Flask, consider subscribing to industry newsletters, following relevant companies and organizations, or regularly checking reputable industry news sources and publications.
Methodology
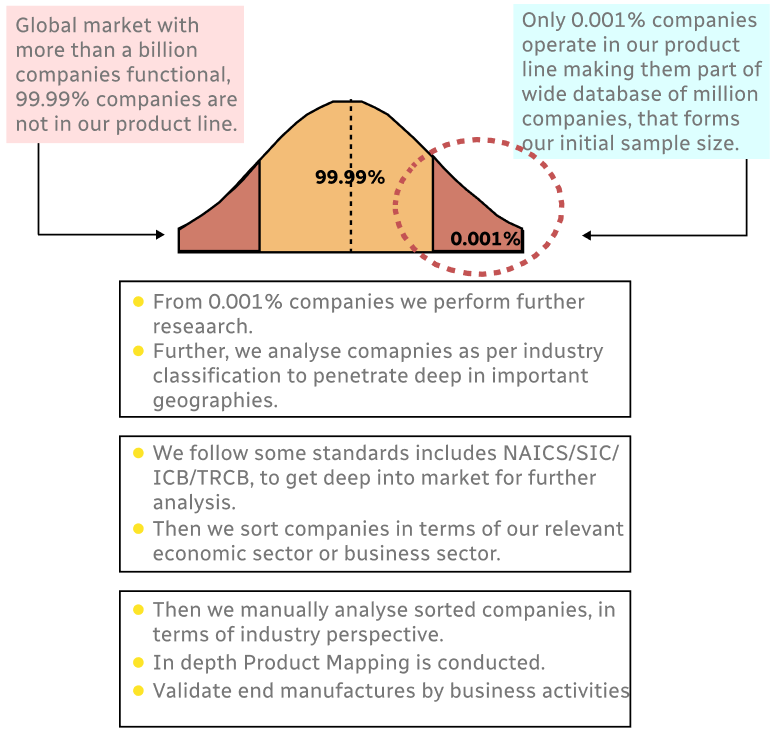
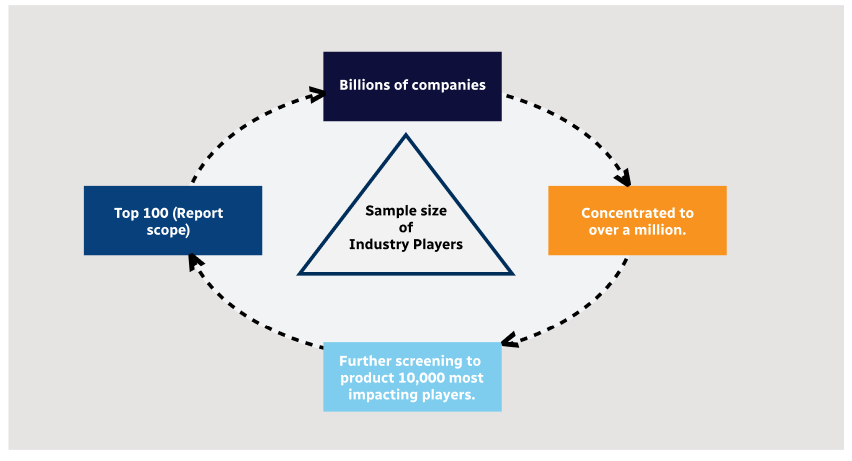
Step 1 - Identification of Relevant Samples Size from Population Database
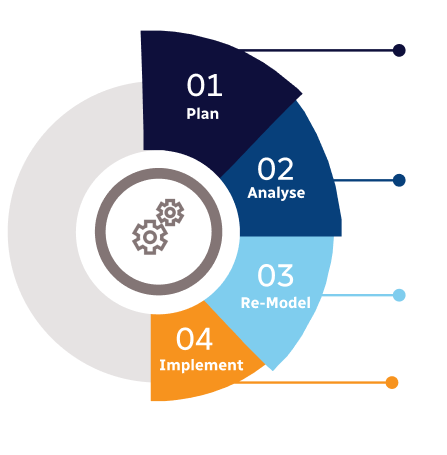
Step 2 - Approaches for Defining Global Market Size (Value, Volume* & Price*)
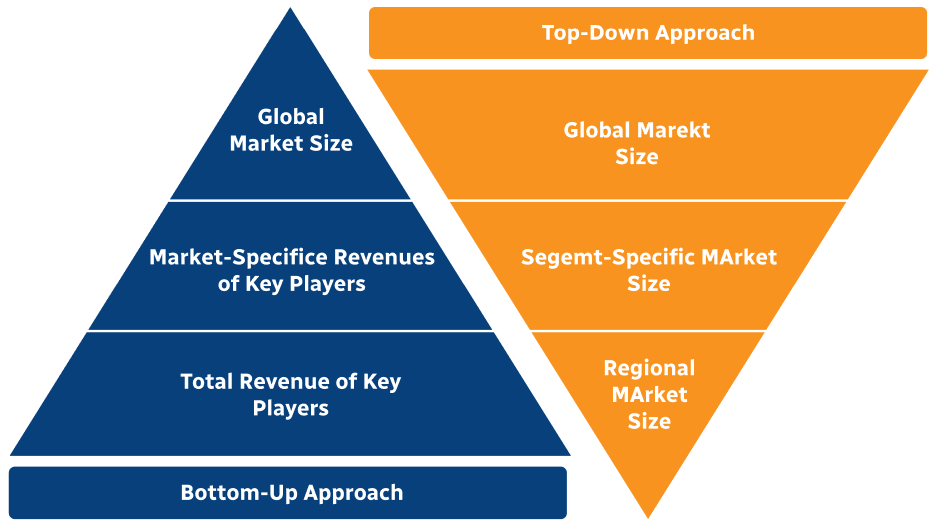
Note*: In applicable scenarios
Step 3 - Data Sources
Primary Research
- Web Analytics
- Survey Reports
- Research Institute
- Latest Research Reports
- Opinion Leaders
Secondary Research
- Annual Reports
- White Paper
- Latest Press Release
- Industry Association
- Paid Database
- Investor Presentations
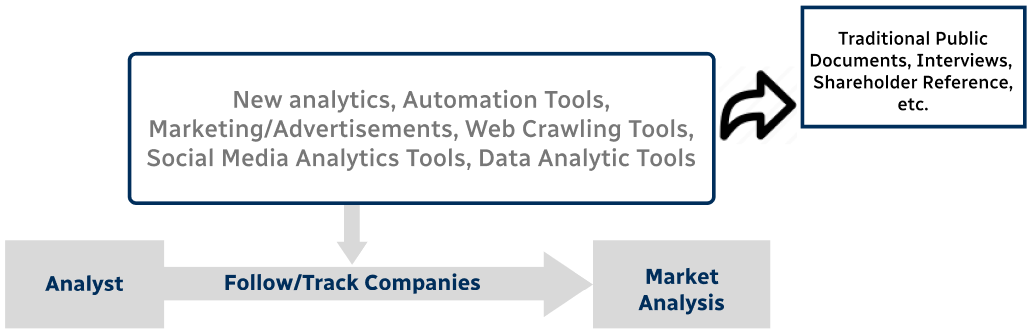
Step 4 - Data Triangulation
Involves using different sources of information in order to increase the validity of a study
These sources are likely to be stakeholders in a program - participants, other researchers, program staff, other community members, and so on.
Then we put all data in single framework & apply various statistical tools to find out the dynamic on the market.
During the analysis stage, feedback from the stakeholder groups would be compared to determine areas of agreement as well as areas of divergence