
Key Insights
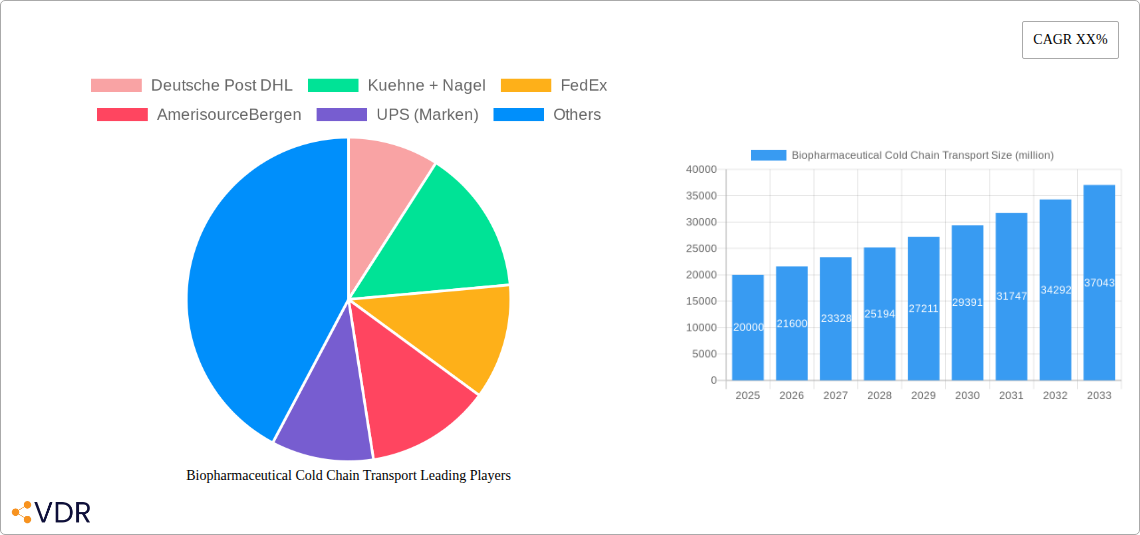
The biopharmaceutical cold chain transport market is experiencing robust growth, driven by the increasing demand for temperature-sensitive biologics and the expansion of global pharmaceutical production and distribution networks. The market's value is estimated at $20 billion in 2025, exhibiting a Compound Annual Growth Rate (CAGR) of approximately 8% from 2025 to 2033. This growth is fueled by several key factors, including the rising prevalence of chronic diseases necessitating continuous medication, advancements in biotechnology leading to more temperature-sensitive drugs, and stringent regulatory requirements ensuring product integrity throughout the supply chain. Furthermore, the increasing adoption of advanced cold chain technologies, such as temperature-controlled containers, real-time monitoring systems, and sophisticated logistics management software, are streamlining operations and enhancing efficiency, further boosting market expansion.
However, several challenges remain. Significant upfront investment in specialized infrastructure and equipment, along with potential risks associated with supply chain disruptions and geopolitical instability, pose constraints to market growth. The need for robust regulatory compliance and the potential for product spoilage due to unforeseen circumstances also add to the complexities of this sector. Despite these hurdles, the market is expected to witness sustained growth, primarily driven by the ongoing evolution of pharmaceutical manufacturing and the continuous expansion of global healthcare access. Key players like Deutsche Post DHL, Kuehne + Nagel, FedEx, and UPS are investing heavily in enhancing their cold chain capabilities to capitalize on this burgeoning market opportunity. The market is segmented geographically, with North America and Europe currently holding significant market shares, but emerging economies in Asia-Pacific and Latin America are witnessing increasing demand and thus present significant future growth potential.
Biopharmaceutical Cold Chain Transport Market Report: 2019-2033
This comprehensive report provides a detailed analysis of the biopharmaceutical cold chain transport market, offering invaluable insights for industry professionals, investors, and strategic decision-makers. The study covers the period from 2019 to 2033, with a focus on the 2025-2033 forecast period. The parent market is the global logistics industry, with the child market being specialized temperature-controlled transportation for pharmaceuticals. The report values the market in millions of units (USD).
Biopharmaceutical Cold Chain Transport Market Dynamics & Structure
The biopharmaceutical cold chain transport market is characterized by moderate concentration, with several major players holding significant market share. Technological advancements, particularly in temperature monitoring and data management systems, are key innovation drivers. Stringent regulatory frameworks, including GDP (Good Distribution Practices) and temperature excursion management regulations, significantly influence market operations. Competitive pressures arise from alternative transportation solutions and the need for cost-effective, reliable services. End-users comprise pharmaceutical manufacturers, contract research organizations (CROs), and distributors. Mergers and acquisitions (M&A) activity has been notable, resulting in market consolidation.
- Market Concentration: Moderately concentrated, with the top 5 players holding approximately xx% market share in 2025.
- M&A Activity: xx major deals were recorded between 2019-2024, driven by a need for expanded reach and technological capabilities.
- Regulatory Landscape: Stringent GDP guidelines and increasing emphasis on data integrity and traceability.
- Technological Innovation: Focus on real-time monitoring, IoT integration, and predictive analytics.
- Competitive Landscape: Intense competition among established players and emerging niche providers.
Biopharmaceutical Cold Chain Transport Growth Trends & Insights
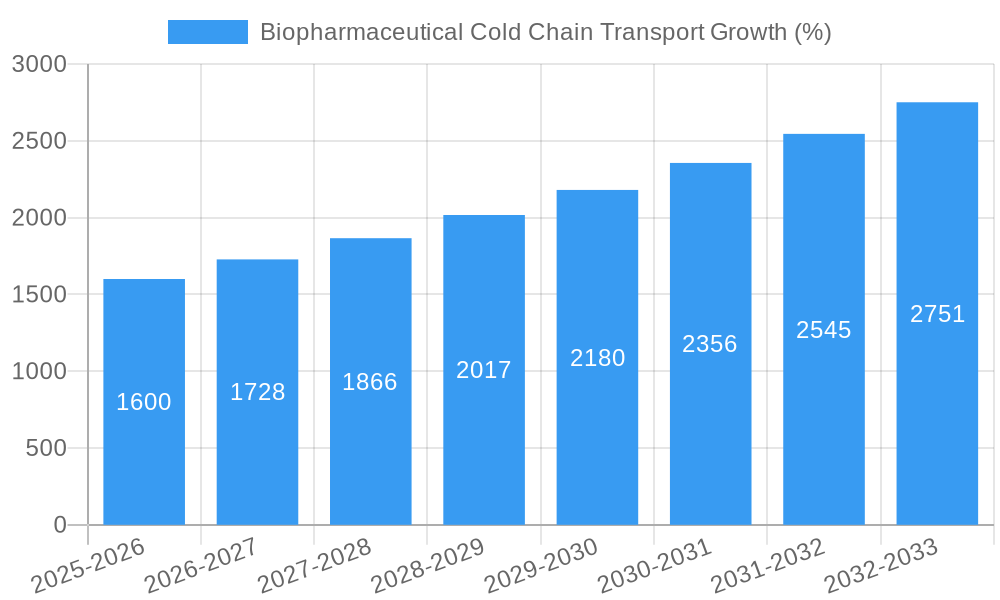
The biopharmaceutical cold chain transport market has experienced significant growth over the historical period (2019-2024), driven by the increasing global demand for temperature-sensitive pharmaceuticals, particularly biologics and vaccines. This growth is expected to continue at a Compound Annual Growth Rate (CAGR) of xx% from 2025 to 2033, reaching a market size of xx million USD by 2033. The rising prevalence of chronic diseases, technological advancements in drug delivery, and expansion into emerging markets are key contributing factors. Increased adoption of advanced temperature-controlled containers and sophisticated monitoring technologies further fuels market expansion. Consumer behavior shifts, demanding enhanced transparency and accountability, impact the adoption of technologically advanced solutions.
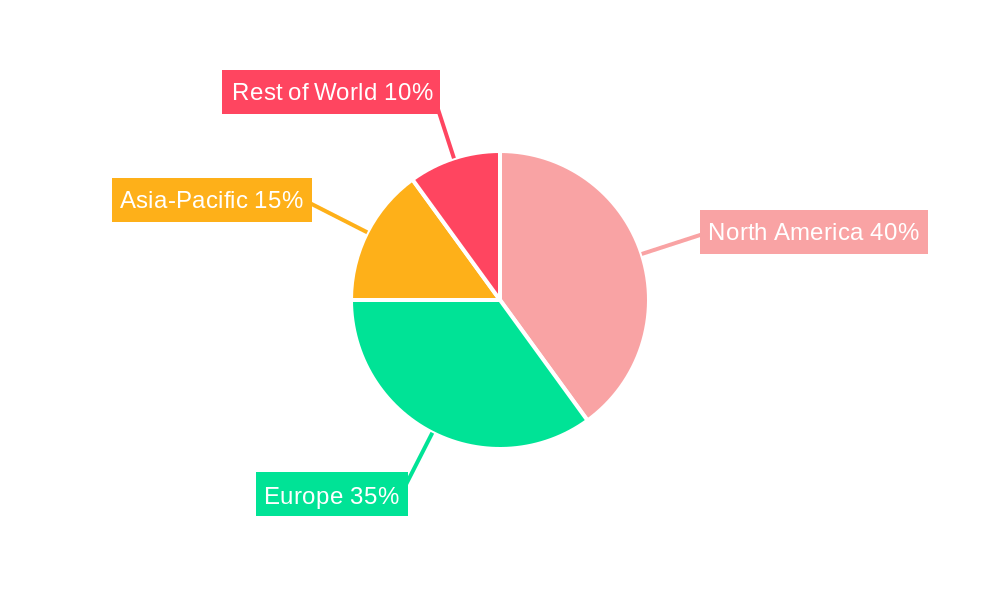
Dominant Regions, Countries, or Segments in Biopharmaceutical Cold Chain Transport
North America currently holds the largest market share, driven by factors such as robust healthcare infrastructure, high pharmaceutical production, and stringent regulatory frameworks. Europe follows closely, with strong demand from established pharmaceutical markets. The Asia-Pacific region demonstrates high growth potential due to increasing healthcare spending and rising prevalence of chronic diseases.
- North America: Large pharmaceutical manufacturing base, advanced infrastructure, and strong regulatory environment.
- Europe: Established pharmaceutical industry, high healthcare expenditure, and stringent quality standards.
- Asia-Pacific: Rapidly expanding healthcare sector, rising disposable incomes, and increasing prevalence of chronic diseases.
Biopharmaceutical Cold Chain Transport Product Landscape
The product landscape encompasses a range of temperature-controlled containers, packaging solutions, and specialized transport vehicles. Recent innovations include the integration of real-time monitoring systems, smart sensors, and data analytics platforms that enhance temperature control, reduce the risk of excursions, and improve overall supply chain visibility. These advancements aim to mitigate the risk of product degradation and ensure drug efficacy.
Key Drivers, Barriers & Challenges in Biopharmaceutical Cold Chain Transport
Key Drivers:
- Increasing demand for temperature-sensitive biologics and vaccines.
- Advancements in temperature-controlled packaging and monitoring technologies.
- Stringent regulatory requirements driving adoption of advanced solutions.
Challenges & Restraints:
- High infrastructure costs associated with maintaining cold chain integrity.
- Difficulty in managing temperature excursions during long-distance transport.
- Compliance with complex regulatory requirements across diverse geographical regions. This impacts approximately xx% of shipments annually.
Emerging Opportunities in Biopharmaceutical Cold Chain Transport
- Expansion into emerging markets with growing healthcare expenditure.
- Development of innovative packaging solutions for extended temperature control.
- Increased adoption of digital technologies for improved supply chain visibility.
Growth Accelerators in the Biopharmaceutical Cold Chain Transport Industry
The long-term growth of the biopharmaceutical cold chain transport market is anticipated to be fueled by technological breakthroughs in temperature-controlled packaging and real-time monitoring, strategic partnerships between logistics providers and pharmaceutical companies to optimize supply chains, and market expansion into emerging economies, particularly in Asia-Pacific and Latin America.
Key Players Shaping the Biopharmaceutical Cold Chain Transport Market
- Deutsche Post DHL
- Kuehne + Nagel
- FedEx
- AmerisourceBergen
- UPS (Marken)
- DB Schenker
- XPO Logistics
- Panalpina (Note: Panalpina was acquired by DSV)
- Nippon Express
- GEODIS
- VersaCold
- Agility
- DSV
- Sinotrans
- Kerry Logistics
- SF Express
- CEVA
- CH Robinson
- Air Canada Cargo
Notable Milestones in Biopharmaceutical Cold Chain Transport Sector
- 2020: Increased adoption of IoT-enabled temperature monitoring systems.
- 2021: Several major pharmaceutical companies invested heavily in cold chain infrastructure upgrades.
- 2022: Launch of several new temperature-controlled container designs with enhanced insulation and monitoring capabilities.
- 2023: Significant M&A activity consolidating market share amongst major logistics providers.
In-Depth Biopharmaceutical Cold Chain Transport Market Outlook
The future of the biopharmaceutical cold chain transport market is bright, with continued growth expected due to technological advancements, regulatory pressures, and increasing demand for temperature-sensitive pharmaceuticals. Strategic opportunities lie in developing innovative packaging solutions, expanding into underserved markets, and leveraging digital technologies to optimize supply chain efficiency and enhance transparency. This will lead to substantial market expansion, driven by the continued growth in the global pharmaceutical industry and the increasing focus on patient safety and drug efficacy.
Biopharmaceutical Cold Chain Transport Segmentation
-
1. Application
- 1.1. Blood Products
- 1.2. Vaccines
- 1.3. Others
-
2. Types
- 2.1. Ground Shipping
- 2.2. Sea Shipping
- 2.3. Air Shipping
Biopharmaceutical Cold Chain Transport Segmentation By Geography
-
1. North America
- 1.1. United States
- 1.2. Canada
- 1.3. Mexico
-
2. South America
- 2.1. Brazil
- 2.2. Argentina
- 2.3. Rest of South America
-
3. Europe
- 3.1. United Kingdom
- 3.2. Germany
- 3.3. France
- 3.4. Italy
- 3.5. Spain
- 3.6. Russia
- 3.7. Benelux
- 3.8. Nordics
- 3.9. Rest of Europe
-
4. Middle East & Africa
- 4.1. Turkey
- 4.2. Israel
- 4.3. GCC
- 4.4. North Africa
- 4.5. South Africa
- 4.6. Rest of Middle East & Africa
-
5. Asia Pacific
- 5.1. China
- 5.2. India
- 5.3. Japan
- 5.4. South Korea
- 5.5. ASEAN
- 5.6. Oceania
- 5.7. Rest of Asia Pacific
Biopharmaceutical Cold Chain Transport REPORT HIGHLIGHTS
| Aspects | Details |
|---|---|
| Study Period | 2019-2033 |
| Base Year | 2024 |
| Estimated Year | 2025 |
| Forecast Period | 2025-2033 |
| Historical Period | 2019-2024 |
| Growth Rate | CAGR of XX% from 2019-2033 |
| Segmentation |
|
Table of Contents
- 1. Introduction
- 1.1. Research Scope
- 1.2. Market Segmentation
- 1.3. Research Methodology
- 1.4. Definitions and Assumptions
- 2. Executive Summary
- 2.1. Introduction
- 3. Market Dynamics
- 3.1. Introduction
- 3.2. Market Drivers
- 3.3. Market Restrains
- 3.4. Market Trends
- 4. Market Factor Analysis
- 4.1. Porters Five Forces
- 4.2. Supply/Value Chain
- 4.3. PESTEL analysis
- 4.4. Market Entropy
- 4.5. Patent/Trademark Analysis
- 5. Global Biopharmaceutical Cold Chain Transport Analysis, Insights and Forecast, 2019-2031
- 5.1. Market Analysis, Insights and Forecast - by Application
- 5.1.1. Blood Products
- 5.1.2. Vaccines
- 5.1.3. Others
- 5.2. Market Analysis, Insights and Forecast - by Types
- 5.2.1. Ground Shipping
- 5.2.2. Sea Shipping
- 5.2.3. Air Shipping
- 5.3. Market Analysis, Insights and Forecast - by Region
- 5.3.1. North America
- 5.3.2. South America
- 5.3.3. Europe
- 5.3.4. Middle East & Africa
- 5.3.5. Asia Pacific
- 5.1. Market Analysis, Insights and Forecast - by Application
- 6. North America Biopharmaceutical Cold Chain Transport Analysis, Insights and Forecast, 2019-2031
- 6.1. Market Analysis, Insights and Forecast - by Application
- 6.1.1. Blood Products
- 6.1.2. Vaccines
- 6.1.3. Others
- 6.2. Market Analysis, Insights and Forecast - by Types
- 6.2.1. Ground Shipping
- 6.2.2. Sea Shipping
- 6.2.3. Air Shipping
- 6.1. Market Analysis, Insights and Forecast - by Application
- 7. South America Biopharmaceutical Cold Chain Transport Analysis, Insights and Forecast, 2019-2031
- 7.1. Market Analysis, Insights and Forecast - by Application
- 7.1.1. Blood Products
- 7.1.2. Vaccines
- 7.1.3. Others
- 7.2. Market Analysis, Insights and Forecast - by Types
- 7.2.1. Ground Shipping
- 7.2.2. Sea Shipping
- 7.2.3. Air Shipping
- 7.1. Market Analysis, Insights and Forecast - by Application
- 8. Europe Biopharmaceutical Cold Chain Transport Analysis, Insights and Forecast, 2019-2031
- 8.1. Market Analysis, Insights and Forecast - by Application
- 8.1.1. Blood Products
- 8.1.2. Vaccines
- 8.1.3. Others
- 8.2. Market Analysis, Insights and Forecast - by Types
- 8.2.1. Ground Shipping
- 8.2.2. Sea Shipping
- 8.2.3. Air Shipping
- 8.1. Market Analysis, Insights and Forecast - by Application
- 9. Middle East & Africa Biopharmaceutical Cold Chain Transport Analysis, Insights and Forecast, 2019-2031
- 9.1. Market Analysis, Insights and Forecast - by Application
- 9.1.1. Blood Products
- 9.1.2. Vaccines
- 9.1.3. Others
- 9.2. Market Analysis, Insights and Forecast - by Types
- 9.2.1. Ground Shipping
- 9.2.2. Sea Shipping
- 9.2.3. Air Shipping
- 9.1. Market Analysis, Insights and Forecast - by Application
- 10. Asia Pacific Biopharmaceutical Cold Chain Transport Analysis, Insights and Forecast, 2019-2031
- 10.1. Market Analysis, Insights and Forecast - by Application
- 10.1.1. Blood Products
- 10.1.2. Vaccines
- 10.1.3. Others
- 10.2. Market Analysis, Insights and Forecast - by Types
- 10.2.1. Ground Shipping
- 10.2.2. Sea Shipping
- 10.2.3. Air Shipping
- 10.1. Market Analysis, Insights and Forecast - by Application
- 11. Competitive Analysis
- 11.1. Global Market Share Analysis 2024
- 11.2. Company Profiles
- 11.2.1 Deutsche Post DHL
- 11.2.1.1. Overview
- 11.2.1.2. Products
- 11.2.1.3. SWOT Analysis
- 11.2.1.4. Recent Developments
- 11.2.1.5. Financials (Based on Availability)
- 11.2.2 Kuehne + Nagel
- 11.2.2.1. Overview
- 11.2.2.2. Products
- 11.2.2.3. SWOT Analysis
- 11.2.2.4. Recent Developments
- 11.2.2.5. Financials (Based on Availability)
- 11.2.3 FedEx
- 11.2.3.1. Overview
- 11.2.3.2. Products
- 11.2.3.3. SWOT Analysis
- 11.2.3.4. Recent Developments
- 11.2.3.5. Financials (Based on Availability)
- 11.2.4 AmerisourceBergen
- 11.2.4.1. Overview
- 11.2.4.2. Products
- 11.2.4.3. SWOT Analysis
- 11.2.4.4. Recent Developments
- 11.2.4.5. Financials (Based on Availability)
- 11.2.5 UPS (Marken)
- 11.2.5.1. Overview
- 11.2.5.2. Products
- 11.2.5.3. SWOT Analysis
- 11.2.5.4. Recent Developments
- 11.2.5.5. Financials (Based on Availability)
- 11.2.6 DB Schenker
- 11.2.6.1. Overview
- 11.2.6.2. Products
- 11.2.6.3. SWOT Analysis
- 11.2.6.4. Recent Developments
- 11.2.6.5. Financials (Based on Availability)
- 11.2.7 XPO Logistics
- 11.2.7.1. Overview
- 11.2.7.2. Products
- 11.2.7.3. SWOT Analysis
- 11.2.7.4. Recent Developments
- 11.2.7.5. Financials (Based on Availability)
- 11.2.8 Panalpina
- 11.2.8.1. Overview
- 11.2.8.2. Products
- 11.2.8.3. SWOT Analysis
- 11.2.8.4. Recent Developments
- 11.2.8.5. Financials (Based on Availability)
- 11.2.9 Nippon Express
- 11.2.9.1. Overview
- 11.2.9.2. Products
- 11.2.9.3. SWOT Analysis
- 11.2.9.4. Recent Developments
- 11.2.9.5. Financials (Based on Availability)
- 11.2.10 GEODIS
- 11.2.10.1. Overview
- 11.2.10.2. Products
- 11.2.10.3. SWOT Analysis
- 11.2.10.4. Recent Developments
- 11.2.10.5. Financials (Based on Availability)
- 11.2.11 VersaCold
- 11.2.11.1. Overview
- 11.2.11.2. Products
- 11.2.11.3. SWOT Analysis
- 11.2.11.4. Recent Developments
- 11.2.11.5. Financials (Based on Availability)
- 11.2.12 Agility
- 11.2.12.1. Overview
- 11.2.12.2. Products
- 11.2.12.3. SWOT Analysis
- 11.2.12.4. Recent Developments
- 11.2.12.5. Financials (Based on Availability)
- 11.2.13 DSV
- 11.2.13.1. Overview
- 11.2.13.2. Products
- 11.2.13.3. SWOT Analysis
- 11.2.13.4. Recent Developments
- 11.2.13.5. Financials (Based on Availability)
- 11.2.14 Sinotrans
- 11.2.14.1. Overview
- 11.2.14.2. Products
- 11.2.14.3. SWOT Analysis
- 11.2.14.4. Recent Developments
- 11.2.14.5. Financials (Based on Availability)
- 11.2.15 Kerry Logistics
- 11.2.15.1. Overview
- 11.2.15.2. Products
- 11.2.15.3. SWOT Analysis
- 11.2.15.4. Recent Developments
- 11.2.15.5. Financials (Based on Availability)
- 11.2.16 SF Express
- 11.2.16.1. Overview
- 11.2.16.2. Products
- 11.2.16.3. SWOT Analysis
- 11.2.16.4. Recent Developments
- 11.2.16.5. Financials (Based on Availability)
- 11.2.17 CEVA
- 11.2.17.1. Overview
- 11.2.17.2. Products
- 11.2.17.3. SWOT Analysis
- 11.2.17.4. Recent Developments
- 11.2.17.5. Financials (Based on Availability)
- 11.2.18 CH Robinson
- 11.2.18.1. Overview
- 11.2.18.2. Products
- 11.2.18.3. SWOT Analysis
- 11.2.18.4. Recent Developments
- 11.2.18.5. Financials (Based on Availability)
- 11.2.19 Air Canada Cargo
- 11.2.19.1. Overview
- 11.2.19.2. Products
- 11.2.19.3. SWOT Analysis
- 11.2.19.4. Recent Developments
- 11.2.19.5. Financials (Based on Availability)
- 11.2.1 Deutsche Post DHL
List of Figures
- Figure 1: Global Biopharmaceutical Cold Chain Transport Revenue Breakdown (million, %) by Region 2024 & 2032
- Figure 2: North America Biopharmaceutical Cold Chain Transport Revenue (million), by Application 2024 & 2032
- Figure 3: North America Biopharmaceutical Cold Chain Transport Revenue Share (%), by Application 2024 & 2032
- Figure 4: North America Biopharmaceutical Cold Chain Transport Revenue (million), by Types 2024 & 2032
- Figure 5: North America Biopharmaceutical Cold Chain Transport Revenue Share (%), by Types 2024 & 2032
- Figure 6: North America Biopharmaceutical Cold Chain Transport Revenue (million), by Country 2024 & 2032
- Figure 7: North America Biopharmaceutical Cold Chain Transport Revenue Share (%), by Country 2024 & 2032
- Figure 8: South America Biopharmaceutical Cold Chain Transport Revenue (million), by Application 2024 & 2032
- Figure 9: South America Biopharmaceutical Cold Chain Transport Revenue Share (%), by Application 2024 & 2032
- Figure 10: South America Biopharmaceutical Cold Chain Transport Revenue (million), by Types 2024 & 2032
- Figure 11: South America Biopharmaceutical Cold Chain Transport Revenue Share (%), by Types 2024 & 2032
- Figure 12: South America Biopharmaceutical Cold Chain Transport Revenue (million), by Country 2024 & 2032
- Figure 13: South America Biopharmaceutical Cold Chain Transport Revenue Share (%), by Country 2024 & 2032
- Figure 14: Europe Biopharmaceutical Cold Chain Transport Revenue (million), by Application 2024 & 2032
- Figure 15: Europe Biopharmaceutical Cold Chain Transport Revenue Share (%), by Application 2024 & 2032
- Figure 16: Europe Biopharmaceutical Cold Chain Transport Revenue (million), by Types 2024 & 2032
- Figure 17: Europe Biopharmaceutical Cold Chain Transport Revenue Share (%), by Types 2024 & 2032
- Figure 18: Europe Biopharmaceutical Cold Chain Transport Revenue (million), by Country 2024 & 2032
- Figure 19: Europe Biopharmaceutical Cold Chain Transport Revenue Share (%), by Country 2024 & 2032
- Figure 20: Middle East & Africa Biopharmaceutical Cold Chain Transport Revenue (million), by Application 2024 & 2032
- Figure 21: Middle East & Africa Biopharmaceutical Cold Chain Transport Revenue Share (%), by Application 2024 & 2032
- Figure 22: Middle East & Africa Biopharmaceutical Cold Chain Transport Revenue (million), by Types 2024 & 2032
- Figure 23: Middle East & Africa Biopharmaceutical Cold Chain Transport Revenue Share (%), by Types 2024 & 2032
- Figure 24: Middle East & Africa Biopharmaceutical Cold Chain Transport Revenue (million), by Country 2024 & 2032
- Figure 25: Middle East & Africa Biopharmaceutical Cold Chain Transport Revenue Share (%), by Country 2024 & 2032
- Figure 26: Asia Pacific Biopharmaceutical Cold Chain Transport Revenue (million), by Application 2024 & 2032
- Figure 27: Asia Pacific Biopharmaceutical Cold Chain Transport Revenue Share (%), by Application 2024 & 2032
- Figure 28: Asia Pacific Biopharmaceutical Cold Chain Transport Revenue (million), by Types 2024 & 2032
- Figure 29: Asia Pacific Biopharmaceutical Cold Chain Transport Revenue Share (%), by Types 2024 & 2032
- Figure 30: Asia Pacific Biopharmaceutical Cold Chain Transport Revenue (million), by Country 2024 & 2032
- Figure 31: Asia Pacific Biopharmaceutical Cold Chain Transport Revenue Share (%), by Country 2024 & 2032
List of Tables
- Table 1: Global Biopharmaceutical Cold Chain Transport Revenue million Forecast, by Region 2019 & 2032
- Table 2: Global Biopharmaceutical Cold Chain Transport Revenue million Forecast, by Application 2019 & 2032
- Table 3: Global Biopharmaceutical Cold Chain Transport Revenue million Forecast, by Types 2019 & 2032
- Table 4: Global Biopharmaceutical Cold Chain Transport Revenue million Forecast, by Region 2019 & 2032
- Table 5: Global Biopharmaceutical Cold Chain Transport Revenue million Forecast, by Application 2019 & 2032
- Table 6: Global Biopharmaceutical Cold Chain Transport Revenue million Forecast, by Types 2019 & 2032
- Table 7: Global Biopharmaceutical Cold Chain Transport Revenue million Forecast, by Country 2019 & 2032
- Table 8: United States Biopharmaceutical Cold Chain Transport Revenue (million) Forecast, by Application 2019 & 2032
- Table 9: Canada Biopharmaceutical Cold Chain Transport Revenue (million) Forecast, by Application 2019 & 2032
- Table 10: Mexico Biopharmaceutical Cold Chain Transport Revenue (million) Forecast, by Application 2019 & 2032
- Table 11: Global Biopharmaceutical Cold Chain Transport Revenue million Forecast, by Application 2019 & 2032
- Table 12: Global Biopharmaceutical Cold Chain Transport Revenue million Forecast, by Types 2019 & 2032
- Table 13: Global Biopharmaceutical Cold Chain Transport Revenue million Forecast, by Country 2019 & 2032
- Table 14: Brazil Biopharmaceutical Cold Chain Transport Revenue (million) Forecast, by Application 2019 & 2032
- Table 15: Argentina Biopharmaceutical Cold Chain Transport Revenue (million) Forecast, by Application 2019 & 2032
- Table 16: Rest of South America Biopharmaceutical Cold Chain Transport Revenue (million) Forecast, by Application 2019 & 2032
- Table 17: Global Biopharmaceutical Cold Chain Transport Revenue million Forecast, by Application 2019 & 2032
- Table 18: Global Biopharmaceutical Cold Chain Transport Revenue million Forecast, by Types 2019 & 2032
- Table 19: Global Biopharmaceutical Cold Chain Transport Revenue million Forecast, by Country 2019 & 2032
- Table 20: United Kingdom Biopharmaceutical Cold Chain Transport Revenue (million) Forecast, by Application 2019 & 2032
- Table 21: Germany Biopharmaceutical Cold Chain Transport Revenue (million) Forecast, by Application 2019 & 2032
- Table 22: France Biopharmaceutical Cold Chain Transport Revenue (million) Forecast, by Application 2019 & 2032
- Table 23: Italy Biopharmaceutical Cold Chain Transport Revenue (million) Forecast, by Application 2019 & 2032
- Table 24: Spain Biopharmaceutical Cold Chain Transport Revenue (million) Forecast, by Application 2019 & 2032
- Table 25: Russia Biopharmaceutical Cold Chain Transport Revenue (million) Forecast, by Application 2019 & 2032
- Table 26: Benelux Biopharmaceutical Cold Chain Transport Revenue (million) Forecast, by Application 2019 & 2032
- Table 27: Nordics Biopharmaceutical Cold Chain Transport Revenue (million) Forecast, by Application 2019 & 2032
- Table 28: Rest of Europe Biopharmaceutical Cold Chain Transport Revenue (million) Forecast, by Application 2019 & 2032
- Table 29: Global Biopharmaceutical Cold Chain Transport Revenue million Forecast, by Application 2019 & 2032
- Table 30: Global Biopharmaceutical Cold Chain Transport Revenue million Forecast, by Types 2019 & 2032
- Table 31: Global Biopharmaceutical Cold Chain Transport Revenue million Forecast, by Country 2019 & 2032
- Table 32: Turkey Biopharmaceutical Cold Chain Transport Revenue (million) Forecast, by Application 2019 & 2032
- Table 33: Israel Biopharmaceutical Cold Chain Transport Revenue (million) Forecast, by Application 2019 & 2032
- Table 34: GCC Biopharmaceutical Cold Chain Transport Revenue (million) Forecast, by Application 2019 & 2032
- Table 35: North Africa Biopharmaceutical Cold Chain Transport Revenue (million) Forecast, by Application 2019 & 2032
- Table 36: South Africa Biopharmaceutical Cold Chain Transport Revenue (million) Forecast, by Application 2019 & 2032
- Table 37: Rest of Middle East & Africa Biopharmaceutical Cold Chain Transport Revenue (million) Forecast, by Application 2019 & 2032
- Table 38: Global Biopharmaceutical Cold Chain Transport Revenue million Forecast, by Application 2019 & 2032
- Table 39: Global Biopharmaceutical Cold Chain Transport Revenue million Forecast, by Types 2019 & 2032
- Table 40: Global Biopharmaceutical Cold Chain Transport Revenue million Forecast, by Country 2019 & 2032
- Table 41: China Biopharmaceutical Cold Chain Transport Revenue (million) Forecast, by Application 2019 & 2032
- Table 42: India Biopharmaceutical Cold Chain Transport Revenue (million) Forecast, by Application 2019 & 2032
- Table 43: Japan Biopharmaceutical Cold Chain Transport Revenue (million) Forecast, by Application 2019 & 2032
- Table 44: South Korea Biopharmaceutical Cold Chain Transport Revenue (million) Forecast, by Application 2019 & 2032
- Table 45: ASEAN Biopharmaceutical Cold Chain Transport Revenue (million) Forecast, by Application 2019 & 2032
- Table 46: Oceania Biopharmaceutical Cold Chain Transport Revenue (million) Forecast, by Application 2019 & 2032
- Table 47: Rest of Asia Pacific Biopharmaceutical Cold Chain Transport Revenue (million) Forecast, by Application 2019 & 2032
Frequently Asked Questions
1. What is the projected Compound Annual Growth Rate (CAGR) of the Biopharmaceutical Cold Chain Transport?
The projected CAGR is approximately XX%.
2. Which companies are prominent players in the Biopharmaceutical Cold Chain Transport?
Key companies in the market include Deutsche Post DHL, Kuehne + Nagel, FedEx, AmerisourceBergen, UPS (Marken), DB Schenker, XPO Logistics, Panalpina, Nippon Express, GEODIS, VersaCold, Agility, DSV, Sinotrans, Kerry Logistics, SF Express, CEVA, CH Robinson, Air Canada Cargo.
3. What are the main segments of the Biopharmaceutical Cold Chain Transport?
The market segments include Application, Types.
4. Can you provide details about the market size?
The market size is estimated to be USD XXX million as of 2022.
5. What are some drivers contributing to market growth?
N/A
6. What are the notable trends driving market growth?
N/A
7. Are there any restraints impacting market growth?
N/A
8. Can you provide examples of recent developments in the market?
N/A
9. What pricing options are available for accessing the report?
Pricing options include single-user, multi-user, and enterprise licenses priced at USD 2900.00, USD 4350.00, and USD 5800.00 respectively.
10. Is the market size provided in terms of value or volume?
The market size is provided in terms of value, measured in million.
11. Are there any specific market keywords associated with the report?
Yes, the market keyword associated with the report is "Biopharmaceutical Cold Chain Transport," which aids in identifying and referencing the specific market segment covered.
12. How do I determine which pricing option suits my needs best?
The pricing options vary based on user requirements and access needs. Individual users may opt for single-user licenses, while businesses requiring broader access may choose multi-user or enterprise licenses for cost-effective access to the report.
13. Are there any additional resources or data provided in the Biopharmaceutical Cold Chain Transport report?
While the report offers comprehensive insights, it's advisable to review the specific contents or supplementary materials provided to ascertain if additional resources or data are available.
14. How can I stay updated on further developments or reports in the Biopharmaceutical Cold Chain Transport?
To stay informed about further developments, trends, and reports in the Biopharmaceutical Cold Chain Transport, consider subscribing to industry newsletters, following relevant companies and organizations, or regularly checking reputable industry news sources and publications.
Methodology
Step 1 - Identification of Relevant Samples Size from Population Database


Step 2 - Approaches for Defining Global Market Size (Value, Volume* & Price*)

Note*: In applicable scenarios
Step 3 - Data Sources
Primary Research
- Web Analytics
- Survey Reports
- Research Institute
- Latest Research Reports
- Opinion Leaders
Secondary Research
- Annual Reports
- White Paper
- Latest Press Release
- Industry Association
- Paid Database
- Investor Presentations

Step 4 - Data Triangulation
Involves using different sources of information in order to increase the validity of a study
These sources are likely to be stakeholders in a program - participants, other researchers, program staff, other community members, and so on.
Then we put all data in single framework & apply various statistical tools to find out the dynamic on the market.
During the analysis stage, feedback from the stakeholder groups would be compared to determine areas of agreement as well as areas of divergence


