

Key Insights
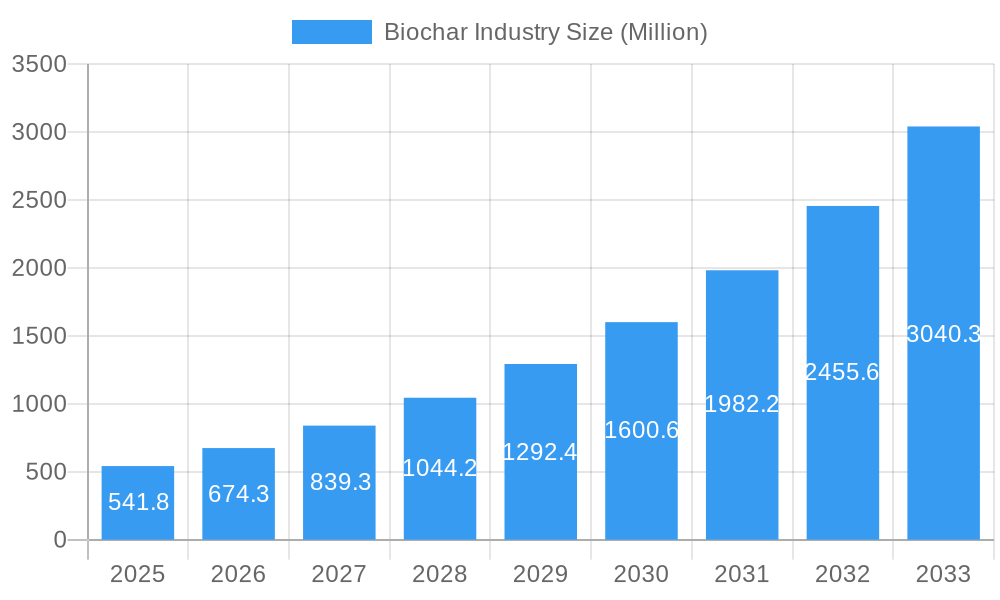
The biochar industry is experiencing robust growth, projected to reach a market size of $541.8 million in 2025 and exhibiting a Compound Annual Growth Rate (CAGR) exceeding 24.50%. This significant expansion is driven by several key factors. Increasing concerns about climate change and the need for sustainable soil management are fueling demand for biochar as a soil amendment, enhancing carbon sequestration and improving soil health. Furthermore, the growing adoption of biochar in diverse applications, including animal farming (improving livestock feed efficiency and reducing methane emissions) and industrial uses (e.g., water purification and bioremediation), is significantly contributing to market growth. Technological advancements in pyrolysis and gasification systems are also playing a crucial role, offering more efficient and cost-effective biochar production methods. However, the market faces certain challenges, including the relatively high initial investment costs associated with biochar production facilities and the need for further research to standardize production processes and quality control measures. Nevertheless, the long-term potential of biochar as a sustainable and versatile material is driving considerable investment and innovation within the industry.
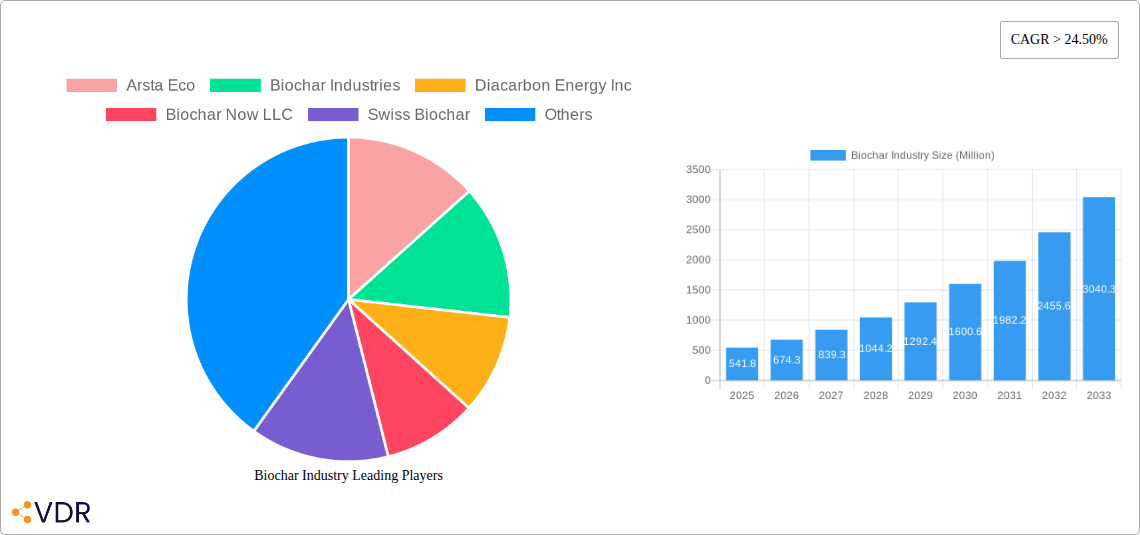
Biochar Industry Market Size (In Million)
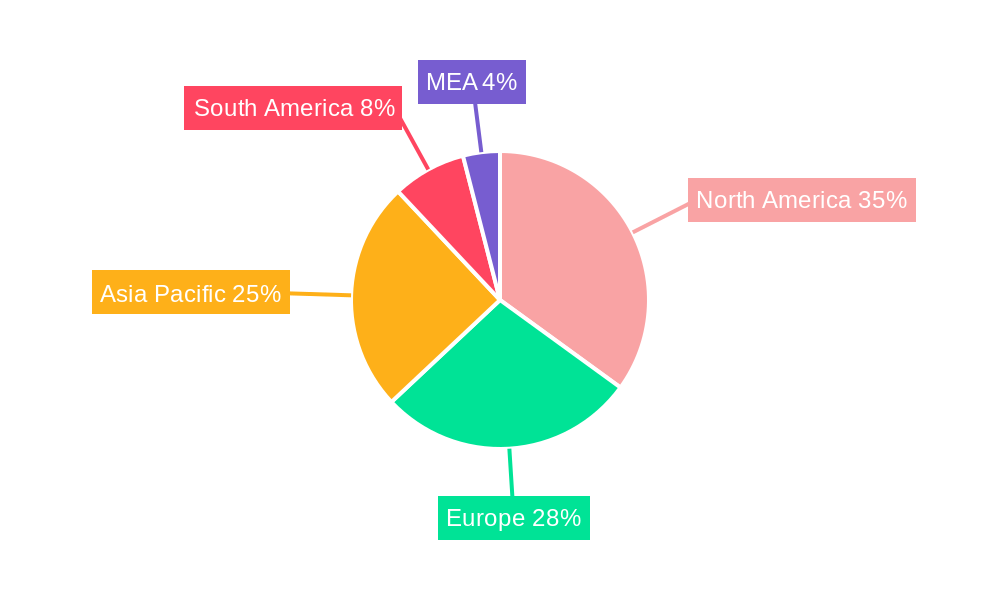
The geographical distribution of the biochar market reveals a strong presence across North America, Europe, and the Asia-Pacific region. North America, particularly the United States, is a major player due to its well-established agricultural sector and strong environmental regulations. Europe follows closely, with significant adoption across various applications driven by supportive government policies and environmental awareness. The Asia-Pacific region, especially China and India, is experiencing rapid growth, driven by increasing agricultural needs and rising industrial applications. While South America and the Middle East & Africa regions represent smaller market shares currently, their potential for future growth is significant, driven by increasing awareness of sustainable agricultural practices and the need for effective waste management solutions. The industry is largely fragmented with a number of companies offering diverse technologies and applications, creating a competitive landscape. Continued research and development, alongside supportive government policies, will be crucial in unlocking the full potential of the biochar market and ensuring its sustainable growth in the coming years.
Biochar Industry Company Market Share
Biochar Industry Market Report: 2019-2033
This comprehensive report provides a detailed analysis of the Biochar Industry, encompassing market dynamics, growth trends, key players, and future outlook. The study period covers 2019-2033, with 2025 as the base and estimated year. This report is crucial for industry professionals, investors, and stakeholders seeking to understand and capitalize on the burgeoning opportunities within this sector. The report forecasts a market valued at XX Million by 2033.
Parent Market: Renewable Energy & Sustainable Materials Child Market: Carbon Sequestration & Soil Amendment
Biochar Industry Market Dynamics & Structure
The global biochar market exhibits a moderately fragmented structure, with several key players vying for market share. Technological innovation, particularly in pyrolysis and gasification systems, is a significant driver of growth. Stringent environmental regulations globally are further bolstering market expansion. However, high initial investment costs for biochar production facilities and the availability of cheaper alternative soil amendments present challenges. Mergers and acquisitions are relatively infrequent, indicating a still-developing market landscape.
- Market Concentration: Moderately Fragmented (HHI xx)
- Technological Innovation: Pyrolysis dominates, with gasification and hydrothermal carbonization showing growth.
- Regulatory Framework: Increasingly supportive of sustainable solutions and carbon sequestration.
- Competitive Substitutes: Compost, peat moss, and other soil amendments.
- End-User Demographics: Primarily agricultural sector, with growing interest from industrial and environmental sectors.
- M&A Trends: Low deal volume to date, but potential for increased consolidation in the forecast period. (xx deals in the last 5 years)
Biochar Industry Growth Trends & Insights
The biochar market has witnessed robust growth since 2019, driven by increasing awareness of its environmental benefits and rising demand from the agricultural sector. Adoption rates are accelerating, particularly in regions with favorable government policies and strong agricultural sectors. Technological advancements, including improved pyrolysis systems and enhanced product applications, are fueling growth. Consumer behavior is shifting towards sustainable and environmentally friendly solutions, creating a positive outlook for biochar adoption. The Compound Annual Growth Rate (CAGR) is estimated to be XX% during the forecast period (2025-2033), with market penetration projected to reach XX% by 2033.
Dominant Regions, Countries, or Segments in Biochar Industry
The agricultural application segment holds the largest market share, driven by the increasing demand for sustainable soil amendment and improved crop yields. Geographically, North America and Europe currently lead the market due to established infrastructure and robust environmental regulations. However, Asia-Pacific is poised for significant growth, particularly in countries with large agricultural sectors and increasing awareness of climate change mitigation strategies. Pyrolysis remains the dominant technology, accounting for approximately XX% of the market share.
- Key Drivers (Agriculture Segment): Increased awareness of soil health benefits, government subsidies, and growing demand for organic farming practices.
- Key Drivers (North America): Strong environmental regulations, technological advancements, and increased investment in sustainable agriculture.
- Dominance Factors: Established infrastructure, high adoption rates, and strong consumer demand.
- Growth Potential: Asia-Pacific shows the highest potential due to large agricultural lands and growing environmental consciousness.
Biochar Industry Product Landscape
Biochar products are increasingly differentiated by their production methods, feedstock sources, and specific applications. Innovations focus on optimizing the properties of biochar for particular uses, such as enhanced nutrient retention or improved water holding capacity. The unique selling proposition lies in its dual role as a soil amendment and a carbon sequestration agent. Technological advancements are continuously improving efficiency and reducing production costs.
Key Drivers, Barriers & Challenges in Biochar Industry
Key Drivers:
- Growing awareness of climate change and carbon sequestration potential.
- Increasing demand for sustainable agriculture and soil health improvement.
- Government incentives and supportive policies promoting biochar adoption.
Key Challenges:
- High initial investment costs for biochar production facilities.
- The need for standardization of biochar production and quality control.
- Competition from established and cheaper soil amendments.
- Supply chain limitations in securing consistent feedstock. (estimated impact: xx million reduction in production capacity)
Emerging Opportunities in Biochar Industry
- Expanding into untapped markets, such as water filtration and industrial applications.
- Developing innovative biochar-based products, such as biochar-enhanced fertilizers and construction materials.
- Leveraging advancements in biotechnology to enhance biochar production efficiency.
Growth Accelerators in the Biochar Industry
Technological breakthroughs, particularly in low-cost and high-efficiency biochar production technologies, will accelerate market growth. Strategic partnerships between biochar producers, agricultural companies, and technology providers will foster innovation and scale-up. Expansion into new markets and applications will drive further growth.
Key Players Shaping the Biochar Industry Market
- Arsta Eco
- Biochar Industries
- Diacarbon Energy Inc
- Biochar Now LLC
- Swiss Biochar
- PyroCore
- Sunriver Biochar
- Airex Energy
- Phoenix Energy
- Karr Group
- Wonjin Group
- Carbon Gold Ltd
- Biochar Supreme
- BIOSORRA
- Pyreg GmbH
Notable Milestones in Biochar Industry Sector
- November 2023: BIOSORRA launched a biochar production plant in Kenya, supplying the Kenya Nut Company.
- November 2023: Pyreg GmbH launched Biochar Carbon Removal (BCR) via its carbonization systems, focusing on agriculture.
- June 2022: Airex Energy joined the BDO Zone Strategic Alliance, fostering biobased project development.
In-Depth Biochar Industry Market Outlook
The biochar market is poised for significant growth, driven by increasing environmental concerns, advancements in technology, and supportive government policies. Strategic partnerships and expansion into new applications will further enhance its market potential. The market presents attractive opportunities for investors and businesses seeking to capitalize on the global demand for sustainable and environmentally friendly solutions.
Biochar Industry Segmentation
-
1. Technology
- 1.1. Pyrolysis
- 1.2. Gasification Systems
- 1.3. Other Technologies (Hydrothermal Carbonization)
-
2. Application
- 2.1. Agriculture
- 2.2. Animal Farming
- 2.3. Industrial Uses
- 2.4. Other Applications (Environmental Remediation)
Biochar Industry Segmentation By Geography
-
1. Asia Pacific
- 1.1. China
- 1.2. Australia
- 1.3. South Korea
- 1.4. Rest of Asia Pacific
-
2. North America
- 2.1. United States
- 2.2. Canada
-
3. Europe
- 3.1. Germany
- 3.2. Sweden
- 3.3. Austria
- 3.4. Switzerland
- 3.5. United Kingdom
- 3.6. Rest of Europe
- 4. Rest of the World
Biochar Industry Regional Market Share
Geographic Coverage of Biochar Industry
Biochar Industry REPORT HIGHLIGHTS
| Aspects | Details |
|---|---|
| Study Period | 2020-2034 |
| Base Year | 2025 |
| Estimated Year | 2026 |
| Forecast Period | 2026-2034 |
| Historical Period | 2020-2025 |
| Growth Rate | CAGR of > 24.50% from 2020-2034 |
| Segmentation |
|
Table of Contents
- 1. Introduction
- 1.1. Research Scope
- 1.2. Market Segmentation
- 1.3. Research Objective
- 1.4. Definitions and Assumptions
- 2. Executive Summary
- 2.1. Market Snapshot
- 3. Market Dynamics
- 3.1. Market Drivers
- 3.2. Market Restrains
- 3.3. Market Trends
- 3.4. Market Opportunities
- 4. Market Factor Analysis
- 4.1. Porters Five Forces
- 4.1.1. Bargaining Power of Suppliers
- 4.1.2. Bargaining Power of Buyers
- 4.1.3. Threat of New Entrants
- 4.1.4. Threat of Substitutes
- 4.1.5. Competitive Rivalry
- 4.2. PESTEL analysis
- 4.3. BCG Analysis
- 4.3.1. Stars (High Growth, High Market Share)
- 4.3.2. Cash Cows (Low Growth, High Market Share)
- 4.3.3. Question Mark (High Growth, Low Market Share)
- 4.3.4. Dogs (Low Growth, Low Market Share)
- 4.4. Ansoff Matrix Analysis
- 4.5. Supply Chain Analysis
- 4.6. Regulatory Landscape
- 4.7. Current Market Potential and Opportunity Assessment (TAM–SAM–SOM Framework)
- 4.8. VDR Analyst Note
- 4.1. Porters Five Forces
- 5. Market Analysis, Insights and Forecast 2021-2033
- 5.1. Market Analysis, Insights and Forecast - by Technology
- 5.1.1. Pyrolysis
- 5.1.2. Gasification Systems
- 5.1.3. Other Technologies (Hydrothermal Carbonization)
- 5.2. Market Analysis, Insights and Forecast - by Application
- 5.2.1. Agriculture
- 5.2.2. Animal Farming
- 5.2.3. Industrial Uses
- 5.2.4. Other Applications (Environmental Remediation)
- 5.3. Market Analysis, Insights and Forecast - by Region
- 5.3.1. Asia Pacific
- 5.3.2. North America
- 5.3.3. Europe
- 5.3.4. Rest of the World
- 5.1. Market Analysis, Insights and Forecast - by Technology
- 6. Global Biochar Industry Analysis, Insights and Forecast, 2021-2033
- 6.1. Market Analysis, Insights and Forecast - by Technology
- 6.1.1. Pyrolysis
- 6.1.2. Gasification Systems
- 6.1.3. Other Technologies (Hydrothermal Carbonization)
- 6.2. Market Analysis, Insights and Forecast - by Application
- 6.2.1. Agriculture
- 6.2.2. Animal Farming
- 6.2.3. Industrial Uses
- 6.2.4. Other Applications (Environmental Remediation)
- 6.1. Market Analysis, Insights and Forecast - by Technology
- 7. Asia Pacific Biochar Industry Analysis, Insights and Forecast, 2021-2033
- 7.1. Market Analysis, Insights and Forecast - by Technology
- 7.1.1. Pyrolysis
- 7.1.2. Gasification Systems
- 7.1.3. Other Technologies (Hydrothermal Carbonization)
- 7.2. Market Analysis, Insights and Forecast - by Application
- 7.2.1. Agriculture
- 7.2.2. Animal Farming
- 7.2.3. Industrial Uses
- 7.2.4. Other Applications (Environmental Remediation)
- 7.1. Market Analysis, Insights and Forecast - by Technology
- 8. North America Biochar Industry Analysis, Insights and Forecast, 2021-2033
- 8.1. Market Analysis, Insights and Forecast - by Technology
- 8.1.1. Pyrolysis
- 8.1.2. Gasification Systems
- 8.1.3. Other Technologies (Hydrothermal Carbonization)
- 8.2. Market Analysis, Insights and Forecast - by Application
- 8.2.1. Agriculture
- 8.2.2. Animal Farming
- 8.2.3. Industrial Uses
- 8.2.4. Other Applications (Environmental Remediation)
- 8.1. Market Analysis, Insights and Forecast - by Technology
- 9. Europe Biochar Industry Analysis, Insights and Forecast, 2021-2033
- 9.1. Market Analysis, Insights and Forecast - by Technology
- 9.1.1. Pyrolysis
- 9.1.2. Gasification Systems
- 9.1.3. Other Technologies (Hydrothermal Carbonization)
- 9.2. Market Analysis, Insights and Forecast - by Application
- 9.2.1. Agriculture
- 9.2.2. Animal Farming
- 9.2.3. Industrial Uses
- 9.2.4. Other Applications (Environmental Remediation)
- 9.1. Market Analysis, Insights and Forecast - by Technology
- 10. Rest of the World Biochar Industry Analysis, Insights and Forecast, 2021-2033
- 10.1. Market Analysis, Insights and Forecast - by Technology
- 10.1.1. Pyrolysis
- 10.1.2. Gasification Systems
- 10.1.3. Other Technologies (Hydrothermal Carbonization)
- 10.2. Market Analysis, Insights and Forecast - by Application
- 10.2.1. Agriculture
- 10.2.2. Animal Farming
- 10.2.3. Industrial Uses
- 10.2.4. Other Applications (Environmental Remediation)
- 10.1. Market Analysis, Insights and Forecast - by Technology
- 11. Competitive Analysis
- 11.1. Company Profiles
- 11.1.1 Arsta Eco
- 11.1.1.1. Company Overview
- 11.1.1.2. Products
- 11.1.1.3. Company Financials
- 11.1.1.4. SWOT Analysis
- 11.1.2 Biochar Industries
- 11.1.2.1. Company Overview
- 11.1.2.2. Products
- 11.1.2.3. Company Financials
- 11.1.2.4. SWOT Analysis
- 11.1.3 Diacarbon Energy Inc
- 11.1.3.1. Company Overview
- 11.1.3.2. Products
- 11.1.3.3. Company Financials
- 11.1.3.4. SWOT Analysis
- 11.1.4 Biochar Now LLC
- 11.1.4.1. Company Overview
- 11.1.4.2. Products
- 11.1.4.3. Company Financials
- 11.1.4.4. SWOT Analysis
- 11.1.5 Swiss Biochar
- 11.1.5.1. Company Overview
- 11.1.5.2. Products
- 11.1.5.3. Company Financials
- 11.1.5.4. SWOT Analysis
- 11.1.6 PyroCore
- 11.1.6.1. Company Overview
- 11.1.6.2. Products
- 11.1.6.3. Company Financials
- 11.1.6.4. SWOT Analysis
- 11.1.7 Sunriver Biochar
- 11.1.7.1. Company Overview
- 11.1.7.2. Products
- 11.1.7.3. Company Financials
- 11.1.7.4. SWOT Analysis
- 11.1.8 Airex Energy
- 11.1.8.1. Company Overview
- 11.1.8.2. Products
- 11.1.8.3. Company Financials
- 11.1.8.4. SWOT Analysis
- 11.1.9 Phoenix Energy
- 11.1.9.1. Company Overview
- 11.1.9.2. Products
- 11.1.9.3. Company Financials
- 11.1.9.4. SWOT Analysis
- 11.1.10 Karr Group
- 11.1.10.1. Company Overview
- 11.1.10.2. Products
- 11.1.10.3. Company Financials
- 11.1.10.4. SWOT Analysis
- 11.1.11 Wonjin Group*List Not Exhaustive
- 11.1.11.1. Company Overview
- 11.1.11.2. Products
- 11.1.11.3. Company Financials
- 11.1.11.4. SWOT Analysis
- 11.1.12 Carbon Gold Ltd
- 11.1.12.1. Company Overview
- 11.1.12.2. Products
- 11.1.12.3. Company Financials
- 11.1.12.4. SWOT Analysis
- 11.1.13 Biochar Supreme
- 11.1.13.1. Company Overview
- 11.1.13.2. Products
- 11.1.13.3. Company Financials
- 11.1.13.4. SWOT Analysis
- 11.1.14 BIOSORRA
- 11.1.14.1. Company Overview
- 11.1.14.2. Products
- 11.1.14.3. Company Financials
- 11.1.14.4. SWOT Analysis
- 11.1.15 Pyreg GmbH
- 11.1.15.1. Company Overview
- 11.1.15.2. Products
- 11.1.15.3. Company Financials
- 11.1.15.4. SWOT Analysis
- 11.1.1 Arsta Eco
- 11.2. Market Entropy
- 11.2.1 Company's Key Areas Served
- 11.2.2 Recent Developments
- 11.3. Company Market Share Analysis 2025
- 11.3.1 Top 5 Companies Market Share Analysis
- 11.3.2 Top 3 Companies Market Share Analysis
- 11.4. List of Potential Customers
- 12. Research Methodology
List of Figures
- Figure 1: Global Biochar Industry Revenue Breakdown (Million, %) by Region 2025 & 2033
- Figure 2: Global Biochar Industry Volume Breakdown (K Tons, %) by Region 2025 & 2033
- Figure 3: Asia Pacific Biochar Industry Revenue (Million), by Technology 2025 & 2033
- Figure 4: Asia Pacific Biochar Industry Volume (K Tons), by Technology 2025 & 2033
- Figure 5: Asia Pacific Biochar Industry Revenue Share (%), by Technology 2025 & 2033
- Figure 6: Asia Pacific Biochar Industry Volume Share (%), by Technology 2025 & 2033
- Figure 7: Asia Pacific Biochar Industry Revenue (Million), by Application 2025 & 2033
- Figure 8: Asia Pacific Biochar Industry Volume (K Tons), by Application 2025 & 2033
- Figure 9: Asia Pacific Biochar Industry Revenue Share (%), by Application 2025 & 2033
- Figure 10: Asia Pacific Biochar Industry Volume Share (%), by Application 2025 & 2033
- Figure 11: Asia Pacific Biochar Industry Revenue (Million), by Country 2025 & 2033
- Figure 12: Asia Pacific Biochar Industry Volume (K Tons), by Country 2025 & 2033
- Figure 13: Asia Pacific Biochar Industry Revenue Share (%), by Country 2025 & 2033
- Figure 14: Asia Pacific Biochar Industry Volume Share (%), by Country 2025 & 2033
- Figure 15: North America Biochar Industry Revenue (Million), by Technology 2025 & 2033
- Figure 16: North America Biochar Industry Volume (K Tons), by Technology 2025 & 2033
- Figure 17: North America Biochar Industry Revenue Share (%), by Technology 2025 & 2033
- Figure 18: North America Biochar Industry Volume Share (%), by Technology 2025 & 2033
- Figure 19: North America Biochar Industry Revenue (Million), by Application 2025 & 2033
- Figure 20: North America Biochar Industry Volume (K Tons), by Application 2025 & 2033
- Figure 21: North America Biochar Industry Revenue Share (%), by Application 2025 & 2033
- Figure 22: North America Biochar Industry Volume Share (%), by Application 2025 & 2033
- Figure 23: North America Biochar Industry Revenue (Million), by Country 2025 & 2033
- Figure 24: North America Biochar Industry Volume (K Tons), by Country 2025 & 2033
- Figure 25: North America Biochar Industry Revenue Share (%), by Country 2025 & 2033
- Figure 26: North America Biochar Industry Volume Share (%), by Country 2025 & 2033
- Figure 27: Europe Biochar Industry Revenue (Million), by Technology 2025 & 2033
- Figure 28: Europe Biochar Industry Volume (K Tons), by Technology 2025 & 2033
- Figure 29: Europe Biochar Industry Revenue Share (%), by Technology 2025 & 2033
- Figure 30: Europe Biochar Industry Volume Share (%), by Technology 2025 & 2033
- Figure 31: Europe Biochar Industry Revenue (Million), by Application 2025 & 2033
- Figure 32: Europe Biochar Industry Volume (K Tons), by Application 2025 & 2033
- Figure 33: Europe Biochar Industry Revenue Share (%), by Application 2025 & 2033
- Figure 34: Europe Biochar Industry Volume Share (%), by Application 2025 & 2033
- Figure 35: Europe Biochar Industry Revenue (Million), by Country 2025 & 2033
- Figure 36: Europe Biochar Industry Volume (K Tons), by Country 2025 & 2033
- Figure 37: Europe Biochar Industry Revenue Share (%), by Country 2025 & 2033
- Figure 38: Europe Biochar Industry Volume Share (%), by Country 2025 & 2033
- Figure 39: Rest of the World Biochar Industry Revenue (Million), by Technology 2025 & 2033
- Figure 40: Rest of the World Biochar Industry Volume (K Tons), by Technology 2025 & 2033
- Figure 41: Rest of the World Biochar Industry Revenue Share (%), by Technology 2025 & 2033
- Figure 42: Rest of the World Biochar Industry Volume Share (%), by Technology 2025 & 2033
- Figure 43: Rest of the World Biochar Industry Revenue (Million), by Application 2025 & 2033
- Figure 44: Rest of the World Biochar Industry Volume (K Tons), by Application 2025 & 2033
- Figure 45: Rest of the World Biochar Industry Revenue Share (%), by Application 2025 & 2033
- Figure 46: Rest of the World Biochar Industry Volume Share (%), by Application 2025 & 2033
- Figure 47: Rest of the World Biochar Industry Revenue (Million), by Country 2025 & 2033
- Figure 48: Rest of the World Biochar Industry Volume (K Tons), by Country 2025 & 2033
- Figure 49: Rest of the World Biochar Industry Revenue Share (%), by Country 2025 & 2033
- Figure 50: Rest of the World Biochar Industry Volume Share (%), by Country 2025 & 2033
List of Tables
- Table 1: Global Biochar Industry Revenue Million Forecast, by Technology 2020 & 2033
- Table 2: Global Biochar Industry Volume K Tons Forecast, by Technology 2020 & 2033
- Table 3: Global Biochar Industry Revenue Million Forecast, by Application 2020 & 2033
- Table 4: Global Biochar Industry Volume K Tons Forecast, by Application 2020 & 2033
- Table 5: Global Biochar Industry Revenue Million Forecast, by Region 2020 & 2033
- Table 6: Global Biochar Industry Volume K Tons Forecast, by Region 2020 & 2033
- Table 7: Global Biochar Industry Revenue Million Forecast, by Technology 2020 & 2033
- Table 8: Global Biochar Industry Volume K Tons Forecast, by Technology 2020 & 2033
- Table 9: Global Biochar Industry Revenue Million Forecast, by Application 2020 & 2033
- Table 10: Global Biochar Industry Volume K Tons Forecast, by Application 2020 & 2033
- Table 11: Global Biochar Industry Revenue Million Forecast, by Country 2020 & 2033
- Table 12: Global Biochar Industry Volume K Tons Forecast, by Country 2020 & 2033
- Table 13: China Biochar Industry Revenue (Million) Forecast, by Application 2020 & 2033
- Table 14: China Biochar Industry Volume (K Tons) Forecast, by Application 2020 & 2033
- Table 15: Australia Biochar Industry Revenue (Million) Forecast, by Application 2020 & 2033
- Table 16: Australia Biochar Industry Volume (K Tons) Forecast, by Application 2020 & 2033
- Table 17: South Korea Biochar Industry Revenue (Million) Forecast, by Application 2020 & 2033
- Table 18: South Korea Biochar Industry Volume (K Tons) Forecast, by Application 2020 & 2033
- Table 19: Rest of Asia Pacific Biochar Industry Revenue (Million) Forecast, by Application 2020 & 2033
- Table 20: Rest of Asia Pacific Biochar Industry Volume (K Tons) Forecast, by Application 2020 & 2033
- Table 21: Global Biochar Industry Revenue Million Forecast, by Technology 2020 & 2033
- Table 22: Global Biochar Industry Volume K Tons Forecast, by Technology 2020 & 2033
- Table 23: Global Biochar Industry Revenue Million Forecast, by Application 2020 & 2033
- Table 24: Global Biochar Industry Volume K Tons Forecast, by Application 2020 & 2033
- Table 25: Global Biochar Industry Revenue Million Forecast, by Country 2020 & 2033
- Table 26: Global Biochar Industry Volume K Tons Forecast, by Country 2020 & 2033
- Table 27: United States Biochar Industry Revenue (Million) Forecast, by Application 2020 & 2033
- Table 28: United States Biochar Industry Volume (K Tons) Forecast, by Application 2020 & 2033
- Table 29: Canada Biochar Industry Revenue (Million) Forecast, by Application 2020 & 2033
- Table 30: Canada Biochar Industry Volume (K Tons) Forecast, by Application 2020 & 2033
- Table 31: Global Biochar Industry Revenue Million Forecast, by Technology 2020 & 2033
- Table 32: Global Biochar Industry Volume K Tons Forecast, by Technology 2020 & 2033
- Table 33: Global Biochar Industry Revenue Million Forecast, by Application 2020 & 2033
- Table 34: Global Biochar Industry Volume K Tons Forecast, by Application 2020 & 2033
- Table 35: Global Biochar Industry Revenue Million Forecast, by Country 2020 & 2033
- Table 36: Global Biochar Industry Volume K Tons Forecast, by Country 2020 & 2033
- Table 37: Germany Biochar Industry Revenue (Million) Forecast, by Application 2020 & 2033
- Table 38: Germany Biochar Industry Volume (K Tons) Forecast, by Application 2020 & 2033
- Table 39: Sweden Biochar Industry Revenue (Million) Forecast, by Application 2020 & 2033
- Table 40: Sweden Biochar Industry Volume (K Tons) Forecast, by Application 2020 & 2033
- Table 41: Austria Biochar Industry Revenue (Million) Forecast, by Application 2020 & 2033
- Table 42: Austria Biochar Industry Volume (K Tons) Forecast, by Application 2020 & 2033
- Table 43: Switzerland Biochar Industry Revenue (Million) Forecast, by Application 2020 & 2033
- Table 44: Switzerland Biochar Industry Volume (K Tons) Forecast, by Application 2020 & 2033
- Table 45: United Kingdom Biochar Industry Revenue (Million) Forecast, by Application 2020 & 2033
- Table 46: United Kingdom Biochar Industry Volume (K Tons) Forecast, by Application 2020 & 2033
- Table 47: Rest of Europe Biochar Industry Revenue (Million) Forecast, by Application 2020 & 2033
- Table 48: Rest of Europe Biochar Industry Volume (K Tons) Forecast, by Application 2020 & 2033
- Table 49: Global Biochar Industry Revenue Million Forecast, by Technology 2020 & 2033
- Table 50: Global Biochar Industry Volume K Tons Forecast, by Technology 2020 & 2033
- Table 51: Global Biochar Industry Revenue Million Forecast, by Application 2020 & 2033
- Table 52: Global Biochar Industry Volume K Tons Forecast, by Application 2020 & 2033
- Table 53: Global Biochar Industry Revenue Million Forecast, by Country 2020 & 2033
- Table 54: Global Biochar Industry Volume K Tons Forecast, by Country 2020 & 2033
Frequently Asked Questions
1. What is the projected Compound Annual Growth Rate (CAGR) of the Biochar Industry?
The projected CAGR is approximately > 24.50%.
2. Which companies are prominent players in the Biochar Industry?
Key companies in the market include Arsta Eco, Biochar Industries, Diacarbon Energy Inc, Biochar Now LLC, Swiss Biochar, PyroCore, Sunriver Biochar, Airex Energy, Phoenix Energy, Karr Group, Wonjin Group*List Not Exhaustive, Carbon Gold Ltd, Biochar Supreme, BIOSORRA, Pyreg GmbH.
3. What are the main segments of the Biochar Industry?
The market segments include Technology, Application.
4. Can you provide details about the market size?
The market size is estimated to be USD 541.8 Million as of 2022.
5. What are some drivers contributing to market growth?
Increasing Applications for Plant Growth and Development; Growing Demand for Organic Foods in Developing Countries.
6. What are the notable trends driving market growth?
Agriculture Segment to Dominate the Market.
7. Are there any restraints impacting market growth?
High Production Costs; Competition from Alternative Products.
8. Can you provide examples of recent developments in the market?
November 2023: BIOSORRA launched a production plant for biochar in East Africa at Thika in Kiambu County, Kenya. This biochar would be provided to Kenya Nut Company, a multinational agribusiness company involved in growing a wide range of products.
9. What pricing options are available for accessing the report?
Pricing options include single-user, multi-user, and enterprise licenses priced at USD 4750, USD 5250, and USD 8750 respectively.
10. Is the market size provided in terms of value or volume?
The market size is provided in terms of value, measured in Million and volume, measured in K Tons.
11. Are there any specific market keywords associated with the report?
Yes, the market keyword associated with the report is "Biochar Industry," which aids in identifying and referencing the specific market segment covered.
12. How do I determine which pricing option suits my needs best?
The pricing options vary based on user requirements and access needs. Individual users may opt for single-user licenses, while businesses requiring broader access may choose multi-user or enterprise licenses for cost-effective access to the report.
13. Are there any additional resources or data provided in the Biochar Industry report?
While the report offers comprehensive insights, it's advisable to review the specific contents or supplementary materials provided to ascertain if additional resources or data are available.
14. How can I stay updated on further developments or reports in the Biochar Industry?
To stay informed about further developments, trends, and reports in the Biochar Industry, consider subscribing to industry newsletters, following relevant companies and organizations, or regularly checking reputable industry news sources and publications.
Methodology
Step 1 - Identification of Relevant Samples Size from Population Database


Step 2 - Approaches for Defining Global Market Size (Value, Volume* & Price*)

Note*: In applicable scenarios
Step 3 - Data Sources
Primary Research
- Web Analytics
- Survey Reports
- Research Institute
- Latest Research Reports
- Opinion Leaders
Secondary Research
- Annual Reports
- White Paper
- Latest Press Release
- Industry Association
- Paid Database
- Investor Presentations

Step 4 - Data Triangulation
Involves using different sources of information in order to increase the validity of a study
These sources are likely to be stakeholders in a program - participants, other researchers, program staff, other community members, and so on.
Then we put all data in single framework & apply various statistical tools to find out the dynamic on the market.
During the analysis stage, feedback from the stakeholder groups would be compared to determine areas of agreement as well as areas of divergence