

Key Insights
The bio-ketones market is poised for significant expansion, driven by the escalating demand for sustainable and eco-friendly alternatives to conventional ketone production. This dynamic sector is projected to achieve a Compound Annual Growth Rate (CAGR) of 5.9%, reaching a market size of 24.25 billion by 2025. Key growth catalysts include the rising adoption of ketogenic diets, increased consumer awareness of the health advantages of ketones, and a broader industry shift towards bio-based products. Innovations in biotechnology and fermentation are enhancing the efficiency and cost-effectiveness of bio-ketone production. Applications span food and beverages, dietary supplements, cosmetics, and pharmaceuticals. Leading companies like Bio Brands LLC, Caldic B.V., and Eastman Chemical Company are instrumental in market development through ongoing innovation and strategic expansion.
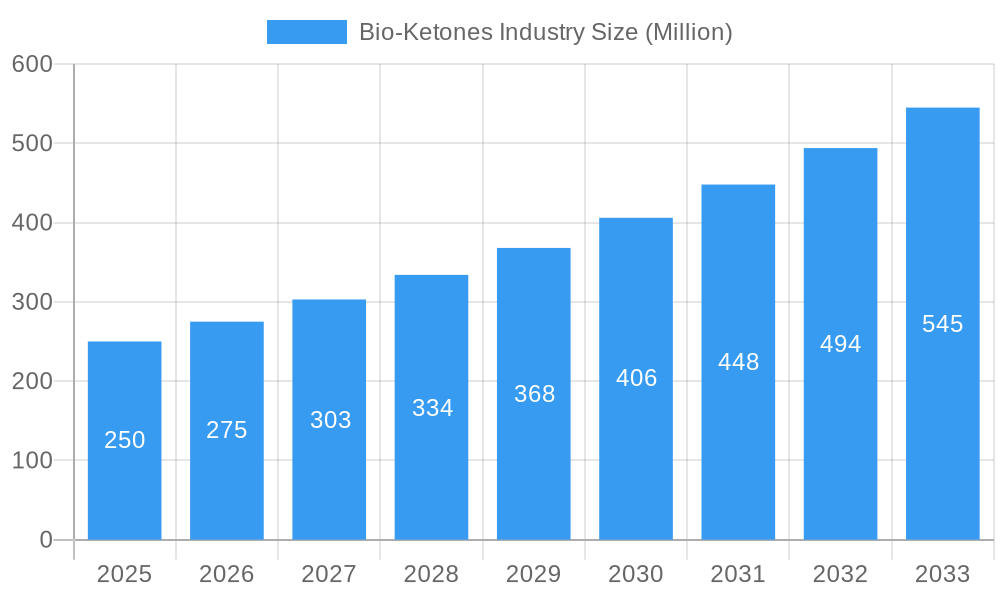
Bio-Ketones Industry Market Size (In Billion)
The forecast period (2025-2033) anticipates sustained market growth, underpinned by ongoing technological advancements and evolving consumer preferences. Companies are actively investing in research and development to uncover novel applications and optimize production efficiencies. Regional market dominance may initially favor North America and Europe due to advanced infrastructure and established consumer awareness, with other regions expected to exhibit substantial growth. Strategic investments in research & development, sustainability, and robust supply chain management will be crucial for competitive advantage. The long-term outlook for the bio-ketones market is highly promising, signaling considerable opportunities for innovation and growth.
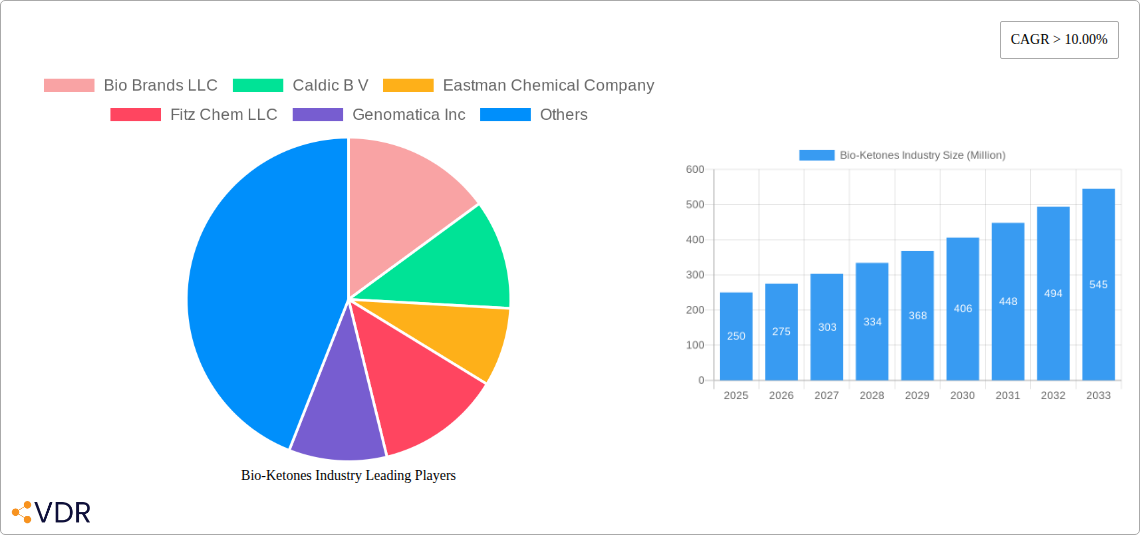
Bio-Ketones Industry Company Market Share
Bio-Ketones Industry Market Report: 2019-2033
This comprehensive report provides a detailed analysis of the Bio-Ketones industry, encompassing market dynamics, growth trends, regional segmentation, competitive landscape, and future outlook. The study period spans from 2019 to 2033, with 2025 serving as the base and estimated year. The report leverages extensive primary and secondary research to deliver actionable insights for industry professionals, investors, and stakeholders. The parent market is the broader biochemicals industry, while the child market focuses specifically on bio-based ketone production and applications. The market size is presented in million units ($M).
Bio-Ketones Industry Market Dynamics & Structure
The Bio-Ketones market exhibits a moderately concentrated structure, with key players like Eastman Chemical Company, Merck KGaA, Genomatica Inc, and Bio Brands LLC holding significant market share (estimated at xx% collectively in 2025). Technological innovation, particularly in fermentation and enzymatic processes, is a primary growth driver. Stringent regulatory frameworks concerning bio-based product approvals and sustainability certifications influence market dynamics. Competitive pressure from chemically synthesized ketones acts as a substitution threat. End-user demographics are diverse, encompassing food & beverage, pharmaceuticals, cosmetics, and industrial applications. M&A activity has been moderate (xx deals in the historical period), primarily focusing on strengthening supply chains and expanding product portfolios.
- Market Concentration: Moderately Concentrated (xx% top 5 players in 2025)
- Technological Innovation: Fermentation, enzymatic synthesis, process optimization.
- Regulatory Landscape: Stringent regulations on bio-based products and sustainability claims.
- Competitive Substitutes: Chemically synthesized ketones.
- End-User Demographics: Food & beverage, pharmaceuticals, cosmetics, industrial chemicals.
- M&A Activity: xx deals (2019-2024), focused on supply chain integration and product diversification.
- Innovation Barriers: High R&D costs, scaling-up challenges, regulatory hurdles.
Bio-Ketones Industry Growth Trends & Insights
The Bio-Ketones market is experiencing robust growth, driven by increasing demand for sustainable alternatives to petroleum-based chemicals and growing consumer preference for natural and bio-based products. The market size expanded from xx $M in 2019 to an estimated xx $M in 2025, exhibiting a CAGR of xx% during the historical period. Adoption rates are increasing across various applications, particularly in the food and beverage sector, fueled by rising health consciousness and the perception of bio-ketones as clean-label ingredients. Technological disruptions, such as advancements in metabolic engineering and process intensification, are further accelerating market expansion. Consumer behavior is shifting towards sustainable and eco-friendly products, creating significant opportunities for bio-ketones. Market penetration is expected to reach xx% by 2033.
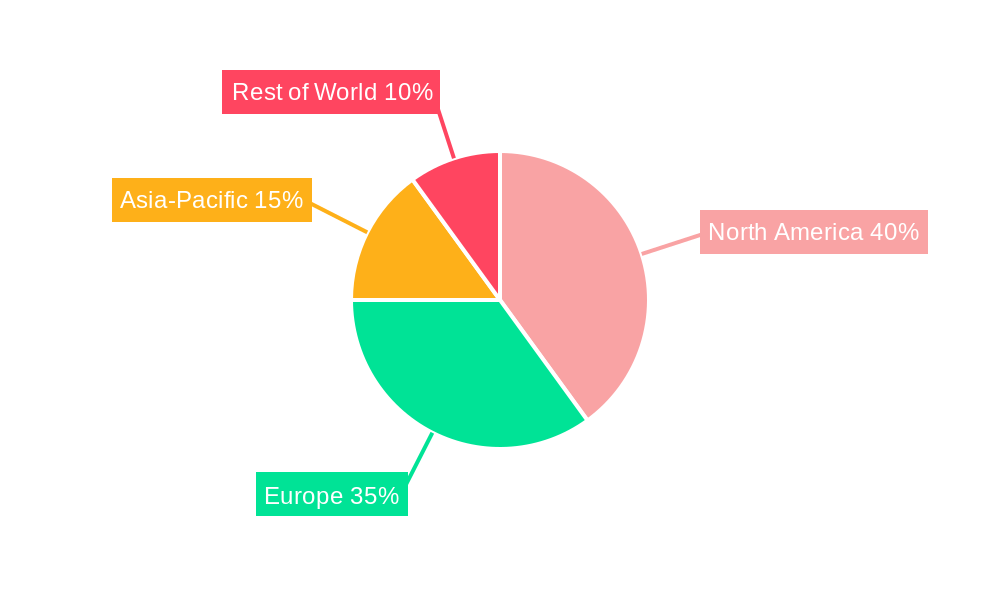
Dominant Regions, Countries, or Segments in Bio-Ketones Industry
North America currently dominates the Bio-Ketones market, driven by strong R&D investments, supportive government policies promoting bio-based products, and a well-established infrastructure for bio-manufacturing. Europe follows as a significant market, propelled by increasing environmental consciousness and stringent regulations favoring sustainable alternatives. Asia-Pacific is expected to exhibit the highest growth potential in the forecast period (2025-2033) driven by increasing industrialization, rising disposable incomes, and expanding food and beverage sectors.
- North America: Strong R&D, supportive government policies, well-established bio-manufacturing infrastructure.
- Europe: High environmental awareness, stringent regulations promoting sustainable alternatives.
- Asia-Pacific: Rapid industrialization, rising disposable incomes, expanding food and beverage sector.
- Market Share (2025): North America (xx%), Europe (xx%), Asia-Pacific (xx%), Rest of World (xx%).
- Growth Potential (2025-2033): Asia-Pacific (highest CAGR).
Bio-Ketones Industry Product Landscape
Bio-ketones encompass a range of products, including acetoacetate, β-hydroxybutyrate, and acetone, each possessing unique applications and performance characteristics. Recent product innovations focus on enhanced purity, improved yield, and customized functionalities tailored to specific applications. Technological advancements are enabling the production of bio-ketones with superior properties compared to their chemically synthesized counterparts, providing a compelling value proposition to consumers.
Key Drivers, Barriers & Challenges in Bio-Ketones Industry
Key Drivers: Growing demand for sustainable and bio-based products, increasing health consciousness, technological advancements in bio-manufacturing, supportive government policies and incentives.
Challenges: High production costs compared to chemically synthesized ketones, scalability challenges, competition from established chemical players, regulatory hurdles in some regions, and potential supply chain disruptions related to raw material availability. Quantifiable impact of challenges is estimated to decrease the overall market growth by xx% by 2033.
Emerging Opportunities in Bio-Ketones Industry
Untapped markets exist in emerging economies, particularly in Asia-Pacific and Latin America, where the demand for bio-based products is growing rapidly. Innovative applications are emerging in areas such as pharmaceuticals (drug delivery systems), cosmetics (skincare products), and industrial chemicals (solvents, biofuels). Evolving consumer preferences towards natural and sustainable products present significant growth opportunities.
Growth Accelerators in the Bio-Ketones Industry
Technological breakthroughs in metabolic engineering and fermentation technologies are crucial growth accelerators. Strategic partnerships between bio-technology companies, chemical manufacturers, and end-users are vital to drive market penetration. Market expansion strategies targeting new applications and geographical regions are equally significant.
Key Players Shaping the Bio-Ketones Industry Market
- Bio Brands LLC
- Caldic B V
- Eastman Chemical Company
- Fitz Chem LLC
- Genomatica Inc
- Green Biologics Limited
- LANZATECH
- Merck KGaA
- List Not Exhaustive
Notable Milestones in Bio-Ketones Industry Sector
- 2021 Q3: Genomatica announced a significant expansion of its bio-based ketone production capacity.
- 2022 Q1: Eastman Chemical Company launched a new line of bio-ketone-based ingredients for the cosmetic industry.
- 2023 Q2: A major strategic partnership was formed between Bio Brands LLC and a leading food and beverage company to develop new bio-ketone-based products. (Specific details dependent on actual event)
In-Depth Bio-Ketones Industry Market Outlook
The Bio-Ketones market is poised for sustained growth throughout the forecast period (2025-2033), driven by technological advancements, expanding applications, and increasing consumer demand for sustainable products. Strategic investments in R&D, efficient manufacturing processes, and strategic partnerships will be crucial for companies to capitalize on emerging opportunities and maintain a competitive edge in this dynamic market. The market is projected to reach xx $M by 2033, presenting significant potential for both established players and new entrants.
Bio-Ketones Industry Segmentation
-
1. Product Type
- 1.1. Bio MEK
- 1.2. Bio PEEK
- 1.3. Bio Acetone
- 1.4. Other Product Types
-
2. End-user Industry
- 2.1. Paints and Coatings
- 2.2. Automobile
- 2.3. Infrastructure
- 2.4. Pharmaceutical
- 2.5. Other End-user Industries
Bio-Ketones Industry Segmentation By Geography
-
1. Asia Pacific
- 1.1. China
- 1.2. India
- 1.3. Japan
- 1.4. South Korea
- 1.5. ASEAN Countries
- 1.6. Rest of Asia Pacific
-
2. North America
- 2.1. United States
- 2.2. Canada
- 2.3. Mexico
-
3. Europe
- 3.1. Germany
- 3.2. United Kingdom
- 3.3. Italy
- 3.4. France
- 3.5. Rest of Europe
-
4. South America
- 4.1. Brazil
- 4.2. Argentina
- 4.3. Rest of South America
-
5. Middle East and Africa
- 5.1. Saudi Arabia
- 5.2. South Africa
- 5.3. Rest of Middle East and Africa
Bio-Ketones Industry Regional Market Share
Geographic Coverage of Bio-Ketones Industry
Bio-Ketones Industry REPORT HIGHLIGHTS
| Aspects | Details |
|---|---|
| Study Period | 2020-2034 |
| Base Year | 2025 |
| Estimated Year | 2026 |
| Forecast Period | 2026-2034 |
| Historical Period | 2020-2025 |
| Growth Rate | CAGR of 5.9% from 2020-2034 |
| Segmentation |
|
Table of Contents
- 1. Introduction
- 1.1. Research Scope
- 1.2. Market Segmentation
- 1.3. Research Objective
- 1.4. Definitions and Assumptions
- 2. Executive Summary
- 2.1. Market Snapshot
- 3. Market Dynamics
- 3.1. Market Drivers
- 3.2. Market Restrains
- 3.3. Market Trends
- 3.4. Market Opportunities
- 4. Market Factor Analysis
- 4.1. Porters Five Forces
- 4.1.1. Bargaining Power of Suppliers
- 4.1.2. Bargaining Power of Buyers
- 4.1.3. Threat of New Entrants
- 4.1.4. Threat of Substitutes
- 4.1.5. Competitive Rivalry
- 4.2. PESTEL analysis
- 4.3. BCG Analysis
- 4.3.1. Stars (High Growth, High Market Share)
- 4.3.2. Cash Cows (Low Growth, High Market Share)
- 4.3.3. Question Mark (High Growth, Low Market Share)
- 4.3.4. Dogs (Low Growth, Low Market Share)
- 4.4. Ansoff Matrix Analysis
- 4.5. Supply Chain Analysis
- 4.6. Regulatory Landscape
- 4.7. Current Market Potential and Opportunity Assessment (TAM–SAM–SOM Framework)
- 4.8. VDR Analyst Note
- 4.1. Porters Five Forces
- 5. Market Analysis, Insights and Forecast 2021-2033
- 5.1. Market Analysis, Insights and Forecast - by Product Type
- 5.1.1. Bio MEK
- 5.1.2. Bio PEEK
- 5.1.3. Bio Acetone
- 5.1.4. Other Product Types
- 5.2. Market Analysis, Insights and Forecast - by End-user Industry
- 5.2.1. Paints and Coatings
- 5.2.2. Automobile
- 5.2.3. Infrastructure
- 5.2.4. Pharmaceutical
- 5.2.5. Other End-user Industries
- 5.3. Market Analysis, Insights and Forecast - by Region
- 5.3.1. Asia Pacific
- 5.3.2. North America
- 5.3.3. Europe
- 5.3.4. South America
- 5.3.5. Middle East and Africa
- 5.1. Market Analysis, Insights and Forecast - by Product Type
- 6. Global Bio-Ketones Industry Analysis, Insights and Forecast, 2021-2033
- 6.1. Market Analysis, Insights and Forecast - by Product Type
- 6.1.1. Bio MEK
- 6.1.2. Bio PEEK
- 6.1.3. Bio Acetone
- 6.1.4. Other Product Types
- 6.2. Market Analysis, Insights and Forecast - by End-user Industry
- 6.2.1. Paints and Coatings
- 6.2.2. Automobile
- 6.2.3. Infrastructure
- 6.2.4. Pharmaceutical
- 6.2.5. Other End-user Industries
- 6.1. Market Analysis, Insights and Forecast - by Product Type
- 7. Asia Pacific Bio-Ketones Industry Analysis, Insights and Forecast, 2021-2033
- 7.1. Market Analysis, Insights and Forecast - by Product Type
- 7.1.1. Bio MEK
- 7.1.2. Bio PEEK
- 7.1.3. Bio Acetone
- 7.1.4. Other Product Types
- 7.2. Market Analysis, Insights and Forecast - by End-user Industry
- 7.2.1. Paints and Coatings
- 7.2.2. Automobile
- 7.2.3. Infrastructure
- 7.2.4. Pharmaceutical
- 7.2.5. Other End-user Industries
- 7.1. Market Analysis, Insights and Forecast - by Product Type
- 8. North America Bio-Ketones Industry Analysis, Insights and Forecast, 2021-2033
- 8.1. Market Analysis, Insights and Forecast - by Product Type
- 8.1.1. Bio MEK
- 8.1.2. Bio PEEK
- 8.1.3. Bio Acetone
- 8.1.4. Other Product Types
- 8.2. Market Analysis, Insights and Forecast - by End-user Industry
- 8.2.1. Paints and Coatings
- 8.2.2. Automobile
- 8.2.3. Infrastructure
- 8.2.4. Pharmaceutical
- 8.2.5. Other End-user Industries
- 8.1. Market Analysis, Insights and Forecast - by Product Type
- 9. Europe Bio-Ketones Industry Analysis, Insights and Forecast, 2021-2033
- 9.1. Market Analysis, Insights and Forecast - by Product Type
- 9.1.1. Bio MEK
- 9.1.2. Bio PEEK
- 9.1.3. Bio Acetone
- 9.1.4. Other Product Types
- 9.2. Market Analysis, Insights and Forecast - by End-user Industry
- 9.2.1. Paints and Coatings
- 9.2.2. Automobile
- 9.2.3. Infrastructure
- 9.2.4. Pharmaceutical
- 9.2.5. Other End-user Industries
- 9.1. Market Analysis, Insights and Forecast - by Product Type
- 10. South America Bio-Ketones Industry Analysis, Insights and Forecast, 2021-2033
- 10.1. Market Analysis, Insights and Forecast - by Product Type
- 10.1.1. Bio MEK
- 10.1.2. Bio PEEK
- 10.1.3. Bio Acetone
- 10.1.4. Other Product Types
- 10.2. Market Analysis, Insights and Forecast - by End-user Industry
- 10.2.1. Paints and Coatings
- 10.2.2. Automobile
- 10.2.3. Infrastructure
- 10.2.4. Pharmaceutical
- 10.2.5. Other End-user Industries
- 10.1. Market Analysis, Insights and Forecast - by Product Type
- 11. Middle East and Africa Bio-Ketones Industry Analysis, Insights and Forecast, 2021-2033
- 11.1. Market Analysis, Insights and Forecast - by Product Type
- 11.1.1. Bio MEK
- 11.1.2. Bio PEEK
- 11.1.3. Bio Acetone
- 11.1.4. Other Product Types
- 11.2. Market Analysis, Insights and Forecast - by End-user Industry
- 11.2.1. Paints and Coatings
- 11.2.2. Automobile
- 11.2.3. Infrastructure
- 11.2.4. Pharmaceutical
- 11.2.5. Other End-user Industries
- 11.1. Market Analysis, Insights and Forecast - by Product Type
- 12. Competitive Analysis
- 12.1. Company Profiles
- 12.1.1 Bio Brands LLC
- 12.1.1.1. Company Overview
- 12.1.1.2. Products
- 12.1.1.3. Company Financials
- 12.1.1.4. SWOT Analysis
- 12.1.2 Caldic B V
- 12.1.2.1. Company Overview
- 12.1.2.2. Products
- 12.1.2.3. Company Financials
- 12.1.2.4. SWOT Analysis
- 12.1.3 Eastman Chemical Company
- 12.1.3.1. Company Overview
- 12.1.3.2. Products
- 12.1.3.3. Company Financials
- 12.1.3.4. SWOT Analysis
- 12.1.4 Fitz Chem LLC
- 12.1.4.1. Company Overview
- 12.1.4.2. Products
- 12.1.4.3. Company Financials
- 12.1.4.4. SWOT Analysis
- 12.1.5 Genomatica Inc
- 12.1.5.1. Company Overview
- 12.1.5.2. Products
- 12.1.5.3. Company Financials
- 12.1.5.4. SWOT Analysis
- 12.1.6 Green Biologics Limited
- 12.1.6.1. Company Overview
- 12.1.6.2. Products
- 12.1.6.3. Company Financials
- 12.1.6.4. SWOT Analysis
- 12.1.7 LANZATECH
- 12.1.7.1. Company Overview
- 12.1.7.2. Products
- 12.1.7.3. Company Financials
- 12.1.7.4. SWOT Analysis
- 12.1.8 Merck KGaA*List Not Exhaustive
- 12.1.8.1. Company Overview
- 12.1.8.2. Products
- 12.1.8.3. Company Financials
- 12.1.8.4. SWOT Analysis
- 12.1.1 Bio Brands LLC
- 12.2. Market Entropy
- 12.2.1 Company's Key Areas Served
- 12.2.2 Recent Developments
- 12.3. Company Market Share Analysis 2025
- 12.3.1 Top 5 Companies Market Share Analysis
- 12.3.2 Top 3 Companies Market Share Analysis
- 12.4. List of Potential Customers
- 13. Research Methodology
List of Figures
- Figure 1: Global Bio-Ketones Industry Revenue Breakdown (billion, %) by Region 2025 & 2033
- Figure 2: Asia Pacific Bio-Ketones Industry Revenue (billion), by Product Type 2025 & 2033
- Figure 3: Asia Pacific Bio-Ketones Industry Revenue Share (%), by Product Type 2025 & 2033
- Figure 4: Asia Pacific Bio-Ketones Industry Revenue (billion), by End-user Industry 2025 & 2033
- Figure 5: Asia Pacific Bio-Ketones Industry Revenue Share (%), by End-user Industry 2025 & 2033
- Figure 6: Asia Pacific Bio-Ketones Industry Revenue (billion), by Country 2025 & 2033
- Figure 7: Asia Pacific Bio-Ketones Industry Revenue Share (%), by Country 2025 & 2033
- Figure 8: North America Bio-Ketones Industry Revenue (billion), by Product Type 2025 & 2033
- Figure 9: North America Bio-Ketones Industry Revenue Share (%), by Product Type 2025 & 2033
- Figure 10: North America Bio-Ketones Industry Revenue (billion), by End-user Industry 2025 & 2033
- Figure 11: North America Bio-Ketones Industry Revenue Share (%), by End-user Industry 2025 & 2033
- Figure 12: North America Bio-Ketones Industry Revenue (billion), by Country 2025 & 2033
- Figure 13: North America Bio-Ketones Industry Revenue Share (%), by Country 2025 & 2033
- Figure 14: Europe Bio-Ketones Industry Revenue (billion), by Product Type 2025 & 2033
- Figure 15: Europe Bio-Ketones Industry Revenue Share (%), by Product Type 2025 & 2033
- Figure 16: Europe Bio-Ketones Industry Revenue (billion), by End-user Industry 2025 & 2033
- Figure 17: Europe Bio-Ketones Industry Revenue Share (%), by End-user Industry 2025 & 2033
- Figure 18: Europe Bio-Ketones Industry Revenue (billion), by Country 2025 & 2033
- Figure 19: Europe Bio-Ketones Industry Revenue Share (%), by Country 2025 & 2033
- Figure 20: South America Bio-Ketones Industry Revenue (billion), by Product Type 2025 & 2033
- Figure 21: South America Bio-Ketones Industry Revenue Share (%), by Product Type 2025 & 2033
- Figure 22: South America Bio-Ketones Industry Revenue (billion), by End-user Industry 2025 & 2033
- Figure 23: South America Bio-Ketones Industry Revenue Share (%), by End-user Industry 2025 & 2033
- Figure 24: South America Bio-Ketones Industry Revenue (billion), by Country 2025 & 2033
- Figure 25: South America Bio-Ketones Industry Revenue Share (%), by Country 2025 & 2033
- Figure 26: Middle East and Africa Bio-Ketones Industry Revenue (billion), by Product Type 2025 & 2033
- Figure 27: Middle East and Africa Bio-Ketones Industry Revenue Share (%), by Product Type 2025 & 2033
- Figure 28: Middle East and Africa Bio-Ketones Industry Revenue (billion), by End-user Industry 2025 & 2033
- Figure 29: Middle East and Africa Bio-Ketones Industry Revenue Share (%), by End-user Industry 2025 & 2033
- Figure 30: Middle East and Africa Bio-Ketones Industry Revenue (billion), by Country 2025 & 2033
- Figure 31: Middle East and Africa Bio-Ketones Industry Revenue Share (%), by Country 2025 & 2033
List of Tables
- Table 1: Global Bio-Ketones Industry Revenue billion Forecast, by Product Type 2020 & 2033
- Table 2: Global Bio-Ketones Industry Revenue billion Forecast, by End-user Industry 2020 & 2033
- Table 3: Global Bio-Ketones Industry Revenue billion Forecast, by Region 2020 & 2033
- Table 4: Global Bio-Ketones Industry Revenue billion Forecast, by Product Type 2020 & 2033
- Table 5: Global Bio-Ketones Industry Revenue billion Forecast, by End-user Industry 2020 & 2033
- Table 6: Global Bio-Ketones Industry Revenue billion Forecast, by Country 2020 & 2033
- Table 7: China Bio-Ketones Industry Revenue (billion) Forecast, by Application 2020 & 2033
- Table 8: India Bio-Ketones Industry Revenue (billion) Forecast, by Application 2020 & 2033
- Table 9: Japan Bio-Ketones Industry Revenue (billion) Forecast, by Application 2020 & 2033
- Table 10: South Korea Bio-Ketones Industry Revenue (billion) Forecast, by Application 2020 & 2033
- Table 11: ASEAN Countries Bio-Ketones Industry Revenue (billion) Forecast, by Application 2020 & 2033
- Table 12: Rest of Asia Pacific Bio-Ketones Industry Revenue (billion) Forecast, by Application 2020 & 2033
- Table 13: Global Bio-Ketones Industry Revenue billion Forecast, by Product Type 2020 & 2033
- Table 14: Global Bio-Ketones Industry Revenue billion Forecast, by End-user Industry 2020 & 2033
- Table 15: Global Bio-Ketones Industry Revenue billion Forecast, by Country 2020 & 2033
- Table 16: United States Bio-Ketones Industry Revenue (billion) Forecast, by Application 2020 & 2033
- Table 17: Canada Bio-Ketones Industry Revenue (billion) Forecast, by Application 2020 & 2033
- Table 18: Mexico Bio-Ketones Industry Revenue (billion) Forecast, by Application 2020 & 2033
- Table 19: Global Bio-Ketones Industry Revenue billion Forecast, by Product Type 2020 & 2033
- Table 20: Global Bio-Ketones Industry Revenue billion Forecast, by End-user Industry 2020 & 2033
- Table 21: Global Bio-Ketones Industry Revenue billion Forecast, by Country 2020 & 2033
- Table 22: Germany Bio-Ketones Industry Revenue (billion) Forecast, by Application 2020 & 2033
- Table 23: United Kingdom Bio-Ketones Industry Revenue (billion) Forecast, by Application 2020 & 2033
- Table 24: Italy Bio-Ketones Industry Revenue (billion) Forecast, by Application 2020 & 2033
- Table 25: France Bio-Ketones Industry Revenue (billion) Forecast, by Application 2020 & 2033
- Table 26: Rest of Europe Bio-Ketones Industry Revenue (billion) Forecast, by Application 2020 & 2033
- Table 27: Global Bio-Ketones Industry Revenue billion Forecast, by Product Type 2020 & 2033
- Table 28: Global Bio-Ketones Industry Revenue billion Forecast, by End-user Industry 2020 & 2033
- Table 29: Global Bio-Ketones Industry Revenue billion Forecast, by Country 2020 & 2033
- Table 30: Brazil Bio-Ketones Industry Revenue (billion) Forecast, by Application 2020 & 2033
- Table 31: Argentina Bio-Ketones Industry Revenue (billion) Forecast, by Application 2020 & 2033
- Table 32: Rest of South America Bio-Ketones Industry Revenue (billion) Forecast, by Application 2020 & 2033
- Table 33: Global Bio-Ketones Industry Revenue billion Forecast, by Product Type 2020 & 2033
- Table 34: Global Bio-Ketones Industry Revenue billion Forecast, by End-user Industry 2020 & 2033
- Table 35: Global Bio-Ketones Industry Revenue billion Forecast, by Country 2020 & 2033
- Table 36: Saudi Arabia Bio-Ketones Industry Revenue (billion) Forecast, by Application 2020 & 2033
- Table 37: South Africa Bio-Ketones Industry Revenue (billion) Forecast, by Application 2020 & 2033
- Table 38: Rest of Middle East and Africa Bio-Ketones Industry Revenue (billion) Forecast, by Application 2020 & 2033
Frequently Asked Questions
1. What is the projected Compound Annual Growth Rate (CAGR) of the Bio-Ketones Industry?
The projected CAGR is approximately 5.9%.
2. Which companies are prominent players in the Bio-Ketones Industry?
Key companies in the market include Bio Brands LLC, Caldic B V, Eastman Chemical Company, Fitz Chem LLC, Genomatica Inc, Green Biologics Limited, LANZATECH, Merck KGaA*List Not Exhaustive.
3. What are the main segments of the Bio-Ketones Industry?
The market segments include Product Type, End-user Industry.
4. Can you provide details about the market size?
The market size is estimated to be USD 24.25 billion as of 2022.
5. What are some drivers contributing to market growth?
; Increasing Demand from Cosmetics and Personal Care Industry; Supporting Government Regulations for the Use of Bio-products.
6. What are the notable trends driving market growth?
Bio PEEK to Dominate the Market.
7. Are there any restraints impacting market growth?
; Increasing Demand from Cosmetics and Personal Care Industry; Supporting Government Regulations for the Use of Bio-products.
8. Can you provide examples of recent developments in the market?
N/A
9. What pricing options are available for accessing the report?
Pricing options include single-user, multi-user, and enterprise licenses priced at USD 4750, USD 5250, and USD 8750 respectively.
10. Is the market size provided in terms of value or volume?
The market size is provided in terms of value, measured in billion.
11. Are there any specific market keywords associated with the report?
Yes, the market keyword associated with the report is "Bio-Ketones Industry," which aids in identifying and referencing the specific market segment covered.
12. How do I determine which pricing option suits my needs best?
The pricing options vary based on user requirements and access needs. Individual users may opt for single-user licenses, while businesses requiring broader access may choose multi-user or enterprise licenses for cost-effective access to the report.
13. Are there any additional resources or data provided in the Bio-Ketones Industry report?
While the report offers comprehensive insights, it's advisable to review the specific contents or supplementary materials provided to ascertain if additional resources or data are available.
14. How can I stay updated on further developments or reports in the Bio-Ketones Industry?
To stay informed about further developments, trends, and reports in the Bio-Ketones Industry, consider subscribing to industry newsletters, following relevant companies and organizations, or regularly checking reputable industry news sources and publications.
Methodology
Step 1 - Identification of Relevant Samples Size from Population Database


Step 2 - Approaches for Defining Global Market Size (Value, Volume* & Price*)

Note*: In applicable scenarios
Step 3 - Data Sources
Primary Research
- Web Analytics
- Survey Reports
- Research Institute
- Latest Research Reports
- Opinion Leaders
Secondary Research
- Annual Reports
- White Paper
- Latest Press Release
- Industry Association
- Paid Database
- Investor Presentations

Step 4 - Data Triangulation
Involves using different sources of information in order to increase the validity of a study
These sources are likely to be stakeholders in a program - participants, other researchers, program staff, other community members, and so on.
Then we put all data in single framework & apply various statistical tools to find out the dynamic on the market.
During the analysis stage, feedback from the stakeholder groups would be compared to determine areas of agreement as well as areas of divergence