
Key Insights
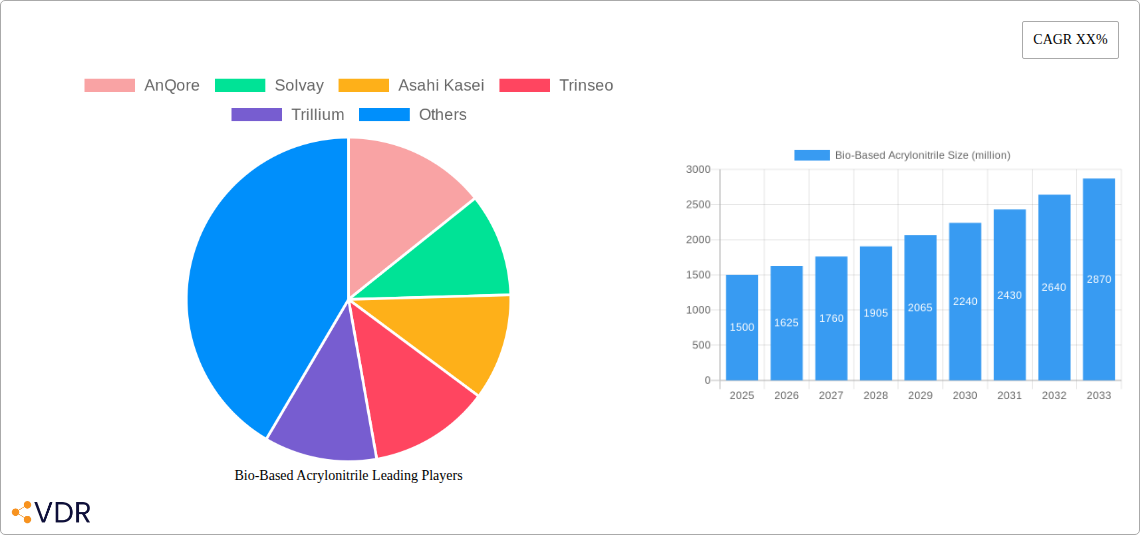
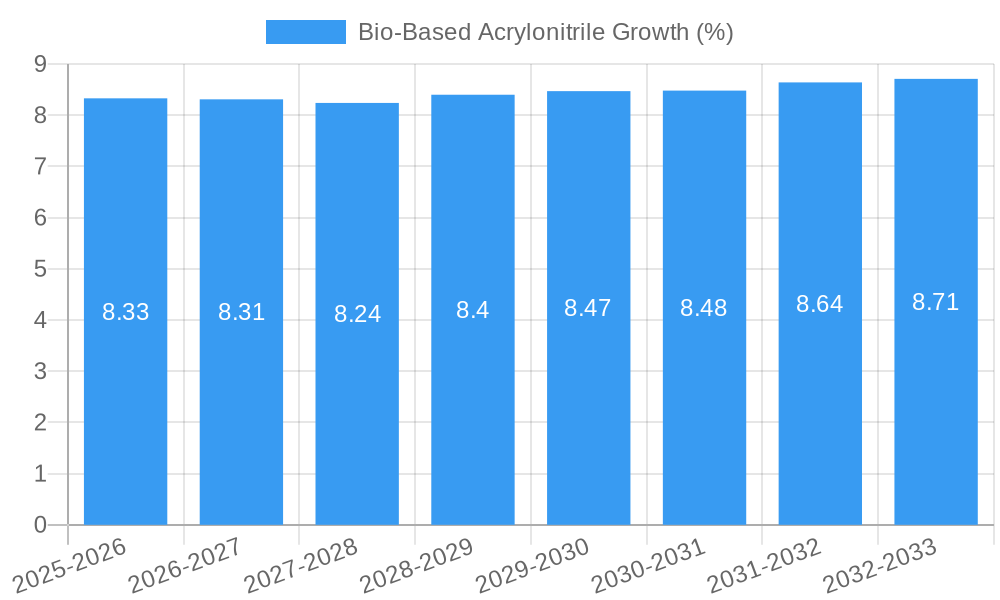
The global Bio-Based Acrylonitrile market is poised for significant expansion, projected to reach an estimated market size of $1.5 billion in 2025 and grow at a robust CAGR of approximately 8.5% through 2033. This remarkable growth is primarily fueled by increasing consumer demand for sustainable products and stringent environmental regulations promoting the adoption of eco-friendly alternatives to petroleum-based chemicals. The "green" narrative is powerfully resonating across industries, particularly in rubber, plastics, and synthetic fiber manufacturing, where bio-based acrylonitrile offers a compelling pathway to reduced carbon footprints. Furthermore, advancements in biotechnology and fermentation processes are continuously improving the efficiency and cost-effectiveness of bio-based acrylonitrile production, making it a more viable and attractive option for industrial-scale applications. The growing emphasis on circular economy principles and the desire to mitigate reliance on fossil fuels are further accelerating market penetration.
Key drivers for this burgeoning market include the inherent sustainability benefits, such as a lower greenhouse gas emission profile and reduced reliance on finite petroleum resources. The increasing corporate sustainability goals and investor pressure for ESG (Environmental, Social, and Governance) compliance are also acting as strong catalysts. While challenges such as initial higher production costs compared to conventional acrylonitrile and the need for significant capital investment in new bio-refinery infrastructure exist, these are steadily being addressed through technological innovation and economies of scale. The market is segmented by purity, with demand for both Purity ≥99% and Purity ≥99.5% expected to rise, catering to diverse application needs across various end-user industries. Leading players like AnQore, Solvay, Asahi Kasei, Trinseo, and Trillium are actively investing in research and development, expanding production capacities, and forging strategic partnerships to capture this rapidly evolving market.
Unlocking Sustainable Chemistry: The Bio-Based Acrylonitrile Market Outlook 2019-2033
This comprehensive report delves into the burgeoning bio-based acrylonitrile market, a critical component for sustainable manufacturing across diverse industries. Explore market dynamics, growth trajectories, regional dominance, product innovations, and key strategic insights, with all values presented in million units. This report is designed for industry professionals seeking a deep understanding of the market's evolution, from historical performance to future projections, with a focus on the pivotal base year of 2025.
Bio-Based Acrylonitrile Market Dynamics & Structure
The global bio-based acrylonitrile market exhibits a moderately concentrated structure, with a few key players like AnQore, Solvay, and Asahi Kasei holding significant market shares. Technological innovation is a primary driver, fueled by advancements in bio-refining processes and catalyst development for more efficient and cost-effective production of acrylonitrile from renewable feedstocks. Stringent environmental regulations and the increasing demand for sustainable materials are shaping the regulatory framework, pushing companies towards greener alternatives. Competitive product substitutes, such as conventional acrylonitrile and other bio-based monomers, present a dynamic competitive landscape. End-user demographics are shifting towards environmentally conscious consumers and businesses prioritizing sustainability in their supply chains. Mergers and acquisition (M&A) trends are observed as companies seek to consolidate their market position, expand their bio-based product portfolios, and secure access to proprietary technologies. For instance, in the historical period (2019-2024), an estimated XX M&A deals were recorded, indicating a strategic consolidation phase. Innovation barriers include the high initial investment required for bio-refinery infrastructure and the need for consistent, scalable feedstock supply.
- Market Concentration: Moderately concentrated, with key players investing in R&D for sustainable production.
- Technological Innovation: Driven by bio-refining advancements and novel catalyst development.
- Regulatory Framework: Influenced by global environmental mandates and incentives for bio-based products.
- Competitive Substitutes: Conventional acrylonitrile, other bio-based monomers, and advanced material solutions.
- End-User Demographics: Growing preference for sustainable, eco-friendly materials across industries.
- M&A Trends: Strategic acquisitions and partnerships to enhance market presence and technological capabilities.
Bio-Based Acrylonitrile Growth Trends & Insights
The bio-based acrylonitrile market is poised for significant expansion, driven by increasing environmental consciousness and the imperative to reduce carbon footprints. The market size is projected to witness a Compound Annual Growth Rate (CAGR) of XX% from 2025 to 2033. Adoption rates are steadily climbing as industries recognize the economic and environmental benefits of adopting bio-based alternatives. Technological disruptions, particularly in feedstock conversion and purification, are critical in enhancing the cost-competitiveness and scalability of bio-based acrylonitrile. Consumer behavior is evolving, with a growing demand for products made from sustainable materials, influencing manufacturers to integrate bio-based components into their offerings. The market penetration of bio-based acrylonitrile is expected to rise from an estimated XX% in the base year 2025 to XX% by 2033. The development of novel bio-refining pathways and improvements in process efficiency are key to unlocking further growth potential. Investment in research and development for next-generation bio-based acrylonitrile technologies will be crucial for market leaders. The shift towards a circular economy model further propels the demand for sustainably sourced chemicals, positioning bio-based acrylonitrile as a vital enabler. The economic viability is becoming increasingly attractive as the cost of fossil-based feedstocks fluctuates and environmental regulations tighten. Educational initiatives and industry collaborations are also playing a role in raising awareness and fostering wider adoption.
Dominant Regions, Countries, or Segments in Bio-Based Acrylonitrile
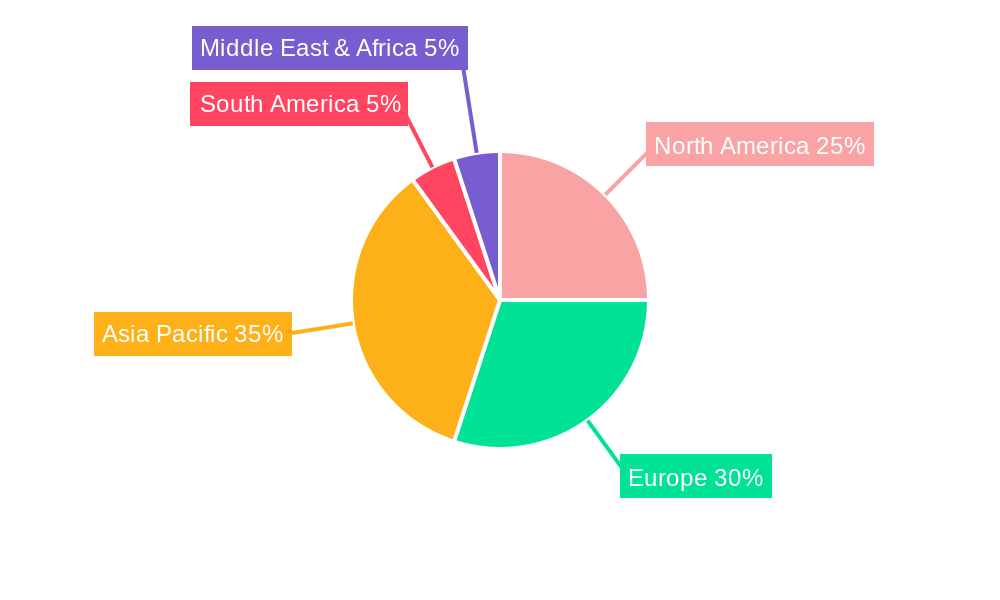
The Plastics application segment is projected to be the dominant force in the bio-based acrylonitrile market, driven by its extensive use in the production of high-performance polymers with enhanced sustainability profiles. North America and Europe are anticipated to lead regional growth, spurred by robust government support for green initiatives, stringent environmental policies, and a strong presence of key market players.
Dominant Application Segment: Plastics
- Key Drivers: Increasing demand for sustainable plastics in automotive, packaging, and consumer goods.
- Market Share Potential: Expected to account for over XX% of the total bio-based acrylonitrile market by 2033.
- Growth Factors: Development of bio-based ABS, SAN, and other engineering plastics with improved environmental credentials.
Dominant Regions: North America and Europe
- North America: Driven by supportive policies like the Inflation Reduction Act and a strong focus on circular economy principles. Significant investments in bio-refineries and R&D capabilities.
- Europe: Led by ambitious climate targets and the European Green Deal, fostering the adoption of bio-based chemicals. Stringent regulations on conventional chemical production.
- Economic Policies: Government incentives, tax breaks, and funding for bio-based research and manufacturing.
- Infrastructure Development: Investments in bio-refinery capacity and sustainable logistics networks.
Dominant Type: Purity ≥99.5%
- Significance: Essential for high-value applications in advanced polymers and specialized chemical synthesis.
- Growth Potential: Increasing demand for premium bio-based materials requiring stringent purity standards.
Bio-Based Acrylonitrile Product Landscape
Bio-based acrylonitrile is emerging with innovative applications and enhanced performance metrics, setting new benchmarks for sustainable chemistry. Product innovations focus on achieving superior mechanical properties, thermal stability, and chemical resistance while maintaining a reduced environmental footprint. Unique selling propositions include a lower carbon footprint compared to petroleum-derived acrylonitrile, contributing to a more sustainable product lifecycle. Technological advancements in enzymatic and microbial synthesis are enabling the production of high-purity bio-based acrylonitrile, meeting the stringent requirements of various end-use industries.
Key Drivers, Barriers & Challenges in Bio-Based Acrylonitrile
The bio-based acrylonitrile market is propelled by several key drivers, including increasing global demand for sustainable materials, stringent environmental regulations promoting the use of renewable resources, and growing corporate sustainability initiatives. Technological advancements in bio-refining and fermentation processes are making bio-based acrylonitrile more competitive.
- Key Drivers:
- Sustainability Demand: Growing consumer and industry preference for eco-friendly products.
- Regulatory Push: Government policies and incentives favoring bio-based chemicals.
- Technological Advancements: Improved efficiency and cost-effectiveness in bio-production.
Key challenges and restraints for the bio-based acrylonitrile market include the higher production costs compared to conventional acrylonitrile, the availability and consistency of sustainable feedstock supply, and the need for significant capital investment in new production facilities. Regulatory hurdles and the perception of bio-based products as niche can also hinder widespread adoption.
- Key Challenges & Restraints:
- Cost Competitiveness: Higher initial production costs compared to petroleum-based alternatives.
- Feedstock Availability: Ensuring a consistent and scalable supply of sustainable biomass.
- Capital Investment: High upfront costs for establishing bio-refinery infrastructure.
- Market Perception: Overcoming potential skepticism regarding the performance and reliability of bio-based products.
Emerging Opportunities in Bio-Based Acrylonitrile
Emerging opportunities lie in the development of novel bio-based acrylonitrile applications in advanced composites, 3D printing materials, and biodegradable polymers. The untapped markets in developing economies with growing environmental awareness present significant potential. Evolving consumer preferences for ethically sourced and sustainable products will further fuel demand. The expansion of circular economy models offers opportunities for closed-loop systems in bio-based acrylonitrile production and utilization.
Growth Accelerators in the Bio-Based Acrylonitrile Industry
Catalysts driving long-term growth in the bio-based acrylonitrile industry include breakthroughs in synthetic biology for optimizing microbial production strains, strategic partnerships between chemical manufacturers and bio-technology firms, and market expansion strategies targeting new geographical regions and emerging applications. The increasing focus on lifecycle assessment and carbon footprint reduction will further incentivize the adoption of bio-based acrylonitrile.
Key Players Shaping the Bio-Based Acrylonitrile Market
- AnQore
- Solvay
- Asahi Kasei
- Trinseo
- Trillium
Notable Milestones in Bio-Based Acrylonitrile Sector
- 2019: Launch of pilot-scale bio-based acrylonitrile production facility by [Company Name], demonstrating feasibility.
- 2020: Significant R&D investment by [Company Name] in novel bio-fermentation technologies for acrylonitrile.
- 2021: Strategic collaboration announced between [Company Name] and [Company Name] to develop sustainable acrylonitrile applications.
- 2022: Successful scaling up of bio-based acrylonitrile production to commercial volumes by [Company Name], marking a key milestone.
- 2023: Introduction of bio-based acrylonitrile grades with enhanced purity and performance characteristics by [Company Name].
- 2024: [Company Name] achieves significant cost reduction in its bio-based acrylonitrile production process.
In-Depth Bio-Based Acrylonitrile Market Outlook
The future market potential for bio-based acrylonitrile is exceptionally bright, driven by the global shift towards a sustainable and circular economy. Strategic opportunities include further investments in R&D for next-generation bio-production technologies, fostering collaborations across the value chain to accelerate market penetration, and expanding into new application areas where the unique properties of bio-based acrylonitrile can provide a competitive edge. The estimated market value for bio-based acrylonitrile is projected to reach XX million units by 2033.
Bio-Based Acrylonitrile Segmentation
-
1. Application
- 1.1. Rubber
- 1.2. Plastics
- 1.3. Synthetic Fiber
- 1.4. Others
-
2. Types
- 2.1. Purity≥99%
- 2.2. Purity≥99.5%
Bio-Based Acrylonitrile Segmentation By Geography
-
1. North America
- 1.1. United States
- 1.2. Canada
- 1.3. Mexico
-
2. South America
- 2.1. Brazil
- 2.2. Argentina
- 2.3. Rest of South America
-
3. Europe
- 3.1. United Kingdom
- 3.2. Germany
- 3.3. France
- 3.4. Italy
- 3.5. Spain
- 3.6. Russia
- 3.7. Benelux
- 3.8. Nordics
- 3.9. Rest of Europe
-
4. Middle East & Africa
- 4.1. Turkey
- 4.2. Israel
- 4.3. GCC
- 4.4. North Africa
- 4.5. South Africa
- 4.6. Rest of Middle East & Africa
-
5. Asia Pacific
- 5.1. China
- 5.2. India
- 5.3. Japan
- 5.4. South Korea
- 5.5. ASEAN
- 5.6. Oceania
- 5.7. Rest of Asia Pacific
Bio-Based Acrylonitrile REPORT HIGHLIGHTS
| Aspects | Details |
|---|---|
| Study Period | 2019-2033 |
| Base Year | 2024 |
| Estimated Year | 2025 |
| Forecast Period | 2025-2033 |
| Historical Period | 2019-2024 |
| Growth Rate | CAGR of XX% from 2019-2033 |
| Segmentation |
|
Table of Contents
- 1. Introduction
- 1.1. Research Scope
- 1.2. Market Segmentation
- 1.3. Research Methodology
- 1.4. Definitions and Assumptions
- 2. Executive Summary
- 2.1. Introduction
- 3. Market Dynamics
- 3.1. Introduction
- 3.2. Market Drivers
- 3.3. Market Restrains
- 3.4. Market Trends
- 4. Market Factor Analysis
- 4.1. Porters Five Forces
- 4.2. Supply/Value Chain
- 4.3. PESTEL analysis
- 4.4. Market Entropy
- 4.5. Patent/Trademark Analysis
- 5. Global Bio-Based Acrylonitrile Analysis, Insights and Forecast, 2019-2031
- 5.1. Market Analysis, Insights and Forecast - by Application
- 5.1.1. Rubber
- 5.1.2. Plastics
- 5.1.3. Synthetic Fiber
- 5.1.4. Others
- 5.2. Market Analysis, Insights and Forecast - by Types
- 5.2.1. Purity≥99%
- 5.2.2. Purity≥99.5%
- 5.3. Market Analysis, Insights and Forecast - by Region
- 5.3.1. North America
- 5.3.2. South America
- 5.3.3. Europe
- 5.3.4. Middle East & Africa
- 5.3.5. Asia Pacific
- 5.1. Market Analysis, Insights and Forecast - by Application
- 6. North America Bio-Based Acrylonitrile Analysis, Insights and Forecast, 2019-2031
- 6.1. Market Analysis, Insights and Forecast - by Application
- 6.1.1. Rubber
- 6.1.2. Plastics
- 6.1.3. Synthetic Fiber
- 6.1.4. Others
- 6.2. Market Analysis, Insights and Forecast - by Types
- 6.2.1. Purity≥99%
- 6.2.2. Purity≥99.5%
- 6.1. Market Analysis, Insights and Forecast - by Application
- 7. South America Bio-Based Acrylonitrile Analysis, Insights and Forecast, 2019-2031
- 7.1. Market Analysis, Insights and Forecast - by Application
- 7.1.1. Rubber
- 7.1.2. Plastics
- 7.1.3. Synthetic Fiber
- 7.1.4. Others
- 7.2. Market Analysis, Insights and Forecast - by Types
- 7.2.1. Purity≥99%
- 7.2.2. Purity≥99.5%
- 7.1. Market Analysis, Insights and Forecast - by Application
- 8. Europe Bio-Based Acrylonitrile Analysis, Insights and Forecast, 2019-2031
- 8.1. Market Analysis, Insights and Forecast - by Application
- 8.1.1. Rubber
- 8.1.2. Plastics
- 8.1.3. Synthetic Fiber
- 8.1.4. Others
- 8.2. Market Analysis, Insights and Forecast - by Types
- 8.2.1. Purity≥99%
- 8.2.2. Purity≥99.5%
- 8.1. Market Analysis, Insights and Forecast - by Application
- 9. Middle East & Africa Bio-Based Acrylonitrile Analysis, Insights and Forecast, 2019-2031
- 9.1. Market Analysis, Insights and Forecast - by Application
- 9.1.1. Rubber
- 9.1.2. Plastics
- 9.1.3. Synthetic Fiber
- 9.1.4. Others
- 9.2. Market Analysis, Insights and Forecast - by Types
- 9.2.1. Purity≥99%
- 9.2.2. Purity≥99.5%
- 9.1. Market Analysis, Insights and Forecast - by Application
- 10. Asia Pacific Bio-Based Acrylonitrile Analysis, Insights and Forecast, 2019-2031
- 10.1. Market Analysis, Insights and Forecast - by Application
- 10.1.1. Rubber
- 10.1.2. Plastics
- 10.1.3. Synthetic Fiber
- 10.1.4. Others
- 10.2. Market Analysis, Insights and Forecast - by Types
- 10.2.1. Purity≥99%
- 10.2.2. Purity≥99.5%
- 10.1. Market Analysis, Insights and Forecast - by Application
- 11. Competitive Analysis
- 11.1. Global Market Share Analysis 2024
- 11.2. Company Profiles
- 11.2.1 AnQore
- 11.2.1.1. Overview
- 11.2.1.2. Products
- 11.2.1.3. SWOT Analysis
- 11.2.1.4. Recent Developments
- 11.2.1.5. Financials (Based on Availability)
- 11.2.2 Solvay
- 11.2.2.1. Overview
- 11.2.2.2. Products
- 11.2.2.3. SWOT Analysis
- 11.2.2.4. Recent Developments
- 11.2.2.5. Financials (Based on Availability)
- 11.2.3 Asahi Kasei
- 11.2.3.1. Overview
- 11.2.3.2. Products
- 11.2.3.3. SWOT Analysis
- 11.2.3.4. Recent Developments
- 11.2.3.5. Financials (Based on Availability)
- 11.2.4 Trinseo
- 11.2.4.1. Overview
- 11.2.4.2. Products
- 11.2.4.3. SWOT Analysis
- 11.2.4.4. Recent Developments
- 11.2.4.5. Financials (Based on Availability)
- 11.2.5 Trillium
- 11.2.5.1. Overview
- 11.2.5.2. Products
- 11.2.5.3. SWOT Analysis
- 11.2.5.4. Recent Developments
- 11.2.5.5. Financials (Based on Availability)
- 11.2.1 AnQore
List of Figures
- Figure 1: Global Bio-Based Acrylonitrile Revenue Breakdown (million, %) by Region 2024 & 2032
- Figure 2: North America Bio-Based Acrylonitrile Revenue (million), by Application 2024 & 2032
- Figure 3: North America Bio-Based Acrylonitrile Revenue Share (%), by Application 2024 & 2032
- Figure 4: North America Bio-Based Acrylonitrile Revenue (million), by Types 2024 & 2032
- Figure 5: North America Bio-Based Acrylonitrile Revenue Share (%), by Types 2024 & 2032
- Figure 6: North America Bio-Based Acrylonitrile Revenue (million), by Country 2024 & 2032
- Figure 7: North America Bio-Based Acrylonitrile Revenue Share (%), by Country 2024 & 2032
- Figure 8: South America Bio-Based Acrylonitrile Revenue (million), by Application 2024 & 2032
- Figure 9: South America Bio-Based Acrylonitrile Revenue Share (%), by Application 2024 & 2032
- Figure 10: South America Bio-Based Acrylonitrile Revenue (million), by Types 2024 & 2032
- Figure 11: South America Bio-Based Acrylonitrile Revenue Share (%), by Types 2024 & 2032
- Figure 12: South America Bio-Based Acrylonitrile Revenue (million), by Country 2024 & 2032
- Figure 13: South America Bio-Based Acrylonitrile Revenue Share (%), by Country 2024 & 2032
- Figure 14: Europe Bio-Based Acrylonitrile Revenue (million), by Application 2024 & 2032
- Figure 15: Europe Bio-Based Acrylonitrile Revenue Share (%), by Application 2024 & 2032
- Figure 16: Europe Bio-Based Acrylonitrile Revenue (million), by Types 2024 & 2032
- Figure 17: Europe Bio-Based Acrylonitrile Revenue Share (%), by Types 2024 & 2032
- Figure 18: Europe Bio-Based Acrylonitrile Revenue (million), by Country 2024 & 2032
- Figure 19: Europe Bio-Based Acrylonitrile Revenue Share (%), by Country 2024 & 2032
- Figure 20: Middle East & Africa Bio-Based Acrylonitrile Revenue (million), by Application 2024 & 2032
- Figure 21: Middle East & Africa Bio-Based Acrylonitrile Revenue Share (%), by Application 2024 & 2032
- Figure 22: Middle East & Africa Bio-Based Acrylonitrile Revenue (million), by Types 2024 & 2032
- Figure 23: Middle East & Africa Bio-Based Acrylonitrile Revenue Share (%), by Types 2024 & 2032
- Figure 24: Middle East & Africa Bio-Based Acrylonitrile Revenue (million), by Country 2024 & 2032
- Figure 25: Middle East & Africa Bio-Based Acrylonitrile Revenue Share (%), by Country 2024 & 2032
- Figure 26: Asia Pacific Bio-Based Acrylonitrile Revenue (million), by Application 2024 & 2032
- Figure 27: Asia Pacific Bio-Based Acrylonitrile Revenue Share (%), by Application 2024 & 2032
- Figure 28: Asia Pacific Bio-Based Acrylonitrile Revenue (million), by Types 2024 & 2032
- Figure 29: Asia Pacific Bio-Based Acrylonitrile Revenue Share (%), by Types 2024 & 2032
- Figure 30: Asia Pacific Bio-Based Acrylonitrile Revenue (million), by Country 2024 & 2032
- Figure 31: Asia Pacific Bio-Based Acrylonitrile Revenue Share (%), by Country 2024 & 2032
List of Tables
- Table 1: Global Bio-Based Acrylonitrile Revenue million Forecast, by Region 2019 & 2032
- Table 2: Global Bio-Based Acrylonitrile Revenue million Forecast, by Application 2019 & 2032
- Table 3: Global Bio-Based Acrylonitrile Revenue million Forecast, by Types 2019 & 2032
- Table 4: Global Bio-Based Acrylonitrile Revenue million Forecast, by Region 2019 & 2032
- Table 5: Global Bio-Based Acrylonitrile Revenue million Forecast, by Application 2019 & 2032
- Table 6: Global Bio-Based Acrylonitrile Revenue million Forecast, by Types 2019 & 2032
- Table 7: Global Bio-Based Acrylonitrile Revenue million Forecast, by Country 2019 & 2032
- Table 8: United States Bio-Based Acrylonitrile Revenue (million) Forecast, by Application 2019 & 2032
- Table 9: Canada Bio-Based Acrylonitrile Revenue (million) Forecast, by Application 2019 & 2032
- Table 10: Mexico Bio-Based Acrylonitrile Revenue (million) Forecast, by Application 2019 & 2032
- Table 11: Global Bio-Based Acrylonitrile Revenue million Forecast, by Application 2019 & 2032
- Table 12: Global Bio-Based Acrylonitrile Revenue million Forecast, by Types 2019 & 2032
- Table 13: Global Bio-Based Acrylonitrile Revenue million Forecast, by Country 2019 & 2032
- Table 14: Brazil Bio-Based Acrylonitrile Revenue (million) Forecast, by Application 2019 & 2032
- Table 15: Argentina Bio-Based Acrylonitrile Revenue (million) Forecast, by Application 2019 & 2032
- Table 16: Rest of South America Bio-Based Acrylonitrile Revenue (million) Forecast, by Application 2019 & 2032
- Table 17: Global Bio-Based Acrylonitrile Revenue million Forecast, by Application 2019 & 2032
- Table 18: Global Bio-Based Acrylonitrile Revenue million Forecast, by Types 2019 & 2032
- Table 19: Global Bio-Based Acrylonitrile Revenue million Forecast, by Country 2019 & 2032
- Table 20: United Kingdom Bio-Based Acrylonitrile Revenue (million) Forecast, by Application 2019 & 2032
- Table 21: Germany Bio-Based Acrylonitrile Revenue (million) Forecast, by Application 2019 & 2032
- Table 22: France Bio-Based Acrylonitrile Revenue (million) Forecast, by Application 2019 & 2032
- Table 23: Italy Bio-Based Acrylonitrile Revenue (million) Forecast, by Application 2019 & 2032
- Table 24: Spain Bio-Based Acrylonitrile Revenue (million) Forecast, by Application 2019 & 2032
- Table 25: Russia Bio-Based Acrylonitrile Revenue (million) Forecast, by Application 2019 & 2032
- Table 26: Benelux Bio-Based Acrylonitrile Revenue (million) Forecast, by Application 2019 & 2032
- Table 27: Nordics Bio-Based Acrylonitrile Revenue (million) Forecast, by Application 2019 & 2032
- Table 28: Rest of Europe Bio-Based Acrylonitrile Revenue (million) Forecast, by Application 2019 & 2032
- Table 29: Global Bio-Based Acrylonitrile Revenue million Forecast, by Application 2019 & 2032
- Table 30: Global Bio-Based Acrylonitrile Revenue million Forecast, by Types 2019 & 2032
- Table 31: Global Bio-Based Acrylonitrile Revenue million Forecast, by Country 2019 & 2032
- Table 32: Turkey Bio-Based Acrylonitrile Revenue (million) Forecast, by Application 2019 & 2032
- Table 33: Israel Bio-Based Acrylonitrile Revenue (million) Forecast, by Application 2019 & 2032
- Table 34: GCC Bio-Based Acrylonitrile Revenue (million) Forecast, by Application 2019 & 2032
- Table 35: North Africa Bio-Based Acrylonitrile Revenue (million) Forecast, by Application 2019 & 2032
- Table 36: South Africa Bio-Based Acrylonitrile Revenue (million) Forecast, by Application 2019 & 2032
- Table 37: Rest of Middle East & Africa Bio-Based Acrylonitrile Revenue (million) Forecast, by Application 2019 & 2032
- Table 38: Global Bio-Based Acrylonitrile Revenue million Forecast, by Application 2019 & 2032
- Table 39: Global Bio-Based Acrylonitrile Revenue million Forecast, by Types 2019 & 2032
- Table 40: Global Bio-Based Acrylonitrile Revenue million Forecast, by Country 2019 & 2032
- Table 41: China Bio-Based Acrylonitrile Revenue (million) Forecast, by Application 2019 & 2032
- Table 42: India Bio-Based Acrylonitrile Revenue (million) Forecast, by Application 2019 & 2032
- Table 43: Japan Bio-Based Acrylonitrile Revenue (million) Forecast, by Application 2019 & 2032
- Table 44: South Korea Bio-Based Acrylonitrile Revenue (million) Forecast, by Application 2019 & 2032
- Table 45: ASEAN Bio-Based Acrylonitrile Revenue (million) Forecast, by Application 2019 & 2032
- Table 46: Oceania Bio-Based Acrylonitrile Revenue (million) Forecast, by Application 2019 & 2032
- Table 47: Rest of Asia Pacific Bio-Based Acrylonitrile Revenue (million) Forecast, by Application 2019 & 2032
Frequently Asked Questions
1. What is the projected Compound Annual Growth Rate (CAGR) of the Bio-Based Acrylonitrile?
The projected CAGR is approximately XX%.
2. Which companies are prominent players in the Bio-Based Acrylonitrile?
Key companies in the market include AnQore, Solvay, Asahi Kasei, Trinseo, Trillium.
3. What are the main segments of the Bio-Based Acrylonitrile?
The market segments include Application, Types.
4. Can you provide details about the market size?
The market size is estimated to be USD XXX million as of 2022.
5. What are some drivers contributing to market growth?
N/A
6. What are the notable trends driving market growth?
N/A
7. Are there any restraints impacting market growth?
N/A
8. Can you provide examples of recent developments in the market?
N/A
9. What pricing options are available for accessing the report?
Pricing options include single-user, multi-user, and enterprise licenses priced at USD 4900.00, USD 7350.00, and USD 9800.00 respectively.
10. Is the market size provided in terms of value or volume?
The market size is provided in terms of value, measured in million.
11. Are there any specific market keywords associated with the report?
Yes, the market keyword associated with the report is "Bio-Based Acrylonitrile," which aids in identifying and referencing the specific market segment covered.
12. How do I determine which pricing option suits my needs best?
The pricing options vary based on user requirements and access needs. Individual users may opt for single-user licenses, while businesses requiring broader access may choose multi-user or enterprise licenses for cost-effective access to the report.
13. Are there any additional resources or data provided in the Bio-Based Acrylonitrile report?
While the report offers comprehensive insights, it's advisable to review the specific contents or supplementary materials provided to ascertain if additional resources or data are available.
14. How can I stay updated on further developments or reports in the Bio-Based Acrylonitrile?
To stay informed about further developments, trends, and reports in the Bio-Based Acrylonitrile, consider subscribing to industry newsletters, following relevant companies and organizations, or regularly checking reputable industry news sources and publications.
Methodology
Step 1 - Identification of Relevant Samples Size from Population Database


Step 2 - Approaches for Defining Global Market Size (Value, Volume* & Price*)

Note*: In applicable scenarios
Step 3 - Data Sources
Primary Research
- Web Analytics
- Survey Reports
- Research Institute
- Latest Research Reports
- Opinion Leaders
Secondary Research
- Annual Reports
- White Paper
- Latest Press Release
- Industry Association
- Paid Database
- Investor Presentations

Step 4 - Data Triangulation
Involves using different sources of information in order to increase the validity of a study
These sources are likely to be stakeholders in a program - participants, other researchers, program staff, other community members, and so on.
Then we put all data in single framework & apply various statistical tools to find out the dynamic on the market.
During the analysis stage, feedback from the stakeholder groups would be compared to determine areas of agreement as well as areas of divergence


