


Key Insights
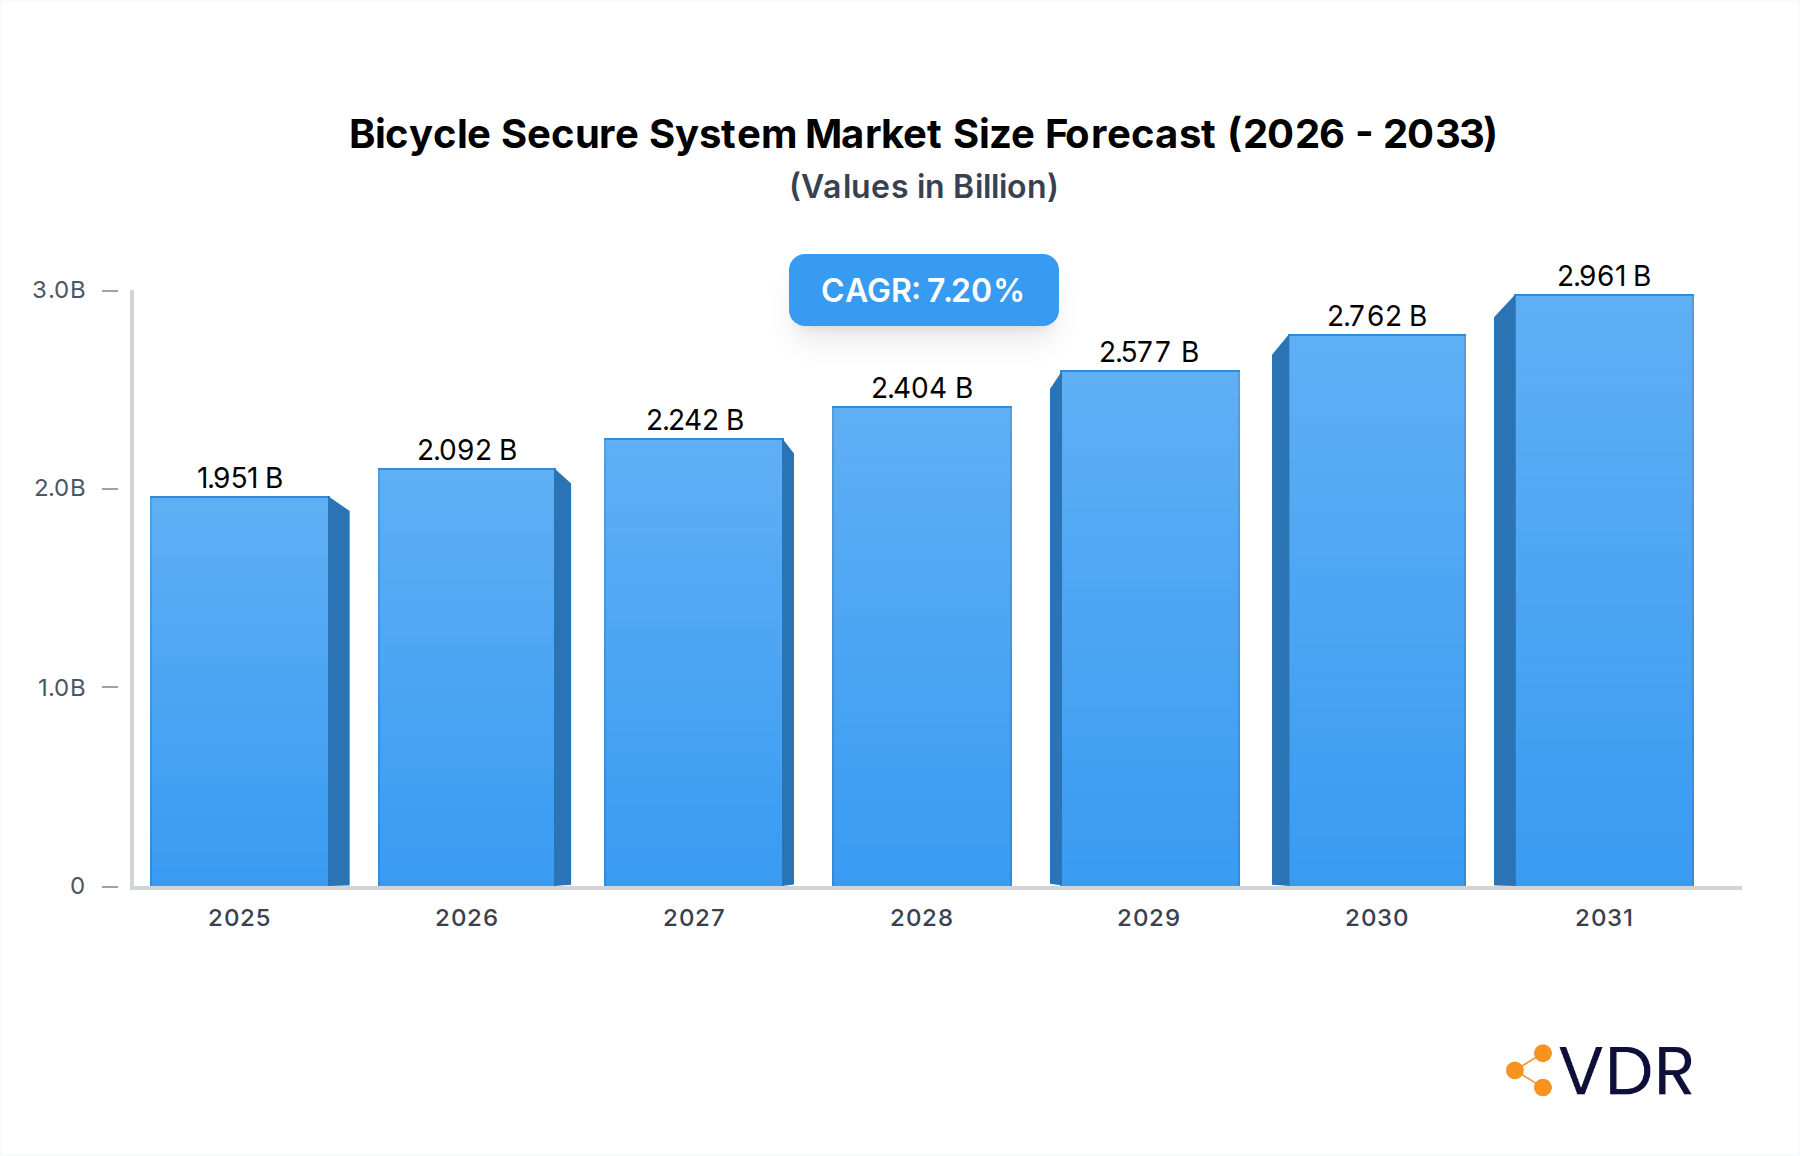
The Bicycle Secure System Market, a critical component of the broader Personal Mobility Market, is poised for robust expansion driven by increasing global cycling participation and escalating theft rates. Valued at an estimated $1.82 billion in 2025, the market is projected to reach approximately $3.18 billion by 2033, demonstrating a compelling Compound Annual Growth Rate (CAGR) of 7.2% over the forecast period. This growth is predominantly fueled by a confluence of factors including urbanization, a heightened focus on sustainable transportation, and the rapid integration of advanced technologies like the Internet of Things (IoT) and GPS tracking into security solutions. The increasing adoption of electric bicycles, which represent higher-value assets, further accentuates the demand for sophisticated security measures. Regional dynamics indicate Asia Pacific as the fastest-growing market, propelled by expanding cycling infrastructure and rising disposable incomes. Conversely, Europe, a mature market with a deeply ingrained cycling culture, continues to command a significant revenue share, emphasizing premium and smart solutions. The competitive landscape is characterized by a mix of established lock manufacturers, emerging tech startups, and bicycle component providers, all striving to innovate and differentiate through smart features, enhanced durability, and user-friendly designs. The proliferation of the Smart Security Systems Market within this sector, encompassing features like remote monitoring, tamper alerts, and integrated alarms, signifies a paradigm shift from traditional mechanical deterrence to proactive, connected protection. Simultaneously, the GPS Tracking Systems Market is witnessing substantial traction, offering critical recovery capabilities post-theft. Strategic investments in R&D, particularly in areas like advanced material science for improved lock resistance and sophisticated algorithms for motion detection and anti-tamper functionalities, are paramount for maintaining competitive advantage. The future trajectory of the Bicycle Secure System Market is inextricably linked to technological evolution, consumer demand for enhanced asset protection, and the ongoing global shift towards cycling as a primary mode of transport and recreation. Furthermore, the growth in the Online Retail Market is democratizing access to a wider array of security products, enabling direct-to-consumer models that foster innovation and competitive pricing across the sector.
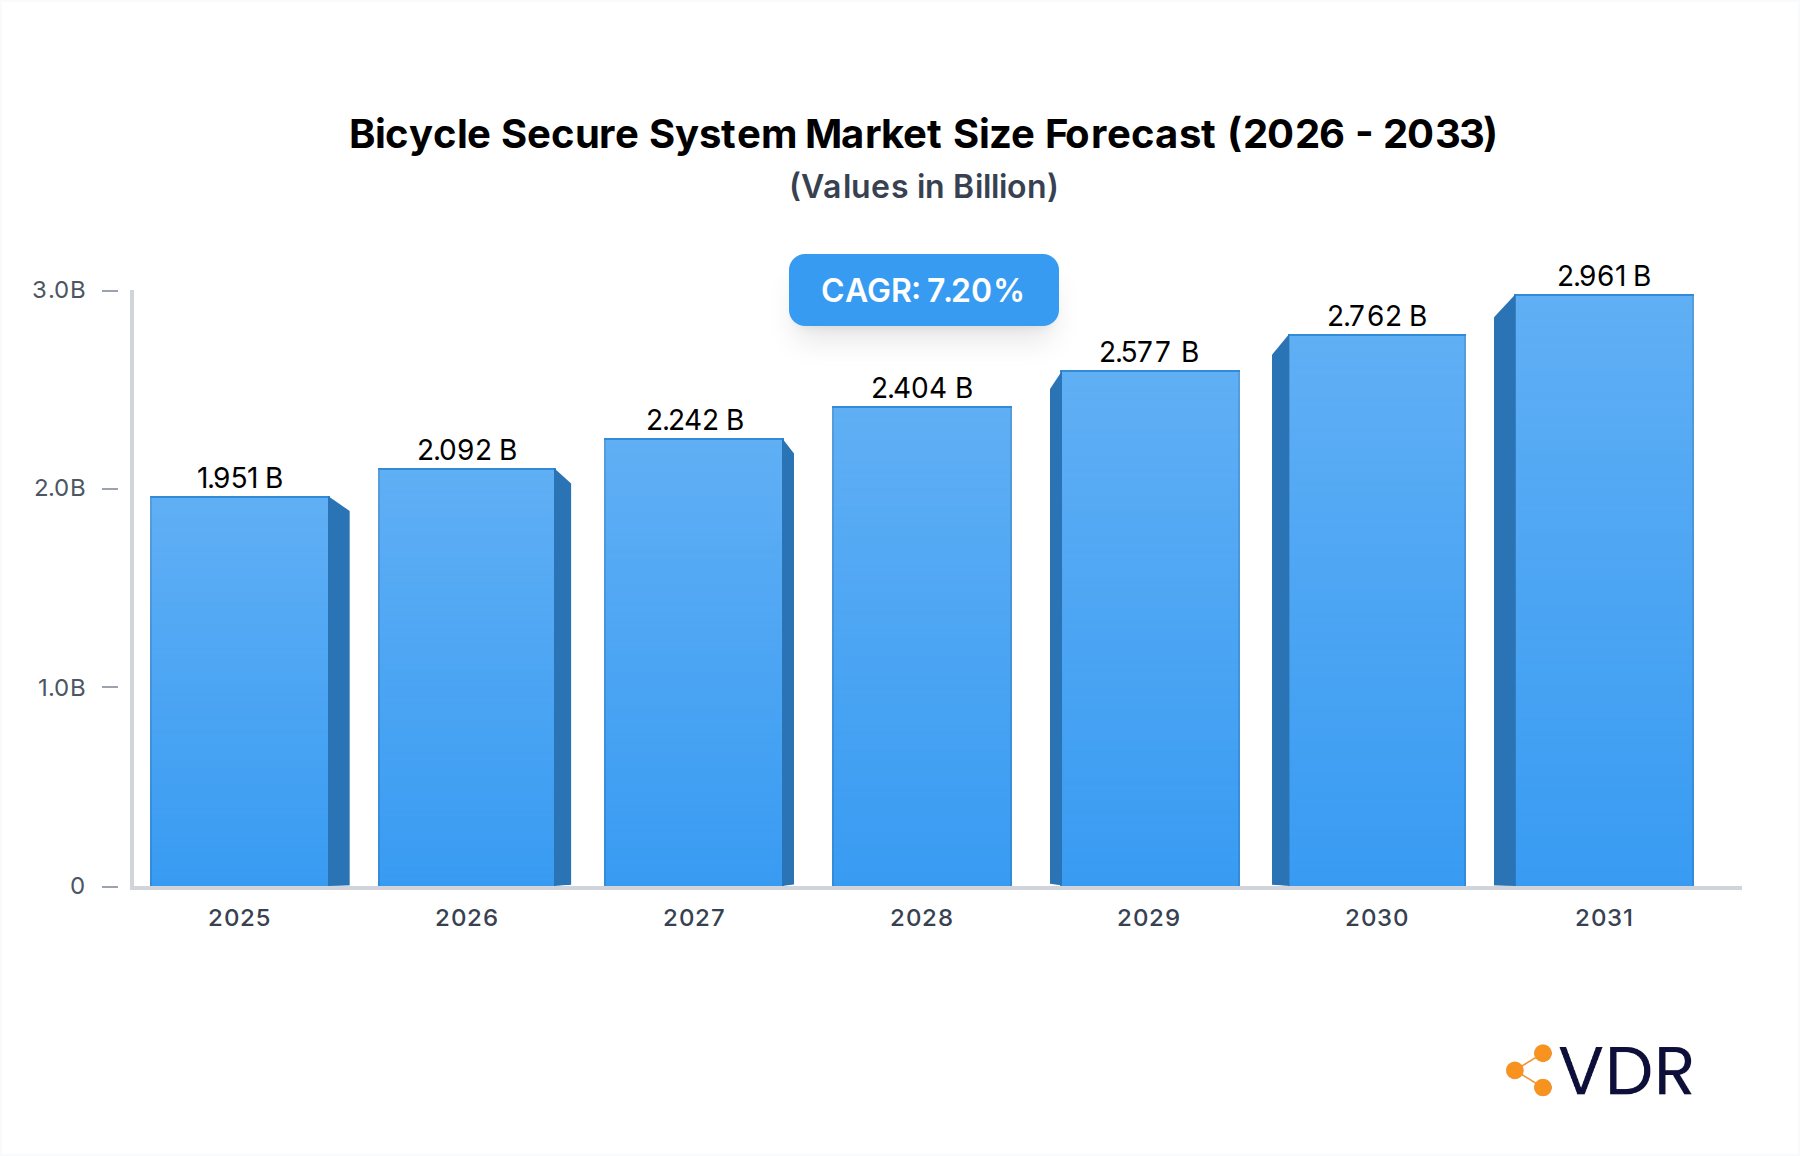
Bicycle Secure System Market Size (In Billion)

Locks Segment Dominance in Bicycle Secure System Market
The Locks segment, encompassing U-locks Market, chain locks, folding locks, and cable locks, firmly maintains its position as the largest revenue contributor within the Bicycle Secure System Market. This dominance is intrinsically linked to its foundational role as the primary physical deterrent against bicycle theft. Historically, mechanical locks have been the first line of defense, offering a tangible barrier that complicates or prevents unauthorized removal of a bicycle. The sheer volume of traditional bicycles globally necessitates a vast demand for these basic, yet essential, security tools. While smart technologies are rapidly emerging, the reliability, cost-effectiveness, and simplicity of use associated with mechanical locks ensure their enduring prevalence. Within this segment, U-locks are particularly prominent due to their robust construction and resistance to common cutting tools, making them a preferred choice for urban cyclists. Chain locks offer versatility in securing a bicycle to various immovable objects, while folding locks provide a balance of security and portability. Cable locks, though offering lower security, are popular for their lightweight and flexible nature, often used for quick stops or as secondary security. The sustained growth of the Cycling Accessories Market underscores the continuous demand for these fundamental security solutions. Key players in this segment, such as ABUS August Bremicker Söhne KG, Kryptonite (Allegion), and Master Lock, continuously innovate through advanced material science, pick-resistant cylinders, and integrated alarm features, even within mechanical designs. The market share of traditional locks remains significant, though there is a perceptible shift towards electronic and smart lock variations that integrate into the broader Smart Security Systems Market. Despite the rise of digital solutions, the physical security offered by locks remains non-negotiable for most consumers. Moreover, their universal compatibility with nearly all bicycle types, from entry-level commuters to high-end e-bikes, ensures a consistently broad application base. Manufacturers are also focusing on ergonomic designs and ease of carry, understanding that user convenience is a crucial factor in adoption. As the Bicycle Secure System Market evolves, the Locks segment is not merely consolidating its share but is also adapting, incorporating advanced materials and design principles to remain the bedrock of bicycle security.
Bicycle Secure System Company Market Share
Key Market Drivers in Bicycle Secure System Market
The Bicycle Secure System Market is propelled by several quantifiable drivers that underscore the necessity and adoption of advanced security solutions. A primary driver is the demonstrable increase in global bicycle usage, with organizations such as the World Health Organization reporting a surge in cycling for both commuting and recreation, especially in urban centers. This increased usage translates directly into a larger asset base requiring protection. Concurrently, rising bicycle theft rates worldwide act as a significant impetus. For instance, police reports in major cities often indicate tens of thousands of bicycle thefts annually, creating a pervasive fear among owners and driving demand for more effective deterrents. The average value of stolen bicycles has also increased, particularly with the proliferation of e-bikes, which can cost upwards of several thousand dollars, thus justifying greater investment in sophisticated security systems. This trend directly benefits the Commercial Security Market and the Personal Mobility Market as a whole, as cities and individuals seek to protect valuable assets. Moreover, technological advancements, especially in the IoT Connectivity Market and Sensor Technology Market, are transforming the market. The integration of GPS tracking, smart alarm systems, and remote monitoring capabilities offers unparalleled security features. These innovations move beyond simple deterrence to enable real-time tracking and recovery, greatly enhancing the value proposition of secure systems. The development of advanced materials, offering greater resistance to cutting and picking tools, further contributes to market growth by improving the efficacy and perceived reliability of locks. The continuous innovation in the Smart Security Systems Market and GPS Tracking Systems Market is creating premium segments, appealing to consumers willing to invest in high-tech protection for their bicycles. Finally, supportive governmental initiatives promoting cycling as a sustainable transport mode in urban planning also indirectly boost demand for security, as more people are encouraged to cycle, increasing the overall need for bicycle security measures.
Competitive Ecosystem of Bicycle Secure System Market
The Bicycle Secure System Market features a diverse competitive landscape, ranging from long-established lock manufacturers to innovative tech startups specializing in smart security:
- ABUS August Bremicker Söhne KG: A German security product manufacturer renowned for its high-quality mechanical locks, including U-locks and chain locks, with a strong focus on engineering and durability for bicycle security.
- Kryptonite (Allegion): A leading brand, particularly in North America, known for its robust bicycle locks, including U-locks and flexible cables, continuously innovating with security ratings and anti-theft protection programs.
- Hiplok: Specializes in wearable bicycle locks, offering innovative designs like chain locks that can be worn around the waist, blending security with rider convenience and style.
- Giant: As one of the world's largest bicycle manufacturers, Giant also offers a range of bicycle accessories, including integrated and standalone security systems for its vast customer base.
- Schlage: Primarily known for its residential and commercial door locks, Schlage's expertise in locking mechanisms occasionally extends to specialized secure systems for various applications, including bicycle security components.
- Sena Technologies: Focuses on advanced communication systems for cyclists, but their expertise in connectivity and smart technology positions them to potentially integrate smart security features into their broader product offerings.
- Trek Bicycle Corporation: A major bicycle manufacturer that, like Giant, provides a suite of cycling accessories, including security devices, designed to complement their bicycle lines and offer integrated solutions.
- Axa Bike Security: A Dutch company specializing exclusively in bicycle locks and lighting, known for its frame locks, chain locks, and integrated security solutions, particularly strong in European markets.
- Master Lock: A globally recognized brand in security, offering a wide array of padlocks and specialty locks, including robust cable and U-locks designed for bicycle protection.
- Fly12 Bike Alarm: A brand associated with integrated cycling cameras and lights that also incorporate alarm functionalities, moving towards multi-functional smart security solutions for bicycles.
- Skylock: An innovator in the smart bicycle lock space, offering keyless entry, crash detection, and GPS tracking, representing the cutting edge of the Smart Security Systems Market.
- Litelok: Known for its lightweight, flexible, and high-security bicycle locks, utilizing advanced composite materials to offer substantial theft resistance without the bulk of traditional heavy locks.
- Lock8: A smart lock company focusing on IoT-enabled solutions for bicycles, integrating GPS tracking and remote monitoring, catering to the burgeoning demand for connected security.
- Bike Angel: Offers GPS tracking and recovery services specifically for bicycles, providing a robust solution for post-theft asset recovery, crucial for the GPS Tracking Systems Market.
- Yerka Bike: Unique for its bicycle design where the frame itself transforms into a U-lock, demonstrating a fundamental rethinking of integrated bicycle security.
Recent Developments & Milestones in Bicycle Secure System Market
January 2023: Leading smart lock manufacturer introduced a new line of smart U-locks featuring advanced biometric fingerprint scanning and enhanced tamper-proof alarms, aimed at the premium segment of the Bicycle Secure System Market. These products offer seamless integration with smartphone apps for remote monitoring and keyless access. March 2023: A prominent cycling accessories brand announced a strategic partnership with a telecommunications provider to integrate 5G IoT modules into their next-generation GPS Tracking Systems Market devices. This collaboration aims to provide more reliable and faster location data for stolen bicycle recovery. May 2023: A significant investment round was closed by a startup specializing in blockchain-secured bicycle registration and ownership verification. This technology seeks to deter theft by making stolen bikes traceable and difficult to resell, impacting the broader Personal Mobility Market for asset security. August 2023: An industry consortium of bicycle manufacturers and security providers published new standards for e-bike security, recommending higher security ratings for locks and mandating integrated alarm systems for high-value models. This regulatory push is expected to drive demand for more sophisticated security solutions. November 2023: A major player in the Cycling Accessories Market launched a crowdfunding campaign for a new 'folding lock' that combines lightweight composite materials with advanced locking mechanisms, exceeding current security standards while maintaining portability. February 2024: Several European cities initiated pilot programs for shared micro-mobility schemes that incorporate advanced anti-theft technologies, including integrated smart locks with geo-fencing capabilities, showcasing the evolving Commercial Security Market applications in urban environments. April 2024: A new type of Sensor Technology Market based on vibration and accelerometer inputs was introduced, capable of differentiating between accidental bumps and genuine theft attempts, significantly reducing false alarms in bicycle security systems.
Regional Market Breakdown for Bicycle Secure System Market
The Bicycle Secure System Market exhibits distinct regional dynamics, influenced by varying cycling cultures, urbanization levels, and economic conditions across key geographies.
Europe currently represents the largest revenue share in the global Bicycle Secure System Market. This dominance is driven by a deeply ingrained cycling culture, extensive cycling infrastructure, and strong governmental emphasis on sustainable urban transportation. Countries like Germany, the Netherlands, and Denmark have high bicycle ownership rates, leading to consistent demand for high-quality, often premium, security solutions. The market here is relatively mature, with a CAGR estimated around 6.8%, focusing on innovation in smart locks and integration with urban mobility ecosystems.
Asia Pacific is projected to be the fastest-growing region, with an estimated CAGR of 8.5% over the forecast period. This rapid expansion is primarily fueled by accelerated urbanization, rising disposable incomes, and a booming demand for bicycles and e-bikes in populous countries like China, India, and Japan. The region's growth is also supported by government initiatives promoting cycling to alleviate traffic congestion and reduce pollution. The increasing adoption of Smart Security Systems Market and GPS Tracking Systems Market in this region indicates a shift towards technologically advanced solutions.
North America holds a significant share of the Bicycle Secure System Market, characterized by a substantial recreational cycling community and growing urban commuting trends in metropolitan areas. The demand here is diversified, spanning from robust mechanical U-locks Market for daily commuters to advanced electronic and GPS-enabled systems for high-value road and mountain bikes. The region's market is expected to grow at a CAGR of approximately 7.0%, driven by consumer readiness to adopt new technologies and the pervasive issue of bicycle theft in major cities.
Middle East & Africa and South America collectively represent emerging markets. While currently smaller in market share, these regions are experiencing increasing bicycle adoption for both leisure and commuting, particularly in rapidly developing urban centers. The demand is currently more focused on traditional mechanical locks due to cost considerations, but there is nascent growth in smart solutions as economic development progresses. The drivers include improving infrastructure and rising awareness of cycling benefits. These regions hold considerable long-term potential for the Bicycle Secure System Market.
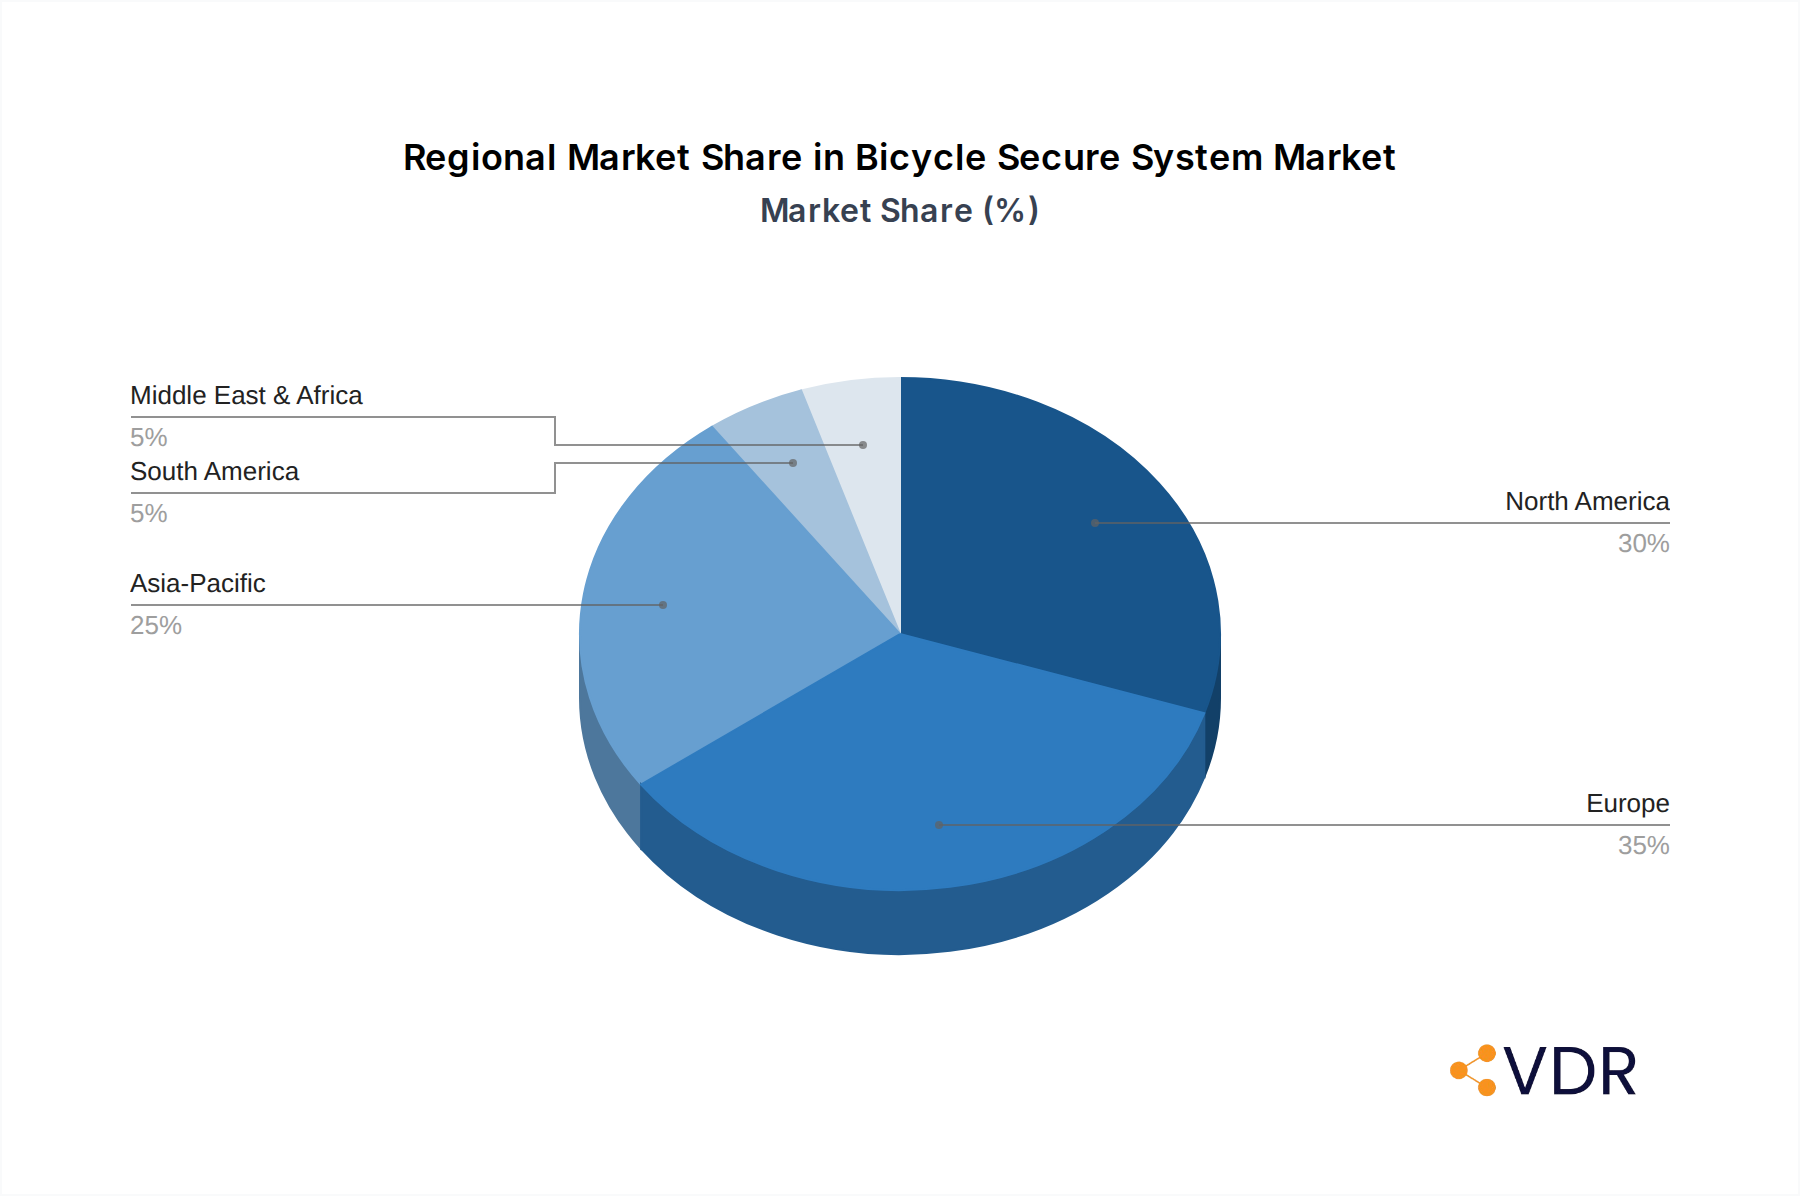
Bicycle Secure System Regional Market Share
Investment & Funding Activity in Bicycle Secure System Market
Investment and funding activity within the Bicycle Secure System Market has seen a discernible uptick in recent years, largely directed towards startups and companies specializing in smart, connected solutions. Venture capital firms and private equity funds are increasingly keen on disruptive technologies that integrate into the broader IoT Connectivity Market. A significant trend is the focus on integrated systems that combine physical deterrence with digital capabilities. For example, several smart lock companies received substantial seed and Series A funding rounds in 2023 and 2024, attracting capital for R&D in biometric authentication, secure communication protocols, and cloud-based tracking platforms. Mergers and acquisitions have been less frequent but strategic, often involving traditional lock manufacturers acquiring or partnering with tech startups to quickly integrate smart functionalities into their product portfolios, thereby expanding their reach in the Smart Security Systems Market. For instance, a major European lock brand acquired a nascent GPS tracking startup in late 2022 to enhance its offerings within the GPS Tracking Systems Market. Furthermore, investment is flowing into solutions that address the growing e-bike market, recognizing the higher asset value and the need for more robust, integrated security. Funding rounds have also supported innovations in anti-theft insurance models and digital ownership registries, indicating a holistic approach to bicycle security beyond just the physical device. The consistent growth in the Personal Mobility Market has made the bicycle security sector an attractive proposition for investors seeking opportunities in sustainable urban living and asset protection technologies.
Technology Innovation Trajectory in Bicycle Secure System Market
The Bicycle Secure System Market is undergoing a profound transformation driven by several disruptive technologies, fundamentally altering how bicycles are protected. The trajectory of innovation is moving away from purely mechanical solutions towards integrated, intelligent, and connected systems.
One of the most disruptive technologies is the Integration of IoT and AI for Predictive Security. This involves embedding Sensor Technology Market within locks and bicycles that leverage IoT connectivity to monitor various parameters like motion, location, and tamper attempts in real-time. AI algorithms then analyze this data to differentiate between benign interactions (e.g., accidental bumps) and genuine theft attempts, significantly reducing false alarms. Adoption timelines for these advanced AI-driven systems are accelerating, with high-end e-bikes and premium Cycling Accessories Market already incorporating such features. R&D investments are substantial, focusing on miniaturization, power efficiency, and robust data encryption. This technology threatens incumbent mechanical lock manufacturers by offering a proactive, rather than reactive, security posture, forcing them to either innovate or risk market share erosion.
Another critical innovation is the rise of Advanced GPS and LoRaWAN Tracking Systems. While GPS Tracking Systems Market have existed, the newer generation leverages low-power wide-area networks (LPWAN) like LoRaWAN, offering extended battery life (months to years) and superior penetration in urban environments (e.g., underground parking). These systems provide precise location data for stolen bicycle recovery, often integrated into the broader Smart Security Systems Market via smartphone applications. Adoption is rapidly increasing, particularly with the growth of high-value e-bikes and urban bike-sharing schemes. R&D is focused on improving accuracy, reducing device size, and enhancing network coverage. These systems reinforce the business models of tracking service providers and pose a direct challenge to the effectiveness of traditional locks alone, as they provide a recovery option post-theft, which mechanical locks cannot.
Bicycle Secure System Segmentation
-
1. Product Type
- 1.1. Locks
- 1.2. Alarms
- 1.3. GPS Tracking Systems
- 1.4. Smart Security Systems
-
2. Mechanism Type
- 2.1. U-locks
- 2.2. Chain locks
- 2.3. Folding locks
- 2.4. Cable locks
-
3. Traditional
- 3.1. Traditional Mechanical
- 3.2. Electronic
- 3.3. Smart Lock
-
4. Distributiuon Channel
- 4.1. Supermarkets/Hypermarkets
- 4.2. Specialty Stores
- 4.3. Online
-
5. End User
- 5.1. Individual Consumers
- 5.2. Commercial Users
- 5.3. Cycling Organizations
Bicycle Secure System Segmentation By Geography
-
1. North America
- 1.1. United States
- 1.2. Canada
- 1.3. Mexico
-
2. South America
- 2.1. Brazil
- 2.2. Argentina
- 2.3. Rest of South America
-
3. Europe
- 3.1. United Kingdom
- 3.2. Germany
- 3.3. France
- 3.4. Italy
- 3.5. Spain
- 3.6. Russia
- 3.7. Benelux
- 3.8. Nordics
- 3.9. Rest of Europe
-
4. Middle East & Africa
- 4.1. Turkey
- 4.2. Israel
- 4.3. GCC
- 4.4. North Africa
- 4.5. South Africa
- 4.6. Rest of Middle East & Africa
-
5. Asia Pacific
- 5.1. China
- 5.2. India
- 5.3. Japan
- 5.4. South Korea
- 5.5. ASEAN
- 5.6. Oceania
- 5.7. Rest of Asia Pacific
Bicycle Secure System Regional Market Share
Geographic Coverage of Bicycle Secure System
Bicycle Secure System REPORT HIGHLIGHTS
| Aspects | Details |
|---|---|
| Study Period | 2020-2034 |
| Base Year | 2025 |
| Estimated Year | 2026 |
| Forecast Period | 2026-2034 |
| Historical Period | 2020-2025 |
| Growth Rate | CAGR of 7.2% from 2020-2034 |
| Segmentation |
|
Table of Contents
- 1. Introduction
- 1.1. Research Scope
- 1.2. Market Segmentation
- 1.3. Research Objective
- 1.4. Definitions and Assumptions
- 2. Executive Summary
- 2.1. Market Snapshot
- 3. Market Dynamics
- 3.1. Market Drivers
- 3.2. Market Restrains
- 3.3. Market Trends
- 3.4. Market Opportunities
- 4. Market Factor Analysis
- 4.1. Porters Five Forces
- 4.1.1. Bargaining Power of Suppliers
- 4.1.2. Bargaining Power of Buyers
- 4.1.3. Threat of New Entrants
- 4.1.4. Threat of Substitutes
- 4.1.5. Competitive Rivalry
- 4.2. PESTEL analysis
- 4.3. BCG Analysis
- 4.3.1. Stars (High Growth, High Market Share)
- 4.3.2. Cash Cows (Low Growth, High Market Share)
- 4.3.3. Question Mark (High Growth, Low Market Share)
- 4.3.4. Dogs (Low Growth, Low Market Share)
- 4.4. Ansoff Matrix Analysis
- 4.5. Supply Chain Analysis
- 4.6. Regulatory Landscape
- 4.7. Current Market Potential and Opportunity Assessment (TAM–SAM–SOM Framework)
- 4.8. VDR Analyst Note
- 4.1. Porters Five Forces
- 5. Market Analysis, Insights and Forecast 2021-2033
- 5.1. Market Analysis, Insights and Forecast - by Product Type
- 5.1.1. Locks
- 5.1.2. Alarms
- 5.1.3. GPS Tracking Systems
- 5.1.4. Smart Security Systems
- 5.2. Market Analysis, Insights and Forecast - by Mechanism Type
- 5.2.1. U-locks
- 5.2.2. Chain locks
- 5.2.3. Folding locks
- 5.2.4. Cable locks
- 5.3. Market Analysis, Insights and Forecast - by Traditional
- 5.3.1. Traditional Mechanical
- 5.3.2. Electronic
- 5.3.3. Smart Lock
- 5.4. Market Analysis, Insights and Forecast - by Distributiuon Channel
- 5.4.1. Supermarkets/Hypermarkets
- 5.4.2. Specialty Stores
- 5.4.3. Online
- 5.5. Market Analysis, Insights and Forecast - by End User
- 5.5.1. Individual Consumers
- 5.5.2. Commercial Users
- 5.5.3. Cycling Organizations
- 5.6. Market Analysis, Insights and Forecast - by Region
- 5.6.1. North America
- 5.6.2. South America
- 5.6.3. Europe
- 5.6.4. Middle East & Africa
- 5.6.5. Asia Pacific
- 5.1. Market Analysis, Insights and Forecast - by Product Type
- 6. Global Bicycle Secure System Analysis, Insights and Forecast, 2021-2033
- 6.1. Market Analysis, Insights and Forecast - by Product Type
- 6.1.1. Locks
- 6.1.2. Alarms
- 6.1.3. GPS Tracking Systems
- 6.1.4. Smart Security Systems
- 6.2. Market Analysis, Insights and Forecast - by Mechanism Type
- 6.2.1. U-locks
- 6.2.2. Chain locks
- 6.2.3. Folding locks
- 6.2.4. Cable locks
- 6.3. Market Analysis, Insights and Forecast - by Traditional
- 6.3.1. Traditional Mechanical
- 6.3.2. Electronic
- 6.3.3. Smart Lock
- 6.4. Market Analysis, Insights and Forecast - by Distributiuon Channel
- 6.4.1. Supermarkets/Hypermarkets
- 6.4.2. Specialty Stores
- 6.4.3. Online
- 6.5. Market Analysis, Insights and Forecast - by End User
- 6.5.1. Individual Consumers
- 6.5.2. Commercial Users
- 6.5.3. Cycling Organizations
- 6.1. Market Analysis, Insights and Forecast - by Product Type
- 7. North America Bicycle Secure System Analysis, Insights and Forecast, 2021-2033
- 7.1. Market Analysis, Insights and Forecast - by Product Type
- 7.1.1. Locks
- 7.1.2. Alarms
- 7.1.3. GPS Tracking Systems
- 7.1.4. Smart Security Systems
- 7.2. Market Analysis, Insights and Forecast - by Mechanism Type
- 7.2.1. U-locks
- 7.2.2. Chain locks
- 7.2.3. Folding locks
- 7.2.4. Cable locks
- 7.3. Market Analysis, Insights and Forecast - by Traditional
- 7.3.1. Traditional Mechanical
- 7.3.2. Electronic
- 7.3.3. Smart Lock
- 7.4. Market Analysis, Insights and Forecast - by Distributiuon Channel
- 7.4.1. Supermarkets/Hypermarkets
- 7.4.2. Specialty Stores
- 7.4.3. Online
- 7.5. Market Analysis, Insights and Forecast - by End User
- 7.5.1. Individual Consumers
- 7.5.2. Commercial Users
- 7.5.3. Cycling Organizations
- 7.1. Market Analysis, Insights and Forecast - by Product Type
- 8. South America Bicycle Secure System Analysis, Insights and Forecast, 2021-2033
- 8.1. Market Analysis, Insights and Forecast - by Product Type
- 8.1.1. Locks
- 8.1.2. Alarms
- 8.1.3. GPS Tracking Systems
- 8.1.4. Smart Security Systems
- 8.2. Market Analysis, Insights and Forecast - by Mechanism Type
- 8.2.1. U-locks
- 8.2.2. Chain locks
- 8.2.3. Folding locks
- 8.2.4. Cable locks
- 8.3. Market Analysis, Insights and Forecast - by Traditional
- 8.3.1. Traditional Mechanical
- 8.3.2. Electronic
- 8.3.3. Smart Lock
- 8.4. Market Analysis, Insights and Forecast - by Distributiuon Channel
- 8.4.1. Supermarkets/Hypermarkets
- 8.4.2. Specialty Stores
- 8.4.3. Online
- 8.5. Market Analysis, Insights and Forecast - by End User
- 8.5.1. Individual Consumers
- 8.5.2. Commercial Users
- 8.5.3. Cycling Organizations
- 8.1. Market Analysis, Insights and Forecast - by Product Type
- 9. Europe Bicycle Secure System Analysis, Insights and Forecast, 2021-2033
- 9.1. Market Analysis, Insights and Forecast - by Product Type
- 9.1.1. Locks
- 9.1.2. Alarms
- 9.1.3. GPS Tracking Systems
- 9.1.4. Smart Security Systems
- 9.2. Market Analysis, Insights and Forecast - by Mechanism Type
- 9.2.1. U-locks
- 9.2.2. Chain locks
- 9.2.3. Folding locks
- 9.2.4. Cable locks
- 9.3. Market Analysis, Insights and Forecast - by Traditional
- 9.3.1. Traditional Mechanical
- 9.3.2. Electronic
- 9.3.3. Smart Lock
- 9.4. Market Analysis, Insights and Forecast - by Distributiuon Channel
- 9.4.1. Supermarkets/Hypermarkets
- 9.4.2. Specialty Stores
- 9.4.3. Online
- 9.5. Market Analysis, Insights and Forecast - by End User
- 9.5.1. Individual Consumers
- 9.5.2. Commercial Users
- 9.5.3. Cycling Organizations
- 9.1. Market Analysis, Insights and Forecast - by Product Type
- 10. Middle East & Africa Bicycle Secure System Analysis, Insights and Forecast, 2021-2033
- 10.1. Market Analysis, Insights and Forecast - by Product Type
- 10.1.1. Locks
- 10.1.2. Alarms
- 10.1.3. GPS Tracking Systems
- 10.1.4. Smart Security Systems
- 10.2. Market Analysis, Insights and Forecast - by Mechanism Type
- 10.2.1. U-locks
- 10.2.2. Chain locks
- 10.2.3. Folding locks
- 10.2.4. Cable locks
- 10.3. Market Analysis, Insights and Forecast - by Traditional
- 10.3.1. Traditional Mechanical
- 10.3.2. Electronic
- 10.3.3. Smart Lock
- 10.4. Market Analysis, Insights and Forecast - by Distributiuon Channel
- 10.4.1. Supermarkets/Hypermarkets
- 10.4.2. Specialty Stores
- 10.4.3. Online
- 10.5. Market Analysis, Insights and Forecast - by End User
- 10.5.1. Individual Consumers
- 10.5.2. Commercial Users
- 10.5.3. Cycling Organizations
- 10.1. Market Analysis, Insights and Forecast - by Product Type
- 11. Asia Pacific Bicycle Secure System Analysis, Insights and Forecast, 2021-2033
- 11.1. Market Analysis, Insights and Forecast - by Product Type
- 11.1.1. Locks
- 11.1.2. Alarms
- 11.1.3. GPS Tracking Systems
- 11.1.4. Smart Security Systems
- 11.2. Market Analysis, Insights and Forecast - by Mechanism Type
- 11.2.1. U-locks
- 11.2.2. Chain locks
- 11.2.3. Folding locks
- 11.2.4. Cable locks
- 11.3. Market Analysis, Insights and Forecast - by Traditional
- 11.3.1. Traditional Mechanical
- 11.3.2. Electronic
- 11.3.3. Smart Lock
- 11.4. Market Analysis, Insights and Forecast - by Distributiuon Channel
- 11.4.1. Supermarkets/Hypermarkets
- 11.4.2. Specialty Stores
- 11.4.3. Online
- 11.5. Market Analysis, Insights and Forecast - by End User
- 11.5.1. Individual Consumers
- 11.5.2. Commercial Users
- 11.5.3. Cycling Organizations
- 11.1. Market Analysis, Insights and Forecast - by Product Type
- 12. Competitive Analysis
- 12.1. Company Profiles
- 12.1.1 ABUS August Bremicker Söhne KG
- 12.1.1.1. Company Overview
- 12.1.1.2. Products
- 12.1.1.3. Company Financials
- 12.1.1.4. SWOT Analysis
- 12.1.2 Kryptonite (Allegion)
- 12.1.2.1. Company Overview
- 12.1.2.2. Products
- 12.1.2.3. Company Financials
- 12.1.2.4. SWOT Analysis
- 12.1.3 Hiplok
- 12.1.3.1. Company Overview
- 12.1.3.2. Products
- 12.1.3.3. Company Financials
- 12.1.3.4. SWOT Analysis
- 12.1.4 Giant
- 12.1.4.1. Company Overview
- 12.1.4.2. Products
- 12.1.4.3. Company Financials
- 12.1.4.4. SWOT Analysis
- 12.1.5 Schlage
- 12.1.5.1. Company Overview
- 12.1.5.2. Products
- 12.1.5.3. Company Financials
- 12.1.5.4. SWOT Analysis
- 12.1.6 Sena Technologies
- 12.1.6.1. Company Overview
- 12.1.6.2. Products
- 12.1.6.3. Company Financials
- 12.1.6.4. SWOT Analysis
- 12.1.7 Trek Bicycle Corporation
- 12.1.7.1. Company Overview
- 12.1.7.2. Products
- 12.1.7.3. Company Financials
- 12.1.7.4. SWOT Analysis
- 12.1.8 Axa Bike Security
- 12.1.8.1. Company Overview
- 12.1.8.2. Products
- 12.1.8.3. Company Financials
- 12.1.8.4. SWOT Analysis
- 12.1.9 Master Lock
- 12.1.9.1. Company Overview
- 12.1.9.2. Products
- 12.1.9.3. Company Financials
- 12.1.9.4. SWOT Analysis
- 12.1.10 Fly12 Bike Alarm
- 12.1.10.1. Company Overview
- 12.1.10.2. Products
- 12.1.10.3. Company Financials
- 12.1.10.4. SWOT Analysis
- 12.1.11 Skylock
- 12.1.11.1. Company Overview
- 12.1.11.2. Products
- 12.1.11.3. Company Financials
- 12.1.11.4. SWOT Analysis
- 12.1.12 Litelok
- 12.1.12.1. Company Overview
- 12.1.12.2. Products
- 12.1.12.3. Company Financials
- 12.1.12.4. SWOT Analysis
- 12.1.13 Lock8
- 12.1.13.1. Company Overview
- 12.1.13.2. Products
- 12.1.13.3. Company Financials
- 12.1.13.4. SWOT Analysis
- 12.1.14 Bike Angel
- 12.1.14.1. Company Overview
- 12.1.14.2. Products
- 12.1.14.3. Company Financials
- 12.1.14.4. SWOT Analysis
- 12.1.15 Yerka Bike
- 12.1.15.1. Company Overview
- 12.1.15.2. Products
- 12.1.15.3. Company Financials
- 12.1.15.4. SWOT Analysis
- 12.1.16 Others
- 12.1.16.1. Company Overview
- 12.1.16.2. Products
- 12.1.16.3. Company Financials
- 12.1.16.4. SWOT Analysis
- 12.1.1 ABUS August Bremicker Söhne KG
- 12.2. Market Entropy
- 12.2.1 Company's Key Areas Served
- 12.2.2 Recent Developments
- 12.3. Company Market Share Analysis 2025
- 12.3.1 Top 5 Companies Market Share Analysis
- 12.3.2 Top 3 Companies Market Share Analysis
- 12.4. List of Potential Customers
- 13. Research Methodology
List of Figures
- Figure 1: Global Bicycle Secure System Revenue Breakdown (billion, %) by Region 2025 & 2033
- Figure 2: Global Bicycle Secure System Volume Breakdown (K, %) by Region 2025 & 2033
- Figure 3: North America Bicycle Secure System Revenue (billion), by Product Type 2025 & 2033
- Figure 4: North America Bicycle Secure System Volume (K), by Product Type 2025 & 2033
- Figure 5: North America Bicycle Secure System Revenue Share (%), by Product Type 2025 & 2033
- Figure 6: North America Bicycle Secure System Volume Share (%), by Product Type 2025 & 2033
- Figure 7: North America Bicycle Secure System Revenue (billion), by Mechanism Type 2025 & 2033
- Figure 8: North America Bicycle Secure System Volume (K), by Mechanism Type 2025 & 2033
- Figure 9: North America Bicycle Secure System Revenue Share (%), by Mechanism Type 2025 & 2033
- Figure 10: North America Bicycle Secure System Volume Share (%), by Mechanism Type 2025 & 2033
- Figure 11: North America Bicycle Secure System Revenue (billion), by Traditional 2025 & 2033
- Figure 12: North America Bicycle Secure System Volume (K), by Traditional 2025 & 2033
- Figure 13: North America Bicycle Secure System Revenue Share (%), by Traditional 2025 & 2033
- Figure 14: North America Bicycle Secure System Volume Share (%), by Traditional 2025 & 2033
- Figure 15: North America Bicycle Secure System Revenue (billion), by Distributiuon Channel 2025 & 2033
- Figure 16: North America Bicycle Secure System Volume (K), by Distributiuon Channel 2025 & 2033
- Figure 17: North America Bicycle Secure System Revenue Share (%), by Distributiuon Channel 2025 & 2033
- Figure 18: North America Bicycle Secure System Volume Share (%), by Distributiuon Channel 2025 & 2033
- Figure 19: North America Bicycle Secure System Revenue (billion), by End User 2025 & 2033
- Figure 20: North America Bicycle Secure System Volume (K), by End User 2025 & 2033
- Figure 21: North America Bicycle Secure System Revenue Share (%), by End User 2025 & 2033
- Figure 22: North America Bicycle Secure System Volume Share (%), by End User 2025 & 2033
- Figure 23: North America Bicycle Secure System Revenue (billion), by Country 2025 & 2033
- Figure 24: North America Bicycle Secure System Volume (K), by Country 2025 & 2033
- Figure 25: North America Bicycle Secure System Revenue Share (%), by Country 2025 & 2033
- Figure 26: North America Bicycle Secure System Volume Share (%), by Country 2025 & 2033
- Figure 27: South America Bicycle Secure System Revenue (billion), by Product Type 2025 & 2033
- Figure 28: South America Bicycle Secure System Volume (K), by Product Type 2025 & 2033
- Figure 29: South America Bicycle Secure System Revenue Share (%), by Product Type 2025 & 2033
- Figure 30: South America Bicycle Secure System Volume Share (%), by Product Type 2025 & 2033
- Figure 31: South America Bicycle Secure System Revenue (billion), by Mechanism Type 2025 & 2033
- Figure 32: South America Bicycle Secure System Volume (K), by Mechanism Type 2025 & 2033
- Figure 33: South America Bicycle Secure System Revenue Share (%), by Mechanism Type 2025 & 2033
- Figure 34: South America Bicycle Secure System Volume Share (%), by Mechanism Type 2025 & 2033
- Figure 35: South America Bicycle Secure System Revenue (billion), by Traditional 2025 & 2033
- Figure 36: South America Bicycle Secure System Volume (K), by Traditional 2025 & 2033
- Figure 37: South America Bicycle Secure System Revenue Share (%), by Traditional 2025 & 2033
- Figure 38: South America Bicycle Secure System Volume Share (%), by Traditional 2025 & 2033
- Figure 39: South America Bicycle Secure System Revenue (billion), by Distributiuon Channel 2025 & 2033
- Figure 40: South America Bicycle Secure System Volume (K), by Distributiuon Channel 2025 & 2033
- Figure 41: South America Bicycle Secure System Revenue Share (%), by Distributiuon Channel 2025 & 2033
- Figure 42: South America Bicycle Secure System Volume Share (%), by Distributiuon Channel 2025 & 2033
- Figure 43: South America Bicycle Secure System Revenue (billion), by End User 2025 & 2033
- Figure 44: South America Bicycle Secure System Volume (K), by End User 2025 & 2033
- Figure 45: South America Bicycle Secure System Revenue Share (%), by End User 2025 & 2033
- Figure 46: South America Bicycle Secure System Volume Share (%), by End User 2025 & 2033
- Figure 47: South America Bicycle Secure System Revenue (billion), by Country 2025 & 2033
- Figure 48: South America Bicycle Secure System Volume (K), by Country 2025 & 2033
- Figure 49: South America Bicycle Secure System Revenue Share (%), by Country 2025 & 2033
- Figure 50: South America Bicycle Secure System Volume Share (%), by Country 2025 & 2033
- Figure 51: Europe Bicycle Secure System Revenue (billion), by Product Type 2025 & 2033
- Figure 52: Europe Bicycle Secure System Volume (K), by Product Type 2025 & 2033
- Figure 53: Europe Bicycle Secure System Revenue Share (%), by Product Type 2025 & 2033
- Figure 54: Europe Bicycle Secure System Volume Share (%), by Product Type 2025 & 2033
- Figure 55: Europe Bicycle Secure System Revenue (billion), by Mechanism Type 2025 & 2033
- Figure 56: Europe Bicycle Secure System Volume (K), by Mechanism Type 2025 & 2033
- Figure 57: Europe Bicycle Secure System Revenue Share (%), by Mechanism Type 2025 & 2033
- Figure 58: Europe Bicycle Secure System Volume Share (%), by Mechanism Type 2025 & 2033
- Figure 59: Europe Bicycle Secure System Revenue (billion), by Traditional 2025 & 2033
- Figure 60: Europe Bicycle Secure System Volume (K), by Traditional 2025 & 2033
- Figure 61: Europe Bicycle Secure System Revenue Share (%), by Traditional 2025 & 2033
- Figure 62: Europe Bicycle Secure System Volume Share (%), by Traditional 2025 & 2033
- Figure 63: Europe Bicycle Secure System Revenue (billion), by Distributiuon Channel 2025 & 2033
- Figure 64: Europe Bicycle Secure System Volume (K), by Distributiuon Channel 2025 & 2033
- Figure 65: Europe Bicycle Secure System Revenue Share (%), by Distributiuon Channel 2025 & 2033
- Figure 66: Europe Bicycle Secure System Volume Share (%), by Distributiuon Channel 2025 & 2033
- Figure 67: Europe Bicycle Secure System Revenue (billion), by End User 2025 & 2033
- Figure 68: Europe Bicycle Secure System Volume (K), by End User 2025 & 2033
- Figure 69: Europe Bicycle Secure System Revenue Share (%), by End User 2025 & 2033
- Figure 70: Europe Bicycle Secure System Volume Share (%), by End User 2025 & 2033
- Figure 71: Europe Bicycle Secure System Revenue (billion), by Country 2025 & 2033
- Figure 72: Europe Bicycle Secure System Volume (K), by Country 2025 & 2033
- Figure 73: Europe Bicycle Secure System Revenue Share (%), by Country 2025 & 2033
- Figure 74: Europe Bicycle Secure System Volume Share (%), by Country 2025 & 2033
- Figure 75: Middle East & Africa Bicycle Secure System Revenue (billion), by Product Type 2025 & 2033
- Figure 76: Middle East & Africa Bicycle Secure System Volume (K), by Product Type 2025 & 2033
- Figure 77: Middle East & Africa Bicycle Secure System Revenue Share (%), by Product Type 2025 & 2033
- Figure 78: Middle East & Africa Bicycle Secure System Volume Share (%), by Product Type 2025 & 2033
- Figure 79: Middle East & Africa Bicycle Secure System Revenue (billion), by Mechanism Type 2025 & 2033
- Figure 80: Middle East & Africa Bicycle Secure System Volume (K), by Mechanism Type 2025 & 2033
- Figure 81: Middle East & Africa Bicycle Secure System Revenue Share (%), by Mechanism Type 2025 & 2033
- Figure 82: Middle East & Africa Bicycle Secure System Volume Share (%), by Mechanism Type 2025 & 2033
- Figure 83: Middle East & Africa Bicycle Secure System Revenue (billion), by Traditional 2025 & 2033
- Figure 84: Middle East & Africa Bicycle Secure System Volume (K), by Traditional 2025 & 2033
- Figure 85: Middle East & Africa Bicycle Secure System Revenue Share (%), by Traditional 2025 & 2033
- Figure 86: Middle East & Africa Bicycle Secure System Volume Share (%), by Traditional 2025 & 2033
- Figure 87: Middle East & Africa Bicycle Secure System Revenue (billion), by Distributiuon Channel 2025 & 2033
- Figure 88: Middle East & Africa Bicycle Secure System Volume (K), by Distributiuon Channel 2025 & 2033
- Figure 89: Middle East & Africa Bicycle Secure System Revenue Share (%), by Distributiuon Channel 2025 & 2033
- Figure 90: Middle East & Africa Bicycle Secure System Volume Share (%), by Distributiuon Channel 2025 & 2033
- Figure 91: Middle East & Africa Bicycle Secure System Revenue (billion), by End User 2025 & 2033
- Figure 92: Middle East & Africa Bicycle Secure System Volume (K), by End User 2025 & 2033
- Figure 93: Middle East & Africa Bicycle Secure System Revenue Share (%), by End User 2025 & 2033
- Figure 94: Middle East & Africa Bicycle Secure System Volume Share (%), by End User 2025 & 2033
- Figure 95: Middle East & Africa Bicycle Secure System Revenue (billion), by Country 2025 & 2033
- Figure 96: Middle East & Africa Bicycle Secure System Volume (K), by Country 2025 & 2033
- Figure 97: Middle East & Africa Bicycle Secure System Revenue Share (%), by Country 2025 & 2033
- Figure 98: Middle East & Africa Bicycle Secure System Volume Share (%), by Country 2025 & 2033
- Figure 99: Asia Pacific Bicycle Secure System Revenue (billion), by Product Type 2025 & 2033
- Figure 100: Asia Pacific Bicycle Secure System Volume (K), by Product Type 2025 & 2033
- Figure 101: Asia Pacific Bicycle Secure System Revenue Share (%), by Product Type 2025 & 2033
- Figure 102: Asia Pacific Bicycle Secure System Volume Share (%), by Product Type 2025 & 2033
- Figure 103: Asia Pacific Bicycle Secure System Revenue (billion), by Mechanism Type 2025 & 2033
- Figure 104: Asia Pacific Bicycle Secure System Volume (K), by Mechanism Type 2025 & 2033
- Figure 105: Asia Pacific Bicycle Secure System Revenue Share (%), by Mechanism Type 2025 & 2033
- Figure 106: Asia Pacific Bicycle Secure System Volume Share (%), by Mechanism Type 2025 & 2033
- Figure 107: Asia Pacific Bicycle Secure System Revenue (billion), by Traditional 2025 & 2033
- Figure 108: Asia Pacific Bicycle Secure System Volume (K), by Traditional 2025 & 2033
- Figure 109: Asia Pacific Bicycle Secure System Revenue Share (%), by Traditional 2025 & 2033
- Figure 110: Asia Pacific Bicycle Secure System Volume Share (%), by Traditional 2025 & 2033
- Figure 111: Asia Pacific Bicycle Secure System Revenue (billion), by Distributiuon Channel 2025 & 2033
- Figure 112: Asia Pacific Bicycle Secure System Volume (K), by Distributiuon Channel 2025 & 2033
- Figure 113: Asia Pacific Bicycle Secure System Revenue Share (%), by Distributiuon Channel 2025 & 2033
- Figure 114: Asia Pacific Bicycle Secure System Volume Share (%), by Distributiuon Channel 2025 & 2033
- Figure 115: Asia Pacific Bicycle Secure System Revenue (billion), by End User 2025 & 2033
- Figure 116: Asia Pacific Bicycle Secure System Volume (K), by End User 2025 & 2033
- Figure 117: Asia Pacific Bicycle Secure System Revenue Share (%), by End User 2025 & 2033
- Figure 118: Asia Pacific Bicycle Secure System Volume Share (%), by End User 2025 & 2033
- Figure 119: Asia Pacific Bicycle Secure System Revenue (billion), by Country 2025 & 2033
- Figure 120: Asia Pacific Bicycle Secure System Volume (K), by Country 2025 & 2033
- Figure 121: Asia Pacific Bicycle Secure System Revenue Share (%), by Country 2025 & 2033
- Figure 122: Asia Pacific Bicycle Secure System Volume Share (%), by Country 2025 & 2033
List of Tables
- Table 1: Global Bicycle Secure System Revenue billion Forecast, by Product Type 2020 & 2033
- Table 2: Global Bicycle Secure System Volume K Forecast, by Product Type 2020 & 2033
- Table 3: Global Bicycle Secure System Revenue billion Forecast, by Mechanism Type 2020 & 2033
- Table 4: Global Bicycle Secure System Volume K Forecast, by Mechanism Type 2020 & 2033
- Table 5: Global Bicycle Secure System Revenue billion Forecast, by Traditional 2020 & 2033
- Table 6: Global Bicycle Secure System Volume K Forecast, by Traditional 2020 & 2033
- Table 7: Global Bicycle Secure System Revenue billion Forecast, by Distributiuon Channel 2020 & 2033
- Table 8: Global Bicycle Secure System Volume K Forecast, by Distributiuon Channel 2020 & 2033
- Table 9: Global Bicycle Secure System Revenue billion Forecast, by End User 2020 & 2033
- Table 10: Global Bicycle Secure System Volume K Forecast, by End User 2020 & 2033
- Table 11: Global Bicycle Secure System Revenue billion Forecast, by Region 2020 & 2033
- Table 12: Global Bicycle Secure System Volume K Forecast, by Region 2020 & 2033
- Table 13: Global Bicycle Secure System Revenue billion Forecast, by Product Type 2020 & 2033
- Table 14: Global Bicycle Secure System Volume K Forecast, by Product Type 2020 & 2033
- Table 15: Global Bicycle Secure System Revenue billion Forecast, by Mechanism Type 2020 & 2033
- Table 16: Global Bicycle Secure System Volume K Forecast, by Mechanism Type 2020 & 2033
- Table 17: Global Bicycle Secure System Revenue billion Forecast, by Traditional 2020 & 2033
- Table 18: Global Bicycle Secure System Volume K Forecast, by Traditional 2020 & 2033
- Table 19: Global Bicycle Secure System Revenue billion Forecast, by Distributiuon Channel 2020 & 2033
- Table 20: Global Bicycle Secure System Volume K Forecast, by Distributiuon Channel 2020 & 2033
- Table 21: Global Bicycle Secure System Revenue billion Forecast, by End User 2020 & 2033
- Table 22: Global Bicycle Secure System Volume K Forecast, by End User 2020 & 2033
- Table 23: Global Bicycle Secure System Revenue billion Forecast, by Country 2020 & 2033
- Table 24: Global Bicycle Secure System Volume K Forecast, by Country 2020 & 2033
- Table 25: United States Bicycle Secure System Revenue (billion) Forecast, by Application 2020 & 2033
- Table 26: United States Bicycle Secure System Volume (K) Forecast, by Application 2020 & 2033
- Table 27: Canada Bicycle Secure System Revenue (billion) Forecast, by Application 2020 & 2033
- Table 28: Canada Bicycle Secure System Volume (K) Forecast, by Application 2020 & 2033
- Table 29: Mexico Bicycle Secure System Revenue (billion) Forecast, by Application 2020 & 2033
- Table 30: Mexico Bicycle Secure System Volume (K) Forecast, by Application 2020 & 2033
- Table 31: Global Bicycle Secure System Revenue billion Forecast, by Product Type 2020 & 2033
- Table 32: Global Bicycle Secure System Volume K Forecast, by Product Type 2020 & 2033
- Table 33: Global Bicycle Secure System Revenue billion Forecast, by Mechanism Type 2020 & 2033
- Table 34: Global Bicycle Secure System Volume K Forecast, by Mechanism Type 2020 & 2033
- Table 35: Global Bicycle Secure System Revenue billion Forecast, by Traditional 2020 & 2033
- Table 36: Global Bicycle Secure System Volume K Forecast, by Traditional 2020 & 2033
- Table 37: Global Bicycle Secure System Revenue billion Forecast, by Distributiuon Channel 2020 & 2033
- Table 38: Global Bicycle Secure System Volume K Forecast, by Distributiuon Channel 2020 & 2033
- Table 39: Global Bicycle Secure System Revenue billion Forecast, by End User 2020 & 2033
- Table 40: Global Bicycle Secure System Volume K Forecast, by End User 2020 & 2033
- Table 41: Global Bicycle Secure System Revenue billion Forecast, by Country 2020 & 2033
- Table 42: Global Bicycle Secure System Volume K Forecast, by Country 2020 & 2033
- Table 43: Brazil Bicycle Secure System Revenue (billion) Forecast, by Application 2020 & 2033
- Table 44: Brazil Bicycle Secure System Volume (K) Forecast, by Application 2020 & 2033
- Table 45: Argentina Bicycle Secure System Revenue (billion) Forecast, by Application 2020 & 2033
- Table 46: Argentina Bicycle Secure System Volume (K) Forecast, by Application 2020 & 2033
- Table 47: Rest of South America Bicycle Secure System Revenue (billion) Forecast, by Application 2020 & 2033
- Table 48: Rest of South America Bicycle Secure System Volume (K) Forecast, by Application 2020 & 2033
- Table 49: Global Bicycle Secure System Revenue billion Forecast, by Product Type 2020 & 2033
- Table 50: Global Bicycle Secure System Volume K Forecast, by Product Type 2020 & 2033
- Table 51: Global Bicycle Secure System Revenue billion Forecast, by Mechanism Type 2020 & 2033
- Table 52: Global Bicycle Secure System Volume K Forecast, by Mechanism Type 2020 & 2033
- Table 53: Global Bicycle Secure System Revenue billion Forecast, by Traditional 2020 & 2033
- Table 54: Global Bicycle Secure System Volume K Forecast, by Traditional 2020 & 2033
- Table 55: Global Bicycle Secure System Revenue billion Forecast, by Distributiuon Channel 2020 & 2033
- Table 56: Global Bicycle Secure System Volume K Forecast, by Distributiuon Channel 2020 & 2033
- Table 57: Global Bicycle Secure System Revenue billion Forecast, by End User 2020 & 2033
- Table 58: Global Bicycle Secure System Volume K Forecast, by End User 2020 & 2033
- Table 59: Global Bicycle Secure System Revenue billion Forecast, by Country 2020 & 2033
- Table 60: Global Bicycle Secure System Volume K Forecast, by Country 2020 & 2033
- Table 61: United Kingdom Bicycle Secure System Revenue (billion) Forecast, by Application 2020 & 2033
- Table 62: United Kingdom Bicycle Secure System Volume (K) Forecast, by Application 2020 & 2033
- Table 63: Germany Bicycle Secure System Revenue (billion) Forecast, by Application 2020 & 2033
- Table 64: Germany Bicycle Secure System Volume (K) Forecast, by Application 2020 & 2033
- Table 65: France Bicycle Secure System Revenue (billion) Forecast, by Application 2020 & 2033
- Table 66: France Bicycle Secure System Volume (K) Forecast, by Application 2020 & 2033
- Table 67: Italy Bicycle Secure System Revenue (billion) Forecast, by Application 2020 & 2033
- Table 68: Italy Bicycle Secure System Volume (K) Forecast, by Application 2020 & 2033
- Table 69: Spain Bicycle Secure System Revenue (billion) Forecast, by Application 2020 & 2033
- Table 70: Spain Bicycle Secure System Volume (K) Forecast, by Application 2020 & 2033
- Table 71: Russia Bicycle Secure System Revenue (billion) Forecast, by Application 2020 & 2033
- Table 72: Russia Bicycle Secure System Volume (K) Forecast, by Application 2020 & 2033
- Table 73: Benelux Bicycle Secure System Revenue (billion) Forecast, by Application 2020 & 2033
- Table 74: Benelux Bicycle Secure System Volume (K) Forecast, by Application 2020 & 2033
- Table 75: Nordics Bicycle Secure System Revenue (billion) Forecast, by Application 2020 & 2033
- Table 76: Nordics Bicycle Secure System Volume (K) Forecast, by Application 2020 & 2033
- Table 77: Rest of Europe Bicycle Secure System Revenue (billion) Forecast, by Application 2020 & 2033
- Table 78: Rest of Europe Bicycle Secure System Volume (K) Forecast, by Application 2020 & 2033
- Table 79: Global Bicycle Secure System Revenue billion Forecast, by Product Type 2020 & 2033
- Table 80: Global Bicycle Secure System Volume K Forecast, by Product Type 2020 & 2033
- Table 81: Global Bicycle Secure System Revenue billion Forecast, by Mechanism Type 2020 & 2033
- Table 82: Global Bicycle Secure System Volume K Forecast, by Mechanism Type 2020 & 2033
- Table 83: Global Bicycle Secure System Revenue billion Forecast, by Traditional 2020 & 2033
- Table 84: Global Bicycle Secure System Volume K Forecast, by Traditional 2020 & 2033
- Table 85: Global Bicycle Secure System Revenue billion Forecast, by Distributiuon Channel 2020 & 2033
- Table 86: Global Bicycle Secure System Volume K Forecast, by Distributiuon Channel 2020 & 2033
- Table 87: Global Bicycle Secure System Revenue billion Forecast, by End User 2020 & 2033
- Table 88: Global Bicycle Secure System Volume K Forecast, by End User 2020 & 2033
- Table 89: Global Bicycle Secure System Revenue billion Forecast, by Country 2020 & 2033
- Table 90: Global Bicycle Secure System Volume K Forecast, by Country 2020 & 2033
- Table 91: Turkey Bicycle Secure System Revenue (billion) Forecast, by Application 2020 & 2033
- Table 92: Turkey Bicycle Secure System Volume (K) Forecast, by Application 2020 & 2033
- Table 93: Israel Bicycle Secure System Revenue (billion) Forecast, by Application 2020 & 2033
- Table 94: Israel Bicycle Secure System Volume (K) Forecast, by Application 2020 & 2033
- Table 95: GCC Bicycle Secure System Revenue (billion) Forecast, by Application 2020 & 2033
- Table 96: GCC Bicycle Secure System Volume (K) Forecast, by Application 2020 & 2033
- Table 97: North Africa Bicycle Secure System Revenue (billion) Forecast, by Application 2020 & 2033
- Table 98: North Africa Bicycle Secure System Volume (K) Forecast, by Application 2020 & 2033
- Table 99: South Africa Bicycle Secure System Revenue (billion) Forecast, by Application 2020 & 2033
- Table 100: South Africa Bicycle Secure System Volume (K) Forecast, by Application 2020 & 2033
- Table 101: Rest of Middle East & Africa Bicycle Secure System Revenue (billion) Forecast, by Application 2020 & 2033
- Table 102: Rest of Middle East & Africa Bicycle Secure System Volume (K) Forecast, by Application 2020 & 2033
- Table 103: Global Bicycle Secure System Revenue billion Forecast, by Product Type 2020 & 2033
- Table 104: Global Bicycle Secure System Volume K Forecast, by Product Type 2020 & 2033
- Table 105: Global Bicycle Secure System Revenue billion Forecast, by Mechanism Type 2020 & 2033
- Table 106: Global Bicycle Secure System Volume K Forecast, by Mechanism Type 2020 & 2033
- Table 107: Global Bicycle Secure System Revenue billion Forecast, by Traditional 2020 & 2033
- Table 108: Global Bicycle Secure System Volume K Forecast, by Traditional 2020 & 2033
- Table 109: Global Bicycle Secure System Revenue billion Forecast, by Distributiuon Channel 2020 & 2033
- Table 110: Global Bicycle Secure System Volume K Forecast, by Distributiuon Channel 2020 & 2033
- Table 111: Global Bicycle Secure System Revenue billion Forecast, by End User 2020 & 2033
- Table 112: Global Bicycle Secure System Volume K Forecast, by End User 2020 & 2033
- Table 113: Global Bicycle Secure System Revenue billion Forecast, by Country 2020 & 2033
- Table 114: Global Bicycle Secure System Volume K Forecast, by Country 2020 & 2033
- Table 115: China Bicycle Secure System Revenue (billion) Forecast, by Application 2020 & 2033
- Table 116: China Bicycle Secure System Volume (K) Forecast, by Application 2020 & 2033
- Table 117: India Bicycle Secure System Revenue (billion) Forecast, by Application 2020 & 2033
- Table 118: India Bicycle Secure System Volume (K) Forecast, by Application 2020 & 2033
- Table 119: Japan Bicycle Secure System Revenue (billion) Forecast, by Application 2020 & 2033
- Table 120: Japan Bicycle Secure System Volume (K) Forecast, by Application 2020 & 2033
- Table 121: South Korea Bicycle Secure System Revenue (billion) Forecast, by Application 2020 & 2033
- Table 122: South Korea Bicycle Secure System Volume (K) Forecast, by Application 2020 & 2033
- Table 123: ASEAN Bicycle Secure System Revenue (billion) Forecast, by Application 2020 & 2033
- Table 124: ASEAN Bicycle Secure System Volume (K) Forecast, by Application 2020 & 2033
- Table 125: Oceania Bicycle Secure System Revenue (billion) Forecast, by Application 2020 & 2033
- Table 126: Oceania Bicycle Secure System Volume (K) Forecast, by Application 2020 & 2033
- Table 127: Rest of Asia Pacific Bicycle Secure System Revenue (billion) Forecast, by Application 2020 & 2033
- Table 128: Rest of Asia Pacific Bicycle Secure System Volume (K) Forecast, by Application 2020 & 2033
Frequently Asked Questions
1. What is the projected Compound Annual Growth Rate (CAGR) of the Bicycle Secure System?
The projected CAGR is approximately 7.2%.
2. Which companies are prominent players in the Bicycle Secure System?
Key companies in the market include ABUS August Bremicker Söhne KG, Kryptonite (Allegion), Hiplok, Giant, Schlage, Sena Technologies, Trek Bicycle Corporation, Axa Bike Security, Master Lock, Fly12 Bike Alarm, Skylock, Litelok, Lock8, Bike Angel, Yerka Bike, Others.
3. What are the main segments of the Bicycle Secure System?
The market segments include Product Type, Mechanism Type, Traditional, Distributiuon Channel, End User.
4. Can you provide details about the market size?
The market size is estimated to be USD 1.82 billion as of 2022.
5. What are some drivers contributing to market growth?
N/A
6. What are the notable trends driving market growth?
N/A
7. Are there any restraints impacting market growth?
N/A
8. Can you provide examples of recent developments in the market?
N/A
9. What pricing options are available for accessing the report?
Pricing options include single-user, multi-user, and enterprise licenses priced at USD 3350.00, USD 5025.00, and USD 6700.00 respectively.
10. Is the market size provided in terms of value or volume?
The market size is provided in terms of value, measured in billion and volume, measured in K.
11. Are there any specific market keywords associated with the report?
Yes, the market keyword associated with the report is "Bicycle Secure System," which aids in identifying and referencing the specific market segment covered.
12. How do I determine which pricing option suits my needs best?
The pricing options vary based on user requirements and access needs. Individual users may opt for single-user licenses, while businesses requiring broader access may choose multi-user or enterprise licenses for cost-effective access to the report.
13. Are there any additional resources or data provided in the Bicycle Secure System report?
While the report offers comprehensive insights, it's advisable to review the specific contents or supplementary materials provided to ascertain if additional resources or data are available.
14. How can I stay updated on further developments or reports in the Bicycle Secure System?
To stay informed about further developments, trends, and reports in the Bicycle Secure System, consider subscribing to industry newsletters, following relevant companies and organizations, or regularly checking reputable industry news sources and publications.
Methodology
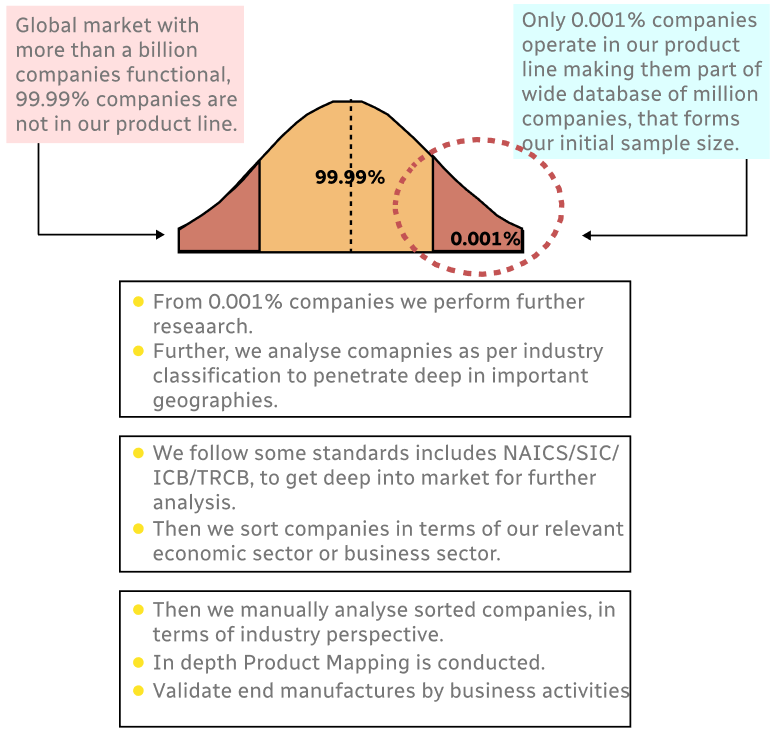
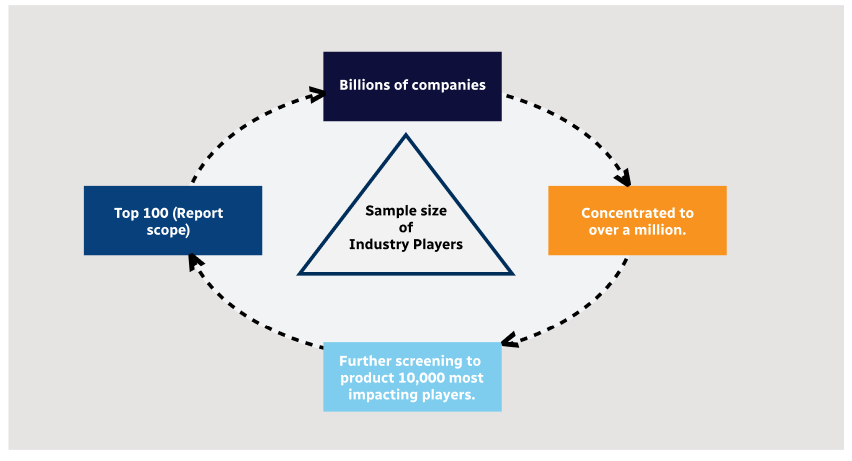
Step 1 - Identification of Relevant Samples Size from Population Database
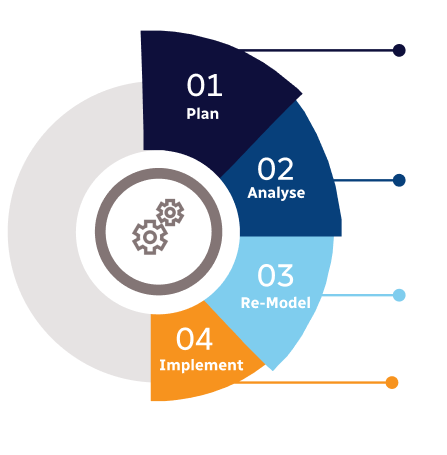
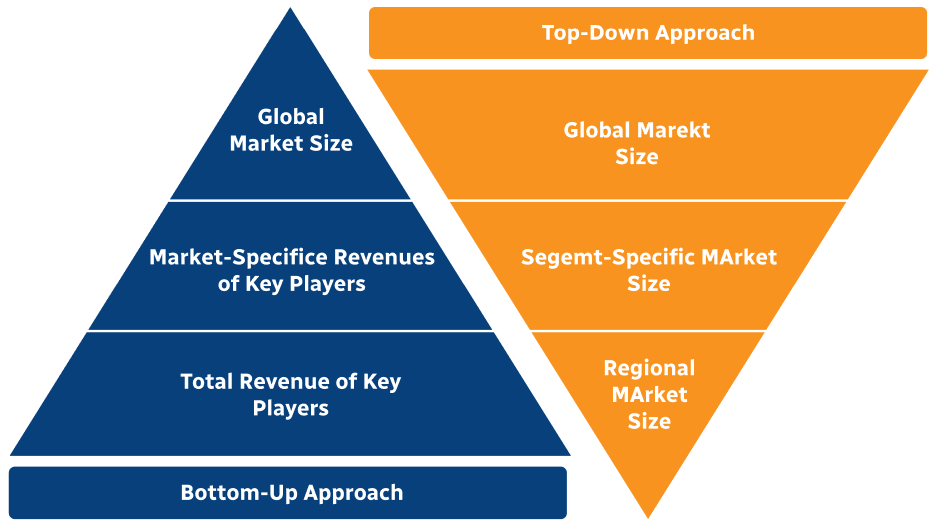
Step 2 - Approaches for Defining Global Market Size (Value, Volume* & Price*)
Note*: In applicable scenarios
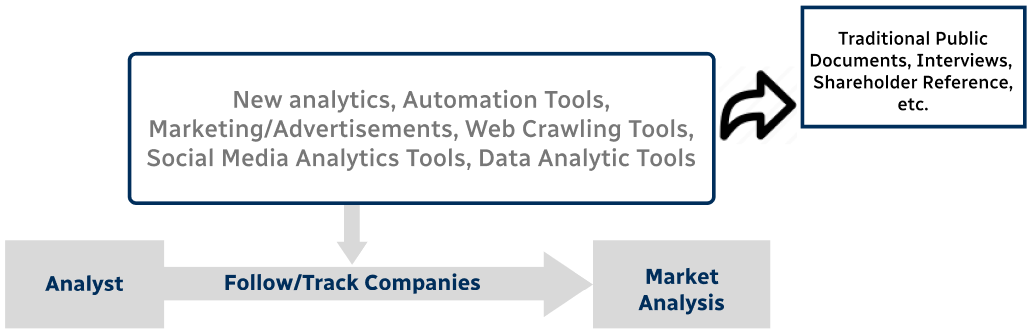
Step 3 - Data Sources
Primary Research
- Web Analytics
- Survey Reports
- Research Institute
- Latest Research Reports
- Opinion Leaders
Secondary Research
- Annual Reports
- White Paper
- Latest Press Release
- Industry Association
- Paid Database
- Investor Presentations
Step 4 - Data Triangulation
Involves using different sources of information in order to increase the validity of a study
These sources are likely to be stakeholders in a program - participants, other researchers, program staff, other community members, and so on.
Then we put all data in single framework & apply various statistical tools to find out the dynamic on the market.
During the analysis stage, feedback from the stakeholder groups would be compared to determine areas of agreement as well as areas of divergence