

Key Insights
The B2B e-commerce market is experiencing robust growth, driven by the increasing adoption of digital technologies by businesses globally. The 12.36% CAGR (2019-2033) indicates a significant expansion, fueled by factors such as improved internet penetration, enhanced logistics infrastructure, and the growing preference for convenient and efficient online procurement. Businesses are increasingly leveraging online platforms to streamline their supply chains, access a wider range of suppliers, and reduce operational costs. The market segmentation reveals a strong presence of both direct sales and marketplace sales channels, indicating a diversified ecosystem catering to varying business needs and preferences. While North America and Europe currently hold significant market shares, the Asia-Pacific region is poised for rapid growth, driven by the expanding digital economy in countries like China and India. The presence of major players like Alibaba, Amazon, and IndiaMART underscores the market's competitiveness and the significant investment in infrastructure and technology. Furthermore, the increasing adoption of e-procurement solutions and the integration of advanced analytics into B2B platforms will likely further propel market expansion in the coming years.
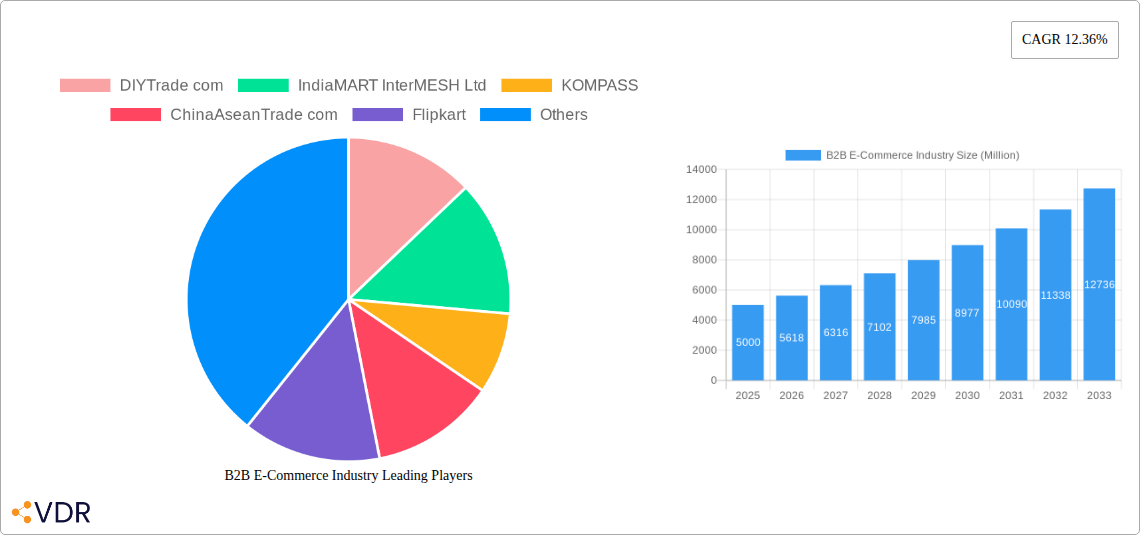
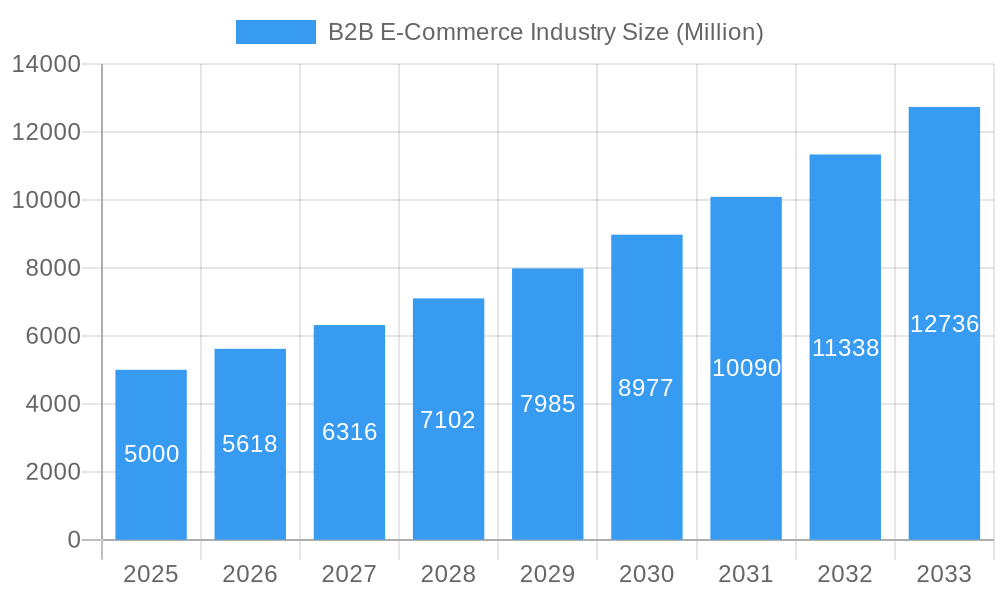
B2B E-Commerce Industry Market Size (In Billion)
This growth trajectory is expected to continue, with substantial expansion anticipated across all regions. While challenges such as cybersecurity concerns and the need for robust customer support remain, the overall trend points to a continued dominance of online channels in B2B transactions. The strategic investments by leading players in enhancing their technological capabilities and expanding their geographical reach will significantly shape the market landscape in the years to come. The diversification of offerings, including specialized industry platforms and value-added services like financing and logistics support, will cater to the evolving needs of businesses and fuel sustained market growth. The forecast period (2025-2033) presents considerable opportunities for new entrants and existing players to capitalize on the expanding market.
B2B E-Commerce Industry Company Market Share
B2B E-commerce Market Report: 2019-2033
This comprehensive report provides an in-depth analysis of the B2B e-commerce market, encompassing market dynamics, growth trends, regional dominance, product landscapes, challenges, opportunities, and key players. The study period covers 2019-2033, with a focus on 2025 as the base and estimated year. The report offers invaluable insights for businesses operating within the parent market of e-commerce and the child market of B2B e-commerce, enabling strategic decision-making and informed investments. The report analyzes key players including DIYTrade.com, IndiaMART InterMESH Ltd, KOMPASS, ChinaAseanTrade.com, Flipkart, Amazon.com Inc, Alibaba Group, eBay Inc, eworldtrade.com, and Quill Lincolnshire Inc.
B2B E-Commerce Industry Market Dynamics & Structure
This section analyzes the competitive landscape, technological advancements, and regulatory factors shaping the B2B e-commerce market. We explore market concentration, assessing the market share held by key players, and identifying potential M&A activities influencing industry dynamics. The report also delves into the impact of technological innovation, regulatory frameworks (e.g., data privacy regulations), and the presence of competitive substitutes on market growth. Finally, we examine end-user demographics and their evolving purchasing behaviors.
- Market Concentration: The market is moderately concentrated, with the top 5 players holding an estimated xx% market share in 2025. This is expected to shift slightly by 2033.
- Technological Innovation: AI-powered solutions, blockchain technology for supply chain transparency, and the increasing adoption of cloud-based platforms are key drivers.
- Regulatory Frameworks: Data privacy regulations and cross-border trade policies significantly impact B2B e-commerce operations.
- M&A Activity: The historical period (2019-2024) witnessed xx M&A deals, with an expected increase to xx deals during the forecast period (2025-2033).
- Innovation Barriers: High initial investment costs, integration complexities, and resistance to change among businesses hinder technological adoption.
B2B E-Commerce Industry Growth Trends & Insights
This section provides a detailed analysis of the B2B e-commerce market's growth trajectory using various models and data. It examines the evolution of market size (in million units), adoption rates across different industries, the impact of technological disruptions, and shifts in consumer behavior. We analyze historical growth (2019-2024) and project future growth (2025-2033), providing insights into the Compound Annual Growth Rate (CAGR) and market penetration. The total market size is estimated at xx million units in 2025, projected to reach xx million units by 2033, representing a CAGR of xx%.
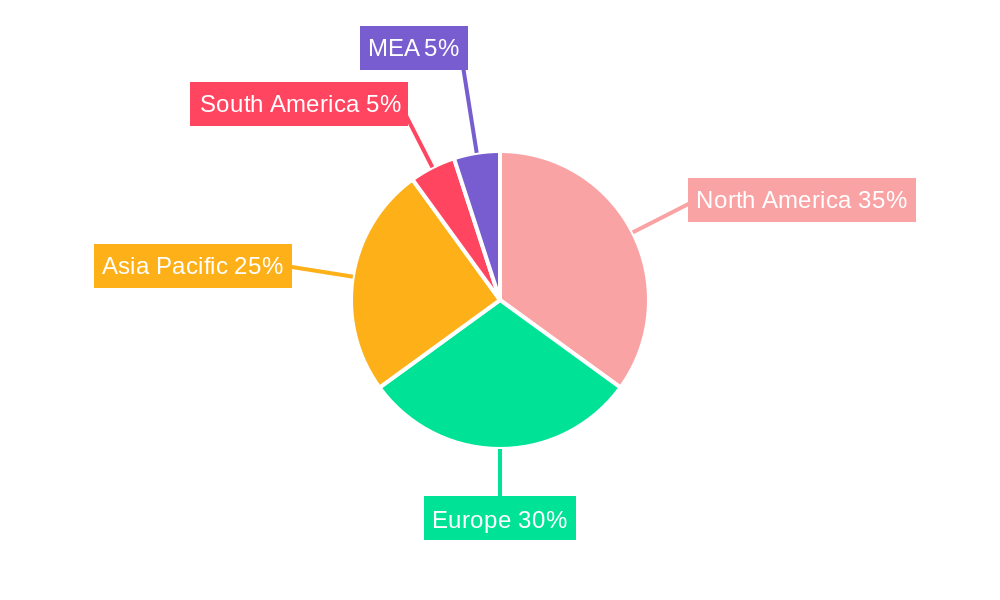
Dominant Regions, Countries, or Segments in B2B E-Commerce Industry
This section pinpoints the leading regions, countries, and market segments (By Channel: Direct Sales, Marketplace Sales) driving B2B e-commerce growth. We analyze the factors contributing to their dominance, including economic policies, infrastructure development, and consumer preferences. We evaluate market share and growth potential for each segment, providing a comprehensive overview of geographical and channel-based variations.
- Dominant Region: North America is expected to maintain its leading position due to robust digital infrastructure and high adoption rates, with a market share of xx% in 2025.
- Dominant Segment: Marketplace sales are predicted to dominate in 2025, with a market share of xx%, driven by increased consumer trust and convenience.
- Key Drivers: Government initiatives promoting digitalization and favorable economic conditions in specific regions are key growth drivers.
B2B E-Commerce Industry Product Landscape
This section outlines the range of products and services within the B2B e-commerce market, highlighting recent innovations and their impact. We examine various product categories, analyzing their unique selling propositions (USPs) and technological advancements that enhance efficiency and user experience.
Key Drivers, Barriers & Challenges in B2B E-Commerce Industry
This section identifies the key factors driving market expansion and the challenges hindering growth. We address technological advancements, economic factors, and policy-related drivers.
Key Drivers:
- Increasing internet penetration and smartphone usage.
- Growing preference for online purchasing for convenience and cost-effectiveness.
- Government initiatives supporting digitalization.
Challenges:
- Cybersecurity threats and data breaches.
- Supply chain disruptions impacting delivery timelines.
- Lack of digital literacy among some businesses.
Emerging Opportunities in B2B E-Commerce Industry
This section explores emerging trends and untapped opportunities within the B2B e-commerce market. We identify potential areas for growth, focusing on innovative applications, evolving consumer preferences, and underserved market segments. Examples include the integration of AR/VR technologies for product visualization and the expansion into new geographical markets.
Growth Accelerators in the B2B E-Commerce Industry
This section highlights the factors likely to drive long-term growth in the B2B e-commerce market. We focus on technological breakthroughs, such as the adoption of AI and machine learning for personalized recommendations, and the formation of strategic partnerships.
Key Players Shaping the B2B E-Commerce Industry Market
This section lists the key players: DIYTrade.com, IndiaMART InterMESH Ltd, KOMPASS, ChinaAseanTrade.com, Flipkart, Amazon.com Inc, Alibaba Group, eBay Inc, eworldtrade.com, Quill Lincolnshire Inc.
Notable Milestones in B2B E-Commerce Industry Sector
- August 2022: Razer Merchant Services (RMS) partnered with Atome for Buy Now Pay Later (BNPL) services, enhancing payment flexibility.
- July 2022: Golf Genius and RepSpark integrated their platforms, streamlining the B2B wholesale commerce process for golf shops.
In-Depth B2B E-Commerce Industry Market Outlook
The B2B e-commerce market is poised for significant growth over the forecast period (2025-2033). Continued technological advancements, strategic partnerships, and expansion into new markets will fuel this growth, presenting substantial opportunities for businesses to capitalize on the increasing shift towards digital commerce.
B2B E-Commerce Industry Segmentation
-
1. Channel
- 1.1. Direct Sales
- 1.2. Marketplace Sales
B2B E-Commerce Industry Segmentation By Geography
- 1. North America
- 2. Europe
- 3. Asia Pacific
- 4. Latin America
- 5. Middle East and Africa
B2B E-Commerce Industry Regional Market Share
Geographic Coverage of B2B E-Commerce Industry
B2B E-Commerce Industry REPORT HIGHLIGHTS
| Aspects | Details |
|---|---|
| Study Period | 2020-2034 |
| Base Year | 2025 |
| Estimated Year | 2026 |
| Forecast Period | 2026-2034 |
| Historical Period | 2020-2025 |
| Growth Rate | CAGR of 20.9% from 2020-2034 |
| Segmentation |
|
Table of Contents
- 1. Introduction
- 1.1. Research Scope
- 1.2. Market Segmentation
- 1.3. Research Objective
- 1.4. Definitions and Assumptions
- 2. Executive Summary
- 2.1. Market Snapshot
- 3. Market Dynamics
- 3.1. Market Drivers
- 3.2. Market Restrains
- 3.3. Market Trends
- 3.4. Market Opportunities
- 4. Market Factor Analysis
- 4.1. Porters Five Forces
- 4.1.1. Bargaining Power of Suppliers
- 4.1.2. Bargaining Power of Buyers
- 4.1.3. Threat of New Entrants
- 4.1.4. Threat of Substitutes
- 4.1.5. Competitive Rivalry
- 4.2. PESTEL analysis
- 4.3. BCG Analysis
- 4.3.1. Stars (High Growth, High Market Share)
- 4.3.2. Cash Cows (Low Growth, High Market Share)
- 4.3.3. Question Mark (High Growth, Low Market Share)
- 4.3.4. Dogs (Low Growth, Low Market Share)
- 4.4. Ansoff Matrix Analysis
- 4.5. Supply Chain Analysis
- 4.6. Regulatory Landscape
- 4.7. Current Market Potential and Opportunity Assessment (TAM–SAM–SOM Framework)
- 4.8. VDR Analyst Note
- 4.1. Porters Five Forces
- 5. Market Analysis, Insights and Forecast 2021-2033
- 5.1. Market Analysis, Insights and Forecast - by Channel
- 5.1.1. Direct Sales
- 5.1.2. Marketplace Sales
- 5.2. Market Analysis, Insights and Forecast - by Region
- 5.2.1. North America
- 5.2.2. Europe
- 5.2.3. Asia Pacific
- 5.2.4. Latin America
- 5.2.5. Middle East and Africa
- 5.1. Market Analysis, Insights and Forecast - by Channel
- 6. Global B2B E-Commerce Industry Analysis, Insights and Forecast, 2021-2033
- 6.1. Market Analysis, Insights and Forecast - by Channel
- 6.1.1. Direct Sales
- 6.1.2. Marketplace Sales
- 6.1. Market Analysis, Insights and Forecast - by Channel
- 7. North America B2B E-Commerce Industry Analysis, Insights and Forecast, 2021-2033
- 7.1. Market Analysis, Insights and Forecast - by Channel
- 7.1.1. Direct Sales
- 7.1.2. Marketplace Sales
- 7.1. Market Analysis, Insights and Forecast - by Channel
- 8. Europe B2B E-Commerce Industry Analysis, Insights and Forecast, 2021-2033
- 8.1. Market Analysis, Insights and Forecast - by Channel
- 8.1.1. Direct Sales
- 8.1.2. Marketplace Sales
- 8.1. Market Analysis, Insights and Forecast - by Channel
- 9. Asia Pacific B2B E-Commerce Industry Analysis, Insights and Forecast, 2021-2033
- 9.1. Market Analysis, Insights and Forecast - by Channel
- 9.1.1. Direct Sales
- 9.1.2. Marketplace Sales
- 9.1. Market Analysis, Insights and Forecast - by Channel
- 10. Latin America B2B E-Commerce Industry Analysis, Insights and Forecast, 2021-2033
- 10.1. Market Analysis, Insights and Forecast - by Channel
- 10.1.1. Direct Sales
- 10.1.2. Marketplace Sales
- 10.1. Market Analysis, Insights and Forecast - by Channel
- 11. Middle East and Africa B2B E-Commerce Industry Analysis, Insights and Forecast, 2021-2033
- 11.1. Market Analysis, Insights and Forecast - by Channel
- 11.1.1. Direct Sales
- 11.1.2. Marketplace Sales
- 11.1. Market Analysis, Insights and Forecast - by Channel
- 12. Competitive Analysis
- 12.1. Company Profiles
- 12.1.1 DIYTrade com
- 12.1.1.1. Company Overview
- 12.1.1.2. Products
- 12.1.1.3. Company Financials
- 12.1.1.4. SWOT Analysis
- 12.1.2 IndiaMART InterMESH Ltd
- 12.1.2.1. Company Overview
- 12.1.2.2. Products
- 12.1.2.3. Company Financials
- 12.1.2.4. SWOT Analysis
- 12.1.3 KOMPASS
- 12.1.3.1. Company Overview
- 12.1.3.2. Products
- 12.1.3.3. Company Financials
- 12.1.3.4. SWOT Analysis
- 12.1.4 ChinaAseanTrade com
- 12.1.4.1. Company Overview
- 12.1.4.2. Products
- 12.1.4.3. Company Financials
- 12.1.4.4. SWOT Analysis
- 12.1.5 Flipkart
- 12.1.5.1. Company Overview
- 12.1.5.2. Products
- 12.1.5.3. Company Financials
- 12.1.5.4. SWOT Analysis
- 12.1.6 Amazon com Inc
- 12.1.6.1. Company Overview
- 12.1.6.2. Products
- 12.1.6.3. Company Financials
- 12.1.6.4. SWOT Analysis
- 12.1.7 Alibaba Group
- 12.1.7.1. Company Overview
- 12.1.7.2. Products
- 12.1.7.3. Company Financials
- 12.1.7.4. SWOT Analysis
- 12.1.8 eBay Inc
- 12.1.8.1. Company Overview
- 12.1.8.2. Products
- 12.1.8.3. Company Financials
- 12.1.8.4. SWOT Analysis
- 12.1.9 eworldtrade com
- 12.1.9.1. Company Overview
- 12.1.9.2. Products
- 12.1.9.3. Company Financials
- 12.1.9.4. SWOT Analysis
- 12.1.10 Quill Lincolnshire Inc
- 12.1.10.1. Company Overview
- 12.1.10.2. Products
- 12.1.10.3. Company Financials
- 12.1.10.4. SWOT Analysis
- 12.1.1 DIYTrade com
- 12.2. Market Entropy
- 12.2.1 Company's Key Areas Served
- 12.2.2 Recent Developments
- 12.3. Company Market Share Analysis 2025
- 12.3.1 Top 5 Companies Market Share Analysis
- 12.3.2 Top 3 Companies Market Share Analysis
- 12.4. List of Potential Customers
- 13. Research Methodology
List of Figures
- Figure 1: Global B2B E-Commerce Industry Revenue Breakdown (billion, %) by Region 2025 & 2033
- Figure 2: Global B2B E-Commerce Industry Volume Breakdown (K Unit, %) by Region 2025 & 2033
- Figure 3: North America B2B E-Commerce Industry Revenue (billion), by Channel 2025 & 2033
- Figure 4: North America B2B E-Commerce Industry Volume (K Unit), by Channel 2025 & 2033
- Figure 5: North America B2B E-Commerce Industry Revenue Share (%), by Channel 2025 & 2033
- Figure 6: North America B2B E-Commerce Industry Volume Share (%), by Channel 2025 & 2033
- Figure 7: North America B2B E-Commerce Industry Revenue (billion), by Country 2025 & 2033
- Figure 8: North America B2B E-Commerce Industry Volume (K Unit), by Country 2025 & 2033
- Figure 9: North America B2B E-Commerce Industry Revenue Share (%), by Country 2025 & 2033
- Figure 10: North America B2B E-Commerce Industry Volume Share (%), by Country 2025 & 2033
- Figure 11: Europe B2B E-Commerce Industry Revenue (billion), by Channel 2025 & 2033
- Figure 12: Europe B2B E-Commerce Industry Volume (K Unit), by Channel 2025 & 2033
- Figure 13: Europe B2B E-Commerce Industry Revenue Share (%), by Channel 2025 & 2033
- Figure 14: Europe B2B E-Commerce Industry Volume Share (%), by Channel 2025 & 2033
- Figure 15: Europe B2B E-Commerce Industry Revenue (billion), by Country 2025 & 2033
- Figure 16: Europe B2B E-Commerce Industry Volume (K Unit), by Country 2025 & 2033
- Figure 17: Europe B2B E-Commerce Industry Revenue Share (%), by Country 2025 & 2033
- Figure 18: Europe B2B E-Commerce Industry Volume Share (%), by Country 2025 & 2033
- Figure 19: Asia Pacific B2B E-Commerce Industry Revenue (billion), by Channel 2025 & 2033
- Figure 20: Asia Pacific B2B E-Commerce Industry Volume (K Unit), by Channel 2025 & 2033
- Figure 21: Asia Pacific B2B E-Commerce Industry Revenue Share (%), by Channel 2025 & 2033
- Figure 22: Asia Pacific B2B E-Commerce Industry Volume Share (%), by Channel 2025 & 2033
- Figure 23: Asia Pacific B2B E-Commerce Industry Revenue (billion), by Country 2025 & 2033
- Figure 24: Asia Pacific B2B E-Commerce Industry Volume (K Unit), by Country 2025 & 2033
- Figure 25: Asia Pacific B2B E-Commerce Industry Revenue Share (%), by Country 2025 & 2033
- Figure 26: Asia Pacific B2B E-Commerce Industry Volume Share (%), by Country 2025 & 2033
- Figure 27: Latin America B2B E-Commerce Industry Revenue (billion), by Channel 2025 & 2033
- Figure 28: Latin America B2B E-Commerce Industry Volume (K Unit), by Channel 2025 & 2033
- Figure 29: Latin America B2B E-Commerce Industry Revenue Share (%), by Channel 2025 & 2033
- Figure 30: Latin America B2B E-Commerce Industry Volume Share (%), by Channel 2025 & 2033
- Figure 31: Latin America B2B E-Commerce Industry Revenue (billion), by Country 2025 & 2033
- Figure 32: Latin America B2B E-Commerce Industry Volume (K Unit), by Country 2025 & 2033
- Figure 33: Latin America B2B E-Commerce Industry Revenue Share (%), by Country 2025 & 2033
- Figure 34: Latin America B2B E-Commerce Industry Volume Share (%), by Country 2025 & 2033
- Figure 35: Middle East and Africa B2B E-Commerce Industry Revenue (billion), by Channel 2025 & 2033
- Figure 36: Middle East and Africa B2B E-Commerce Industry Volume (K Unit), by Channel 2025 & 2033
- Figure 37: Middle East and Africa B2B E-Commerce Industry Revenue Share (%), by Channel 2025 & 2033
- Figure 38: Middle East and Africa B2B E-Commerce Industry Volume Share (%), by Channel 2025 & 2033
- Figure 39: Middle East and Africa B2B E-Commerce Industry Revenue (billion), by Country 2025 & 2033
- Figure 40: Middle East and Africa B2B E-Commerce Industry Volume (K Unit), by Country 2025 & 2033
- Figure 41: Middle East and Africa B2B E-Commerce Industry Revenue Share (%), by Country 2025 & 2033
- Figure 42: Middle East and Africa B2B E-Commerce Industry Volume Share (%), by Country 2025 & 2033
List of Tables
- Table 1: Global B2B E-Commerce Industry Revenue billion Forecast, by Channel 2020 & 2033
- Table 2: Global B2B E-Commerce Industry Volume K Unit Forecast, by Channel 2020 & 2033
- Table 3: Global B2B E-Commerce Industry Revenue billion Forecast, by Region 2020 & 2033
- Table 4: Global B2B E-Commerce Industry Volume K Unit Forecast, by Region 2020 & 2033
- Table 5: Global B2B E-Commerce Industry Revenue billion Forecast, by Channel 2020 & 2033
- Table 6: Global B2B E-Commerce Industry Volume K Unit Forecast, by Channel 2020 & 2033
- Table 7: Global B2B E-Commerce Industry Revenue billion Forecast, by Country 2020 & 2033
- Table 8: Global B2B E-Commerce Industry Volume K Unit Forecast, by Country 2020 & 2033
- Table 9: Global B2B E-Commerce Industry Revenue billion Forecast, by Channel 2020 & 2033
- Table 10: Global B2B E-Commerce Industry Volume K Unit Forecast, by Channel 2020 & 2033
- Table 11: Global B2B E-Commerce Industry Revenue billion Forecast, by Country 2020 & 2033
- Table 12: Global B2B E-Commerce Industry Volume K Unit Forecast, by Country 2020 & 2033
- Table 13: Global B2B E-Commerce Industry Revenue billion Forecast, by Channel 2020 & 2033
- Table 14: Global B2B E-Commerce Industry Volume K Unit Forecast, by Channel 2020 & 2033
- Table 15: Global B2B E-Commerce Industry Revenue billion Forecast, by Country 2020 & 2033
- Table 16: Global B2B E-Commerce Industry Volume K Unit Forecast, by Country 2020 & 2033
- Table 17: Global B2B E-Commerce Industry Revenue billion Forecast, by Channel 2020 & 2033
- Table 18: Global B2B E-Commerce Industry Volume K Unit Forecast, by Channel 2020 & 2033
- Table 19: Global B2B E-Commerce Industry Revenue billion Forecast, by Country 2020 & 2033
- Table 20: Global B2B E-Commerce Industry Volume K Unit Forecast, by Country 2020 & 2033
- Table 21: Global B2B E-Commerce Industry Revenue billion Forecast, by Channel 2020 & 2033
- Table 22: Global B2B E-Commerce Industry Volume K Unit Forecast, by Channel 2020 & 2033
- Table 23: Global B2B E-Commerce Industry Revenue billion Forecast, by Country 2020 & 2033
- Table 24: Global B2B E-Commerce Industry Volume K Unit Forecast, by Country 2020 & 2033
Frequently Asked Questions
1. What is the projected Compound Annual Growth Rate (CAGR) of the B2B E-Commerce Industry?
The projected CAGR is approximately 20.9%.
2. Which companies are prominent players in the B2B E-Commerce Industry?
Key companies in the market include DIYTrade com, IndiaMART InterMESH Ltd, KOMPASS, ChinaAseanTrade com, Flipkart, Amazon com Inc, Alibaba Group, eBay Inc, eworldtrade com, Quill Lincolnshire Inc.
3. What are the main segments of the B2B E-Commerce Industry?
The market segments include Channel.
4. Can you provide details about the market size?
The market size is estimated to be USD 7038.1 billion as of 2022.
5. What are some drivers contributing to market growth?
Innovative Business Solutions and Increased digitalization in B2B e-commerce; Omnichannel Business Model.
6. What are the notable trends driving market growth?
Increase in Digitalization across the B2B e-commerce is driving growth.
7. Are there any restraints impacting market growth?
Paid version of some applications can challenge further penetration.
8. Can you provide examples of recent developments in the market?
August 2022 - Razer Merchant Services (RMS), the B2B arm of Razer Fintech, partnered with Atome, an Asia-based Buy Now Pay Later (BNPL) service. This partnership is aimed to enable flexible deferred payment acceptance during checkout at online and offline RMS merchants.
9. What pricing options are available for accessing the report?
Pricing options include single-user, multi-user, and enterprise licenses priced at USD 4750, USD 5250, and USD 8750 respectively.
10. Is the market size provided in terms of value or volume?
The market size is provided in terms of value, measured in billion and volume, measured in K Unit.
11. Are there any specific market keywords associated with the report?
Yes, the market keyword associated with the report is "B2B E-Commerce Industry," which aids in identifying and referencing the specific market segment covered.
12. How do I determine which pricing option suits my needs best?
The pricing options vary based on user requirements and access needs. Individual users may opt for single-user licenses, while businesses requiring broader access may choose multi-user or enterprise licenses for cost-effective access to the report.
13. Are there any additional resources or data provided in the B2B E-Commerce Industry report?
While the report offers comprehensive insights, it's advisable to review the specific contents or supplementary materials provided to ascertain if additional resources or data are available.
14. How can I stay updated on further developments or reports in the B2B E-Commerce Industry?
To stay informed about further developments, trends, and reports in the B2B E-Commerce Industry, consider subscribing to industry newsletters, following relevant companies and organizations, or regularly checking reputable industry news sources and publications.
Methodology
Step 1 - Identification of Relevant Samples Size from Population Database


Step 2 - Approaches for Defining Global Market Size (Value, Volume* & Price*)

Note*: In applicable scenarios
Step 3 - Data Sources
Primary Research
- Web Analytics
- Survey Reports
- Research Institute
- Latest Research Reports
- Opinion Leaders
Secondary Research
- Annual Reports
- White Paper
- Latest Press Release
- Industry Association
- Paid Database
- Investor Presentations

Step 4 - Data Triangulation
Involves using different sources of information in order to increase the validity of a study
These sources are likely to be stakeholders in a program - participants, other researchers, program staff, other community members, and so on.
Then we put all data in single framework & apply various statistical tools to find out the dynamic on the market.
During the analysis stage, feedback from the stakeholder groups would be compared to determine areas of agreement as well as areas of divergence