

Key Insights
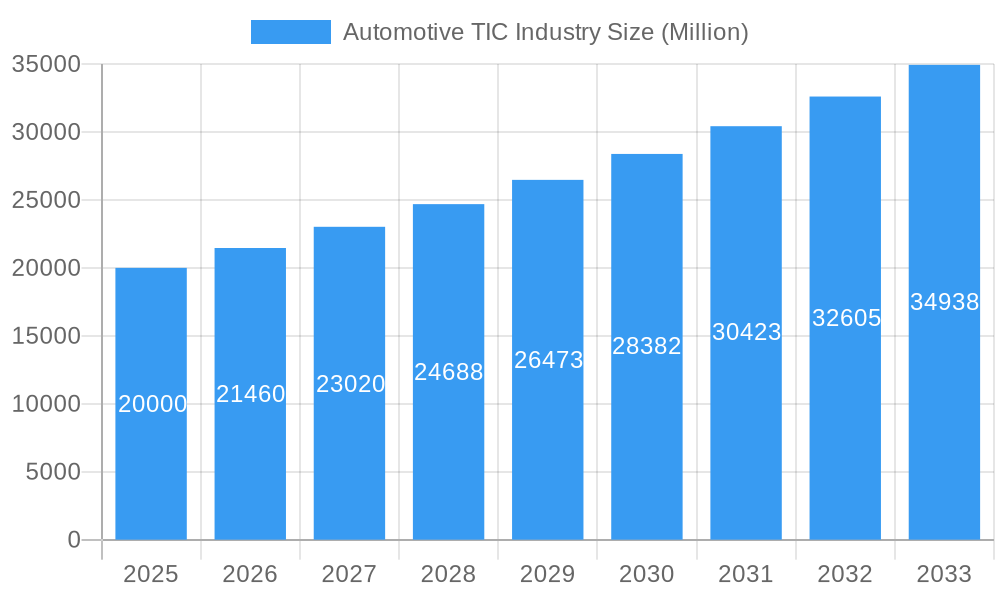
The global Automotive Testing, Inspection, and Certification (TIC) industry is poised for significant expansion, driven by increasingly stringent vehicle safety and emissions regulations, rising vehicle production volumes, and the widespread adoption of Advanced Driver-Assistance Systems (ADAS) and Electric Vehicles (EVs). The market is projected to reach $20.31 billion by 2025, with a compound annual growth rate (CAGR) of 4.84% from 2025 to 2033. This growth is underpinned by the persistent demand for rigorous quality assurance across the entire automotive value chain, from component validation to vehicle homologation. The escalating complexity of contemporary vehicles, particularly EVs with their sophisticated battery and software systems, necessitates comprehensive and specialized testing, further stimulating market growth. While passenger vehicles currently lead the market, the commercial vehicle segment is anticipated to experience substantial growth, propelled by evolving regulatory frameworks and the emergence of autonomous trucking technologies. Leading market participants, including Intertek Group, Eurofins Group, TÜV Rheinland Group, SGS Group, TÜV SÜD Group, Dekra SE, Applus Group, TÜV Nord, and Bureau Veritas, are strategically enhancing their service offerings and expanding their global footprint to leverage this dynamic market opportunity.
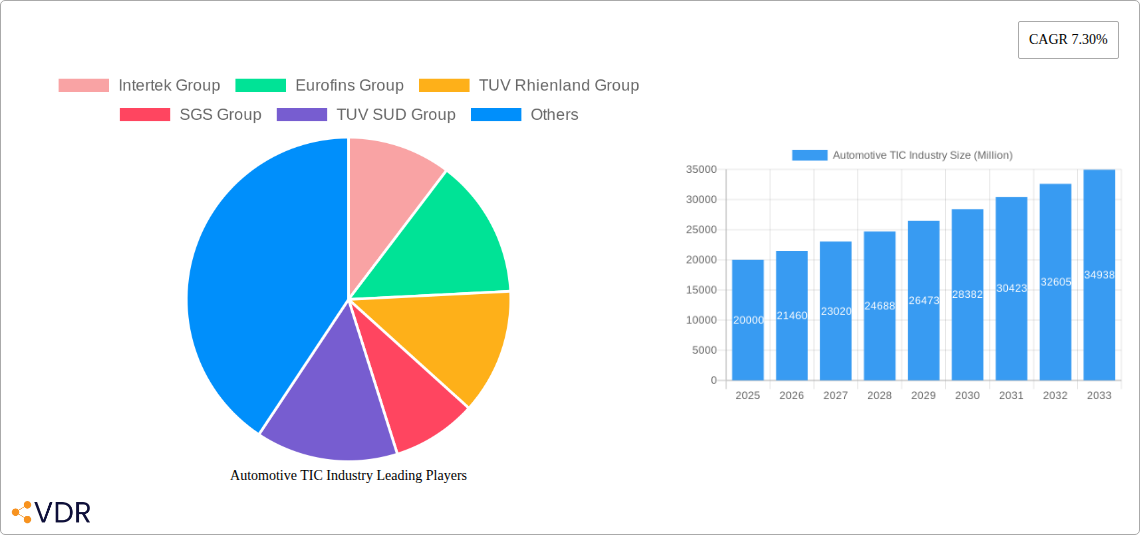
Automotive TIC Industry Market Size (In Billion)
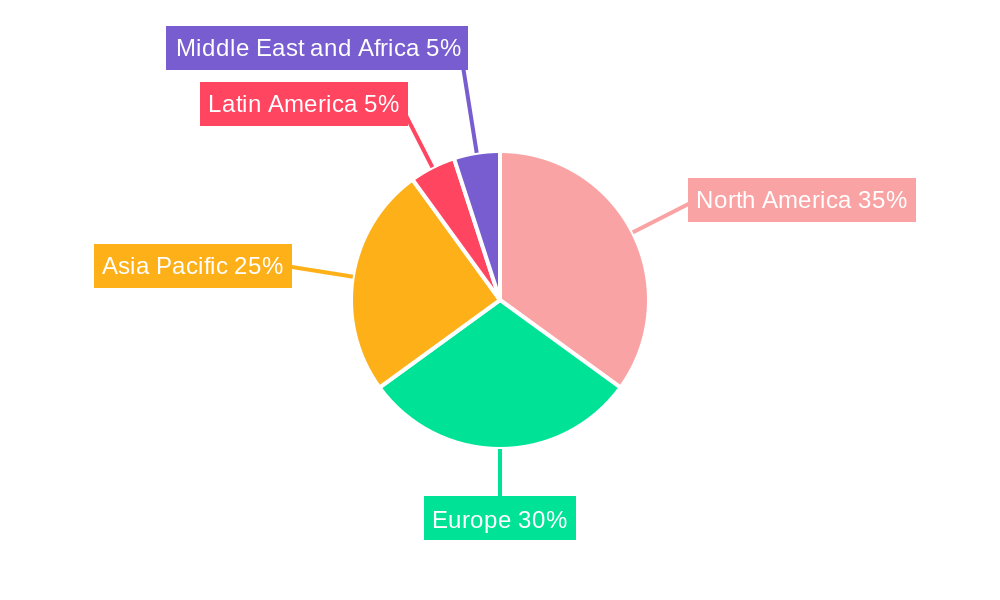
Geographically, the Automotive TIC market mirrors the global automotive manufacturing landscape. North America and Europe presently command substantial market shares, while the Asia-Pacific region is forecast to achieve the highest growth trajectory, fueled by the expanding automotive sectors in China and India. The market is segmented by service type (Testing & Inspection, Certification, and Others, including auditing, consulting, and training services) and vehicle type (Passenger and Commercial). The "Others" segment is experiencing notable growth due to the increasing demand for compliance-related consulting and training services to navigate complex regulatory environments. Key market restraints include the substantial costs associated with testing and certification, the potential impact of economic downturns on vehicle production, and the imperative for continuous technological innovation to align with evolving vehicle technologies. Despite these challenges, the long-term market outlook remains robust, driven by ongoing technological advancements and the global transition towards sustainable and safer transportation solutions.
Automotive TIC Industry Company Market Share
Automotive TIC Industry Market Overview: 2025-2033
This comprehensive report delivers an in-depth analysis of the Automotive Testing, Inspection, and Certification (TIC) industry, covering market dynamics, growth trajectories, regional insights, and strategic initiatives of key players. The analysis spans the period from 2025 to 2033, with 2025 serving as the base year. The market is granularly segmented by service type (Testing & Inspection, Certification, Others) and vehicle type (Passenger, Commercial), providing a detailed understanding of this vital sector.
Automotive TIC Industry Market Dynamics & Structure
The Automotive TIC market is characterized by moderate concentration, with several global players dominating the landscape. Technological innovation, driven by advancements in vehicle electrification, autonomous driving, and connected car technologies, is a key growth driver. Stringent regulatory frameworks concerning safety and emissions further fuel demand for TIC services. The market witnesses continuous consolidation through mergers and acquisitions (M&A), reflecting the pursuit of scale and enhanced service offerings. Competitive substitutes are limited, reinforcing the industry's position. End-user demographics are primarily driven by OEMs, Tier-1 suppliers, and government regulatory bodies.
- Market Concentration: Moderately concentrated, with top 10 players holding an estimated xx% market share in 2024.
- Technological Innovation: Focus on ADAS testing, EV battery testing, cybersecurity assessments, and connected car compliance.
- Regulatory Frameworks: Stringent safety and emission standards across regions (e.g., Euro NCAP, US FMVSS).
- M&A Activity: Significant M&A activity observed in recent years, with an estimated xx deals in the last five years, resulting in market consolidation and expansion of service portfolios. Example: Applus’ acquisition of IMA Dresden (May 2021).
- Innovation Barriers: High capital expenditure for specialized equipment and skilled personnel.
Automotive TIC Industry Growth Trends & Insights
The Automotive TIC market exhibits robust growth, driven by the increasing complexity of vehicles and stringent regulatory requirements. The market size is expected to reach xx million units by 2025, growing at a CAGR of xx% from 2025 to 2033. Adoption rates of advanced driver-assistance systems (ADAS) and electric vehicles (EVs) are key drivers, pushing the demand for specialized testing and certification services. Technological disruptions, such as AI-powered testing and automation, are further enhancing efficiency and expanding service offerings. Shifting consumer preferences toward safety and environmentally friendly vehicles strengthen the market outlook. Market penetration of advanced testing technologies is expected to reach xx% by 2033.
Dominant Regions, Countries, or Segments in Automotive TIC Industry
North America and Europe currently dominate the Automotive TIC market, driven by robust automotive manufacturing bases and stringent regulatory environments. Within service types, Testing & Inspection accounts for the largest market share (xx%), followed by Certification (xx%) and Others (xx%). The passenger vehicle segment holds a significant majority (xx%) compared to the commercial vehicle segment (xx%).
- Key Regional Drivers: Strong automotive manufacturing in North America and Europe; expanding EV market in China and Asia-Pacific; supportive government policies encouraging automotive technological advancements globally.
- Country-Specific Growth: Germany, US, and Japan as key contributors due to large automotive manufacturing sectors.
- Segment Dominance: Testing & Inspection's large market share attributed to the mandatory nature of testing for new vehicle releases and compliance with regulations.
Automotive TIC Industry Product Landscape
The Automotive TIC industry offers a diverse range of services, encompassing vehicle testing, inspection, and certification across various aspects, including safety, emissions, performance, and connectivity. Product innovation focuses on advanced testing technologies, such as AI-powered automated testing systems, reducing testing time and improving accuracy. Unique selling propositions include specialized expertise in specific vehicle types or technologies and comprehensive service portfolios catering to diverse client needs.
Key Drivers, Barriers & Challenges in Automotive TIC Industry
Key Drivers: Growing demand for autonomous vehicles, stricter emission norms, increasing adoption of electric vehicles, and the rise of connected car technologies are pushing the industry's expansion.
Key Challenges & Restraints: High investment costs in advanced testing equipment, a shortage of skilled professionals, and intense competition among established players pose significant challenges. Supply chain disruptions can also impact the availability of necessary components. Regulatory changes and increasing compliance costs also influence the market dynamics. These factors have impacted profitability margins by an estimated xx% in 2024.
Emerging Opportunities in Automotive TIC Industry
Emerging opportunities lie in the expansion of services for autonomous vehicle testing, cybersecurity assessments for connected cars, and battery testing for electric vehicles. Untapped markets in developing economies, especially with the increasing penetration of automobiles, present significant growth potential. Focus on developing specialized services for new automotive technologies like hydrogen fuel cell vehicles also presents future opportunities.
Growth Accelerators in the Automotive TIC Industry
Technological advancements in testing methodologies, strategic partnerships between TIC providers and automotive OEMs/suppliers, and expansion into new geographic markets are pivotal growth catalysts. Continuous improvement in the efficiency and accuracy of testing processes is essential to meet the rising demand. Investment in research & development of cutting-edge testing technologies ensures long-term market leadership.
Key Players Shaping the Automotive TIC Market
Notable Milestones in Automotive TIC Industry Sector
- May 2021: Applus acquired IMA Dresden, expanding its testing capabilities in structural and materials testing.
- April 2021: DEKRA became an MFi Authorized Test Laboratory for CarPlay certification, strengthening its position in the connected car market.
In-Depth Automotive TIC Industry Market Outlook
The Automotive TIC market is poised for sustained growth, driven by technological advancements and increasing regulatory scrutiny. Strategic partnerships and investments in innovation will be key to capturing market share. Expanding into emerging markets and focusing on specialized services for the next generation of automotive technologies will define future success within this dynamic sector. The market is expected to experience robust growth driven by the continued expansion of the automotive sector and the increasing demand for sophisticated testing capabilities.
Automotive TIC Industry Segmentation
-
1. Service Type
- 1.1. Testing & Inspection
- 1.2. Certification
- 1.3. Others
-
2. Vehicle Type
- 2.1. Passenger
- 2.2. Commercial
Automotive TIC Industry Segmentation By Geography
- 1. North America
- 2. Europe
- 3. Asia Pacific
- 4. Latin America
- 5. Middle East and Africa
Automotive TIC Industry Regional Market Share
Geographic Coverage of Automotive TIC Industry
Automotive TIC Industry REPORT HIGHLIGHTS
| Aspects | Details |
|---|---|
| Study Period | 2020-2034 |
| Base Year | 2025 |
| Estimated Year | 2026 |
| Forecast Period | 2026-2034 |
| Historical Period | 2020-2025 |
| Growth Rate | CAGR of 4.84% from 2020-2034 |
| Segmentation |
|
Table of Contents
- 1. Introduction
- 1.1. Research Scope
- 1.2. Market Segmentation
- 1.3. Research Objective
- 1.4. Definitions and Assumptions
- 2. Executive Summary
- 2.1. Market Snapshot
- 3. Market Dynamics
- 3.1. Market Drivers
- 3.2. Market Restrains
- 3.3. Market Trends
- 3.4. Market Opportunities
- 4. Market Factor Analysis
- 4.1. Porters Five Forces
- 4.1.1. Bargaining Power of Suppliers
- 4.1.2. Bargaining Power of Buyers
- 4.1.3. Threat of New Entrants
- 4.1.4. Threat of Substitutes
- 4.1.5. Competitive Rivalry
- 4.2. PESTEL analysis
- 4.3. BCG Analysis
- 4.3.1. Stars (High Growth, High Market Share)
- 4.3.2. Cash Cows (Low Growth, High Market Share)
- 4.3.3. Question Mark (High Growth, Low Market Share)
- 4.3.4. Dogs (Low Growth, Low Market Share)
- 4.4. Ansoff Matrix Analysis
- 4.5. Supply Chain Analysis
- 4.6. Regulatory Landscape
- 4.7. Current Market Potential and Opportunity Assessment (TAM–SAM–SOM Framework)
- 4.8. VDR Analyst Note
- 4.1. Porters Five Forces
- 5. Market Analysis, Insights and Forecast 2021-2033
- 5.1. Market Analysis, Insights and Forecast - by Service Type
- 5.1.1. Testing & Inspection
- 5.1.2. Certification
- 5.1.3. Others
- 5.2. Market Analysis, Insights and Forecast - by Vehicle Type
- 5.2.1. Passenger
- 5.2.2. Commercial
- 5.3. Market Analysis, Insights and Forecast - by Region
- 5.3.1. North America
- 5.3.2. Europe
- 5.3.3. Asia Pacific
- 5.3.4. Latin America
- 5.3.5. Middle East and Africa
- 5.1. Market Analysis, Insights and Forecast - by Service Type
- 6. Global Automotive TIC Industry Analysis, Insights and Forecast, 2021-2033
- 6.1. Market Analysis, Insights and Forecast - by Service Type
- 6.1.1. Testing & Inspection
- 6.1.2. Certification
- 6.1.3. Others
- 6.2. Market Analysis, Insights and Forecast - by Vehicle Type
- 6.2.1. Passenger
- 6.2.2. Commercial
- 6.1. Market Analysis, Insights and Forecast - by Service Type
- 7. North America Automotive TIC Industry Analysis, Insights and Forecast, 2021-2033
- 7.1. Market Analysis, Insights and Forecast - by Service Type
- 7.1.1. Testing & Inspection
- 7.1.2. Certification
- 7.1.3. Others
- 7.2. Market Analysis, Insights and Forecast - by Vehicle Type
- 7.2.1. Passenger
- 7.2.2. Commercial
- 7.1. Market Analysis, Insights and Forecast - by Service Type
- 8. Europe Automotive TIC Industry Analysis, Insights and Forecast, 2021-2033
- 8.1. Market Analysis, Insights and Forecast - by Service Type
- 8.1.1. Testing & Inspection
- 8.1.2. Certification
- 8.1.3. Others
- 8.2. Market Analysis, Insights and Forecast - by Vehicle Type
- 8.2.1. Passenger
- 8.2.2. Commercial
- 8.1. Market Analysis, Insights and Forecast - by Service Type
- 9. Asia Pacific Automotive TIC Industry Analysis, Insights and Forecast, 2021-2033
- 9.1. Market Analysis, Insights and Forecast - by Service Type
- 9.1.1. Testing & Inspection
- 9.1.2. Certification
- 9.1.3. Others
- 9.2. Market Analysis, Insights and Forecast - by Vehicle Type
- 9.2.1. Passenger
- 9.2.2. Commercial
- 9.1. Market Analysis, Insights and Forecast - by Service Type
- 10. Latin America Automotive TIC Industry Analysis, Insights and Forecast, 2021-2033
- 10.1. Market Analysis, Insights and Forecast - by Service Type
- 10.1.1. Testing & Inspection
- 10.1.2. Certification
- 10.1.3. Others
- 10.2. Market Analysis, Insights and Forecast - by Vehicle Type
- 10.2.1. Passenger
- 10.2.2. Commercial
- 10.1. Market Analysis, Insights and Forecast - by Service Type
- 11. Middle East and Africa Automotive TIC Industry Analysis, Insights and Forecast, 2021-2033
- 11.1. Market Analysis, Insights and Forecast - by Service Type
- 11.1.1. Testing & Inspection
- 11.1.2. Certification
- 11.1.3. Others
- 11.2. Market Analysis, Insights and Forecast - by Vehicle Type
- 11.2.1. Passenger
- 11.2.2. Commercial
- 11.1. Market Analysis, Insights and Forecast - by Service Type
- 12. Competitive Analysis
- 12.1. Company Profiles
- 12.1.1 Intertek Group
- 12.1.1.1. Company Overview
- 12.1.1.2. Products
- 12.1.1.3. Company Financials
- 12.1.1.4. SWOT Analysis
- 12.1.2 Eurofins Group
- 12.1.2.1. Company Overview
- 12.1.2.2. Products
- 12.1.2.3. Company Financials
- 12.1.2.4. SWOT Analysis
- 12.1.3 TUV Rhienland Group
- 12.1.3.1. Company Overview
- 12.1.3.2. Products
- 12.1.3.3. Company Financials
- 12.1.3.4. SWOT Analysis
- 12.1.4 SGS Group
- 12.1.4.1. Company Overview
- 12.1.4.2. Products
- 12.1.4.3. Company Financials
- 12.1.4.4. SWOT Analysis
- 12.1.5 TUV SUD Group
- 12.1.5.1. Company Overview
- 12.1.5.2. Products
- 12.1.5.3. Company Financials
- 12.1.5.4. SWOT Analysis
- 12.1.6 Dekra SE
- 12.1.6.1. Company Overview
- 12.1.6.2. Products
- 12.1.6.3. Company Financials
- 12.1.6.4. SWOT Analysis
- 12.1.7 Applus Group
- 12.1.7.1. Company Overview
- 12.1.7.2. Products
- 12.1.7.3. Company Financials
- 12.1.7.4. SWOT Analysis
- 12.1.8 TUV Nord
- 12.1.8.1. Company Overview
- 12.1.8.2. Products
- 12.1.8.3. Company Financials
- 12.1.8.4. SWOT Analysis
- 12.1.9 Bureau Veritas
- 12.1.9.1. Company Overview
- 12.1.9.2. Products
- 12.1.9.3. Company Financials
- 12.1.9.4. SWOT Analysis
- 12.1.1 Intertek Group
- 12.2. Market Entropy
- 12.2.1 Company's Key Areas Served
- 12.2.2 Recent Developments
- 12.3. Company Market Share Analysis 2025
- 12.3.1 Top 5 Companies Market Share Analysis
- 12.3.2 Top 3 Companies Market Share Analysis
- 12.4. List of Potential Customers
- 13. Research Methodology
List of Figures
- Figure 1: Global Automotive TIC Industry Revenue Breakdown (billion, %) by Region 2025 & 2033
- Figure 2: North America Automotive TIC Industry Revenue (billion), by Service Type 2025 & 2033
- Figure 3: North America Automotive TIC Industry Revenue Share (%), by Service Type 2025 & 2033
- Figure 4: North America Automotive TIC Industry Revenue (billion), by Vehicle Type 2025 & 2033
- Figure 5: North America Automotive TIC Industry Revenue Share (%), by Vehicle Type 2025 & 2033
- Figure 6: North America Automotive TIC Industry Revenue (billion), by Country 2025 & 2033
- Figure 7: North America Automotive TIC Industry Revenue Share (%), by Country 2025 & 2033
- Figure 8: Europe Automotive TIC Industry Revenue (billion), by Service Type 2025 & 2033
- Figure 9: Europe Automotive TIC Industry Revenue Share (%), by Service Type 2025 & 2033
- Figure 10: Europe Automotive TIC Industry Revenue (billion), by Vehicle Type 2025 & 2033
- Figure 11: Europe Automotive TIC Industry Revenue Share (%), by Vehicle Type 2025 & 2033
- Figure 12: Europe Automotive TIC Industry Revenue (billion), by Country 2025 & 2033
- Figure 13: Europe Automotive TIC Industry Revenue Share (%), by Country 2025 & 2033
- Figure 14: Asia Pacific Automotive TIC Industry Revenue (billion), by Service Type 2025 & 2033
- Figure 15: Asia Pacific Automotive TIC Industry Revenue Share (%), by Service Type 2025 & 2033
- Figure 16: Asia Pacific Automotive TIC Industry Revenue (billion), by Vehicle Type 2025 & 2033
- Figure 17: Asia Pacific Automotive TIC Industry Revenue Share (%), by Vehicle Type 2025 & 2033
- Figure 18: Asia Pacific Automotive TIC Industry Revenue (billion), by Country 2025 & 2033
- Figure 19: Asia Pacific Automotive TIC Industry Revenue Share (%), by Country 2025 & 2033
- Figure 20: Latin America Automotive TIC Industry Revenue (billion), by Service Type 2025 & 2033
- Figure 21: Latin America Automotive TIC Industry Revenue Share (%), by Service Type 2025 & 2033
- Figure 22: Latin America Automotive TIC Industry Revenue (billion), by Vehicle Type 2025 & 2033
- Figure 23: Latin America Automotive TIC Industry Revenue Share (%), by Vehicle Type 2025 & 2033
- Figure 24: Latin America Automotive TIC Industry Revenue (billion), by Country 2025 & 2033
- Figure 25: Latin America Automotive TIC Industry Revenue Share (%), by Country 2025 & 2033
- Figure 26: Middle East and Africa Automotive TIC Industry Revenue (billion), by Service Type 2025 & 2033
- Figure 27: Middle East and Africa Automotive TIC Industry Revenue Share (%), by Service Type 2025 & 2033
- Figure 28: Middle East and Africa Automotive TIC Industry Revenue (billion), by Vehicle Type 2025 & 2033
- Figure 29: Middle East and Africa Automotive TIC Industry Revenue Share (%), by Vehicle Type 2025 & 2033
- Figure 30: Middle East and Africa Automotive TIC Industry Revenue (billion), by Country 2025 & 2033
- Figure 31: Middle East and Africa Automotive TIC Industry Revenue Share (%), by Country 2025 & 2033
List of Tables
- Table 1: Global Automotive TIC Industry Revenue billion Forecast, by Service Type 2020 & 2033
- Table 2: Global Automotive TIC Industry Revenue billion Forecast, by Vehicle Type 2020 & 2033
- Table 3: Global Automotive TIC Industry Revenue billion Forecast, by Region 2020 & 2033
- Table 4: Global Automotive TIC Industry Revenue billion Forecast, by Service Type 2020 & 2033
- Table 5: Global Automotive TIC Industry Revenue billion Forecast, by Vehicle Type 2020 & 2033
- Table 6: Global Automotive TIC Industry Revenue billion Forecast, by Country 2020 & 2033
- Table 7: Global Automotive TIC Industry Revenue billion Forecast, by Service Type 2020 & 2033
- Table 8: Global Automotive TIC Industry Revenue billion Forecast, by Vehicle Type 2020 & 2033
- Table 9: Global Automotive TIC Industry Revenue billion Forecast, by Country 2020 & 2033
- Table 10: Global Automotive TIC Industry Revenue billion Forecast, by Service Type 2020 & 2033
- Table 11: Global Automotive TIC Industry Revenue billion Forecast, by Vehicle Type 2020 & 2033
- Table 12: Global Automotive TIC Industry Revenue billion Forecast, by Country 2020 & 2033
- Table 13: Global Automotive TIC Industry Revenue billion Forecast, by Service Type 2020 & 2033
- Table 14: Global Automotive TIC Industry Revenue billion Forecast, by Vehicle Type 2020 & 2033
- Table 15: Global Automotive TIC Industry Revenue billion Forecast, by Country 2020 & 2033
- Table 16: Global Automotive TIC Industry Revenue billion Forecast, by Service Type 2020 & 2033
- Table 17: Global Automotive TIC Industry Revenue billion Forecast, by Vehicle Type 2020 & 2033
- Table 18: Global Automotive TIC Industry Revenue billion Forecast, by Country 2020 & 2033
Frequently Asked Questions
1. What is the projected Compound Annual Growth Rate (CAGR) of the Automotive TIC Industry?
The projected CAGR is approximately 4.84%.
2. Which companies are prominent players in the Automotive TIC Industry?
Key companies in the market include Intertek Group, Eurofins Group, TUV Rhienland Group, SGS Group, TUV SUD Group, Dekra SE, Applus Group, TUV Nord, Bureau Veritas.
3. What are the main segments of the Automotive TIC Industry?
The market segments include Service Type, Vehicle Type.
4. Can you provide details about the market size?
The market size is estimated to be USD 20.31 billion as of 2022.
5. What are some drivers contributing to market growth?
Growth in Integration of Electronic Components in Automobiles; Trend Toward Digitization.
6. What are the notable trends driving market growth?
Testing is Expected to Hold a Significant Market Share.
7. Are there any restraints impacting market growth?
Lack of International Accepted Standards.
8. Can you provide examples of recent developments in the market?
May 2021 - Applus acquired IMA Dresden, a leading testing laboratory in Europe which is a well-diversified structural and materials testing laboratory, with a good reputation for excellence and a European leader in most of its key markets of railway, aerospace & defense, wind power, building products, medical devices and automotive.
9. What pricing options are available for accessing the report?
Pricing options include single-user, multi-user, and enterprise licenses priced at USD 4750, USD 5250, and USD 8750 respectively.
10. Is the market size provided in terms of value or volume?
The market size is provided in terms of value, measured in billion.
11. Are there any specific market keywords associated with the report?
Yes, the market keyword associated with the report is "Automotive TIC Industry," which aids in identifying and referencing the specific market segment covered.
12. How do I determine which pricing option suits my needs best?
The pricing options vary based on user requirements and access needs. Individual users may opt for single-user licenses, while businesses requiring broader access may choose multi-user or enterprise licenses for cost-effective access to the report.
13. Are there any additional resources or data provided in the Automotive TIC Industry report?
While the report offers comprehensive insights, it's advisable to review the specific contents or supplementary materials provided to ascertain if additional resources or data are available.
14. How can I stay updated on further developments or reports in the Automotive TIC Industry?
To stay informed about further developments, trends, and reports in the Automotive TIC Industry, consider subscribing to industry newsletters, following relevant companies and organizations, or regularly checking reputable industry news sources and publications.
Methodology
Step 1 - Identification of Relevant Samples Size from Population Database


Step 2 - Approaches for Defining Global Market Size (Value, Volume* & Price*)

Note*: In applicable scenarios
Step 3 - Data Sources
Primary Research
- Web Analytics
- Survey Reports
- Research Institute
- Latest Research Reports
- Opinion Leaders
Secondary Research
- Annual Reports
- White Paper
- Latest Press Release
- Industry Association
- Paid Database
- Investor Presentations

Step 4 - Data Triangulation
Involves using different sources of information in order to increase the validity of a study
These sources are likely to be stakeholders in a program - participants, other researchers, program staff, other community members, and so on.
Then we put all data in single framework & apply various statistical tools to find out the dynamic on the market.
During the analysis stage, feedback from the stakeholder groups would be compared to determine areas of agreement as well as areas of divergence