

Key Insights
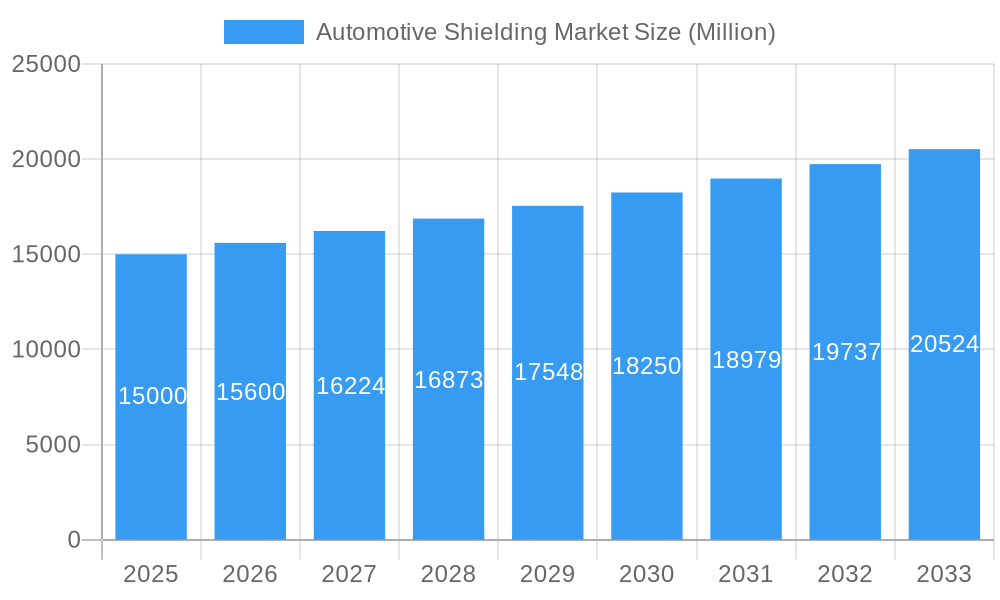
The automotive shielding market is experiencing robust growth, driven by increasing demand for electric vehicles (EVs), stricter emission regulations, and the rising adoption of advanced driver-assistance systems (ADAS). The market's Compound Annual Growth Rate (CAGR) exceeding 4% signifies a significant expansion projected through 2033. Passenger cars currently dominate the vehicle type segment, reflecting the widespread integration of shielding technologies in modern automobiles. However, the commercial vehicle segment is poised for accelerated growth due to the increasing electrification of trucks and buses. Heat shielding remains the largest segment by shielding type, attributed to the necessity of protecting sensitive components from high temperatures generated by engines and exhaust systems. Electromagnetic induction shielding is witnessing substantial growth, fueled by the proliferation of electronic control units (ECUs) and the need to protect sensitive electronic systems from electromagnetic interference (EMI). Key players like 3M, Dana Incorporated, and Tenneco Inc. are strategically investing in research and development, focusing on lightweight and high-performance shielding materials to meet evolving industry demands. Geographic distribution shows North America and Europe as major markets, owing to established automotive industries and stringent regulatory frameworks. However, the Asia-Pacific region, particularly China and India, is expected to witness significant growth, driven by rapid industrialization and increasing vehicle production. Competition is intense, with established players and emerging companies vying for market share through innovation and strategic partnerships.
Automotive Shielding Market Market Size (In Billion)
The restraints on market growth include high material costs associated with specialized shielding materials, along with the need for rigorous testing and certification to meet safety and performance standards. Furthermore, the complexity of integrating shielding solutions into existing vehicle designs and the potential for weight increase present challenges. Nevertheless, the long-term outlook remains positive, fueled by ongoing technological advancements in materials science, the rising demand for fuel-efficient and eco-friendly vehicles, and the continuous evolution of electronic systems in automobiles. The market's trajectory indicates a promising future for companies involved in the design, manufacturing, and supply of automotive shielding solutions. The market is expected to reach a substantial size driven by the factors discussed. Specific market size figures will vary depending on the chosen base year and market research methodology used.
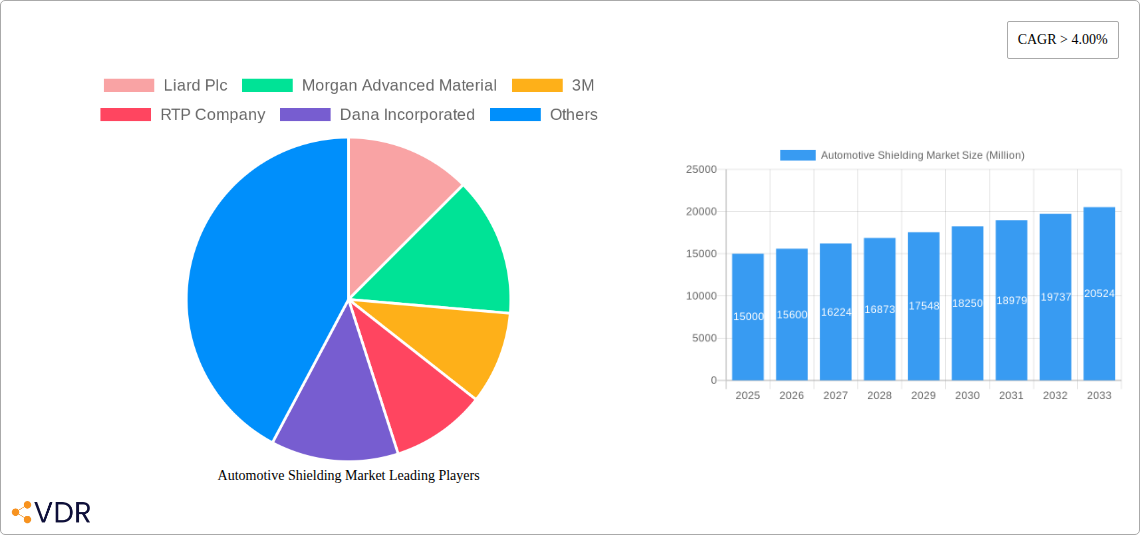
Automotive Shielding Market Company Market Share
Automotive Shielding Market: A Comprehensive Report (2019-2033)
This in-depth report provides a comprehensive analysis of the Automotive Shielding Market, encompassing market dynamics, growth trends, regional dominance, product landscape, key players, and future outlook. The study period covers 2019-2033, with a base year of 2025 and a forecast period of 2025-2033. The report utilizes data from the historical period (2019-2024) and leverages proprietary analytical models to offer precise market estimations. The total market size is predicted to reach xx Million units by 2033.
Automotive Shielding Market Dynamics & Structure
The Automotive Shielding Market exhibits a moderately concentrated structure, with key players like 3M, Dana Incorporated, and Tenneco Inc. holding significant market share (approximately xx%). Technological innovation, particularly in lightweight materials and advanced shielding technologies, is a primary growth driver. Stringent emission regulations and electromagnetic compatibility (EMC) standards are further shaping market dynamics. The market is witnessing a rise in mergers and acquisitions (M&A) activity, with xx deals recorded in the past five years, aimed at expanding product portfolios and geographic reach. Substitute products, such as alternative shielding materials, pose a moderate threat. The increasing adoption of electric and hybrid vehicles is boosting demand for electromagnetic shielding, while rising concerns about heat management in internal combustion engines fuel demand for heat shielding.
- Market Concentration: Moderately concentrated, with top 5 players holding xx% market share.
- Technological Innovation: Focus on lightweight, high-performance materials and advanced manufacturing techniques.
- Regulatory Landscape: Stringent emission and EMC standards drive market growth.
- Competitive Substitutes: Alternative shielding materials pose a moderate threat.
- M&A Activity: xx deals in the last 5 years, reflecting consolidation and expansion efforts.
- End-User Demographics: Primarily driven by the automotive industry, segmented into passenger cars and commercial vehicles.
Automotive Shielding Market Growth Trends & Insights
The Automotive Shielding Market is experiencing robust growth, driven by the increasing adoption of advanced driver-assistance systems (ADAS), electric vehicles (EVs), and the rising demand for improved fuel efficiency and passenger safety. The market size expanded from xx Million units in 2019 to xx Million units in 2024, registering a CAGR of xx%. This growth trajectory is expected to continue, with a projected CAGR of xx% from 2025 to 2033. Technological disruptions, such as the introduction of lightweight composite materials and advanced shielding technologies, are further accelerating market growth. Consumer preferences are shifting towards vehicles with enhanced safety features and improved fuel economy, fueling demand for automotive shielding. Market penetration for advanced shielding technologies is increasing steadily, reaching xx% in 2024 and expected to reach xx% by 2033.
Dominant Regions, Countries, or Segments in Automotive Shielding Market
North America currently dominates the Automotive Shielding Market, driven by strong demand from the passenger car segment and the presence of major automotive manufacturers. The region holds a market share of approximately xx% in 2025. Europe and Asia Pacific are also significant markets, exhibiting robust growth potential due to increasing vehicle production and stringent environmental regulations. Within the segments, passenger cars are the largest consumers of automotive shielding, followed by commercial vehicles. Heat shielding currently holds the largest market share, but electromagnetic induction shielding is expected to exhibit faster growth due to the rising adoption of EVs and ADAS.
- North America: Strong demand from passenger car segment and established automotive industry.
- Europe: Stringent emission regulations and increasing EV adoption.
- Asia Pacific: Rapid economic growth and rising vehicle production.
- Passenger Cars: Largest segment, driven by rising vehicle sales and advanced features.
- Commercial Vehicles: Significant market, with growth driven by increased transportation needs.
- Heat Shielding: Largest shielding type segment, driven by the need for improved thermal management.
- Electromagnetic Induction Shielding: Fastest growing segment driven by EV adoption and ADAS.
Automotive Shielding Market Product Landscape
The Automotive Shielding Market offers a diverse range of products, including heat shields made of materials like aluminum, stainless steel, and ceramic fiber, and electromagnetic shielding solutions utilizing conductive polymers, metallic foams, and magnetic materials. Product innovations focus on enhancing thermal performance, weight reduction, and electromagnetic interference (EMI) attenuation. Unique selling propositions include improved durability, higher temperature resistance, and customized solutions tailored to specific vehicle applications. Technological advancements include the integration of smart materials and advanced manufacturing processes to create lightweight, high-performance shielding solutions.
Key Drivers, Barriers & Challenges in Automotive Shielding Market
Key Drivers:
- Increasing demand for fuel-efficient vehicles.
- Growing adoption of EVs and hybrid vehicles.
- Stringent emission and safety regulations.
- Advancements in ADAS and infotainment systems.
Challenges & Restraints:
- Fluctuations in raw material prices impacting profitability.
- Supply chain disruptions affecting production timelines.
- Intense competition and pressure on pricing.
- Regulatory compliance and testing requirements. These factors could potentially reduce market growth by xx% by 2033.
Emerging Opportunities in Automotive Shielding Market
Emerging opportunities lie in the development of lightweight and cost-effective shielding materials, expanding into new applications like autonomous vehicles and connected cars, and tapping into untapped markets in developing economies. Innovative applications for shielding technologies in areas like battery thermal management and 5G connectivity offer significant growth potential. Evolving consumer preferences for sustainable and environmentally friendly vehicles are driving demand for eco-friendly shielding solutions.
Growth Accelerators in the Automotive Shielding Market Industry
Long-term growth will be fueled by technological breakthroughs in material science, strategic partnerships between automotive manufacturers and shielding suppliers, and expansion into new geographical markets. Investment in research and development will play a crucial role in creating innovative shielding solutions that meet the evolving demands of the automotive industry. Market expansion strategies targeting emerging economies with growing vehicle production will contribute significantly to market growth.
Key Players Shaping the Automotive Shielding Market Market
- Liard Plc
- Morgan Advanced Materials
- 3M
- RTP Company
- Dana Incorporated
- Tenneco Inc
- Autoneum
- Parker Hannifin
- Marian Inc
- Henkel
Notable Milestones in Automotive Shielding Market Sector
- 2020: Introduction of a lightweight heat shield by 3M, reducing vehicle weight by xx%.
- 2022: Dana Incorporated acquired a smaller shielding manufacturer, expanding its product portfolio.
- 2023: Several major automotive manufacturers announced the adoption of advanced EMI shielding solutions in their new EV models.
In-Depth Automotive Shielding Market Market Outlook
The Automotive Shielding Market is poised for continued growth, driven by technological advancements, stringent regulations, and the rising adoption of EVs and ADAS. Strategic partnerships, investments in R&D, and expansion into new markets will be key factors shaping the future landscape. The market presents significant opportunities for players who can develop innovative, cost-effective, and sustainable shielding solutions. The long-term outlook remains positive, with the market expected to reach xx Million units by 2033.
Automotive Shielding Market Segmentation
-
1. Vehicle Type
- 1.1. Passenger Cars
- 1.2. Commercial Vehicles
-
2. Shielding Type
- 2.1. Heat Shielding
- 2.2. Electromagnetic Induction Shielding
Automotive Shielding Market Segmentation By Geography
- 1. United States
- 2. Canada
- 3. Rest of North America
- 4. Germany
- 5. United Kingdom
- 6. France
- 7. Italy
- 8. Rest of Europe
- 9. China
- 10. India
- 11. Japan
- 12. South Korea
- 13. Rest of Asia Pacific
- 14. Mexico
- 15. Brazil
- 16. United Arab Emirates
- 17. Other Countries

Automotive Shielding Market Regional Market Share
Geographic Coverage of Automotive Shielding Market
Automotive Shielding Market REPORT HIGHLIGHTS
| Aspects | Details |
|---|---|
| Study Period | 2020-2034 |
| Base Year | 2025 |
| Estimated Year | 2026 |
| Forecast Period | 2026-2034 |
| Historical Period | 2020-2025 |
| Growth Rate | CAGR of > 4.00% from 2020-2034 |
| Segmentation |
|
Table of Contents
- 1. Introduction
- 1.1. Research Scope
- 1.2. Market Segmentation
- 1.3. Research Objective
- 1.4. Definitions and Assumptions
- 2. Executive Summary
- 2.1. Market Snapshot
- 3. Market Dynamics
- 3.1. Market Drivers
- 3.2. Market Restrains
- 3.3. Market Trends
- 3.4. Market Opportunities
- 4. Market Factor Analysis
- 4.1. Porters Five Forces
- 4.1.1. Bargaining Power of Suppliers
- 4.1.2. Bargaining Power of Buyers
- 4.1.3. Threat of New Entrants
- 4.1.4. Threat of Substitutes
- 4.1.5. Competitive Rivalry
- 4.2. PESTEL analysis
- 4.3. BCG Analysis
- 4.3.1. Stars (High Growth, High Market Share)
- 4.3.2. Cash Cows (Low Growth, High Market Share)
- 4.3.3. Question Mark (High Growth, Low Market Share)
- 4.3.4. Dogs (Low Growth, Low Market Share)
- 4.4. Ansoff Matrix Analysis
- 4.5. Supply Chain Analysis
- 4.6. Regulatory Landscape
- 4.7. Current Market Potential and Opportunity Assessment (TAM–SAM–SOM Framework)
- 4.8. VDR Analyst Note
- 4.1. Porters Five Forces
- 5. Market Analysis, Insights and Forecast 2021-2033
- 5.1. Market Analysis, Insights and Forecast - by Vehicle Type
- 5.1.1. Passenger Cars
- 5.1.2. Commercial Vehicles
- 5.2. Market Analysis, Insights and Forecast - by Shielding Type
- 5.2.1. Heat Shielding
- 5.2.2. Electromagnetic Induction Shielding
- 5.3. Market Analysis, Insights and Forecast - by Region
- 5.3.1. United States
- 5.3.2. Canada
- 5.3.3. Rest of North America
- 5.3.4. Germany
- 5.3.5. United Kingdom
- 5.3.6. France
- 5.3.7. Italy
- 5.3.8. Rest of Europe
- 5.3.9. China
- 5.3.10. India
- 5.3.11. Japan
- 5.3.12. South Korea
- 5.3.13. Rest of Asia Pacific
- 5.3.14. Mexico
- 5.3.15. Brazil
- 5.3.16. United Arab Emirates
- 5.3.17. Other Countries
- 5.1. Market Analysis, Insights and Forecast - by Vehicle Type
- 6. Global Automotive Shielding Market Analysis, Insights and Forecast, 2021-2033
- 6.1. Market Analysis, Insights and Forecast - by Vehicle Type
- 6.1.1. Passenger Cars
- 6.1.2. Commercial Vehicles
- 6.2. Market Analysis, Insights and Forecast - by Shielding Type
- 6.2.1. Heat Shielding
- 6.2.2. Electromagnetic Induction Shielding
- 6.1. Market Analysis, Insights and Forecast - by Vehicle Type
- 7. United States Automotive Shielding Market Analysis, Insights and Forecast, 2021-2033
- 7.1. Market Analysis, Insights and Forecast - by Vehicle Type
- 7.1.1. Passenger Cars
- 7.1.2. Commercial Vehicles
- 7.2. Market Analysis, Insights and Forecast - by Shielding Type
- 7.2.1. Heat Shielding
- 7.2.2. Electromagnetic Induction Shielding
- 7.1. Market Analysis, Insights and Forecast - by Vehicle Type
- 8. Canada Automotive Shielding Market Analysis, Insights and Forecast, 2021-2033
- 8.1. Market Analysis, Insights and Forecast - by Vehicle Type
- 8.1.1. Passenger Cars
- 8.1.2. Commercial Vehicles
- 8.2. Market Analysis, Insights and Forecast - by Shielding Type
- 8.2.1. Heat Shielding
- 8.2.2. Electromagnetic Induction Shielding
- 8.1. Market Analysis, Insights and Forecast - by Vehicle Type
- 9. Rest of North America Automotive Shielding Market Analysis, Insights and Forecast, 2021-2033
- 9.1. Market Analysis, Insights and Forecast - by Vehicle Type
- 9.1.1. Passenger Cars
- 9.1.2. Commercial Vehicles
- 9.2. Market Analysis, Insights and Forecast - by Shielding Type
- 9.2.1. Heat Shielding
- 9.2.2. Electromagnetic Induction Shielding
- 9.1. Market Analysis, Insights and Forecast - by Vehicle Type
- 10. Germany Automotive Shielding Market Analysis, Insights and Forecast, 2021-2033
- 10.1. Market Analysis, Insights and Forecast - by Vehicle Type
- 10.1.1. Passenger Cars
- 10.1.2. Commercial Vehicles
- 10.2. Market Analysis, Insights and Forecast - by Shielding Type
- 10.2.1. Heat Shielding
- 10.2.2. Electromagnetic Induction Shielding
- 10.1. Market Analysis, Insights and Forecast - by Vehicle Type
- 11. United Kingdom Automotive Shielding Market Analysis, Insights and Forecast, 2021-2033
- 11.1. Market Analysis, Insights and Forecast - by Vehicle Type
- 11.1.1. Passenger Cars
- 11.1.2. Commercial Vehicles
- 11.2. Market Analysis, Insights and Forecast - by Shielding Type
- 11.2.1. Heat Shielding
- 11.2.2. Electromagnetic Induction Shielding
- 11.1. Market Analysis, Insights and Forecast - by Vehicle Type
- 12. France Automotive Shielding Market Analysis, Insights and Forecast, 2021-2033
- 12.1. Market Analysis, Insights and Forecast - by Vehicle Type
- 12.1.1. Passenger Cars
- 12.1.2. Commercial Vehicles
- 12.2. Market Analysis, Insights and Forecast - by Shielding Type
- 12.2.1. Heat Shielding
- 12.2.2. Electromagnetic Induction Shielding
- 12.1. Market Analysis, Insights and Forecast - by Vehicle Type
- 13. Italy Automotive Shielding Market Analysis, Insights and Forecast, 2021-2033
- 13.1. Market Analysis, Insights and Forecast - by Vehicle Type
- 13.1.1. Passenger Cars
- 13.1.2. Commercial Vehicles
- 13.2. Market Analysis, Insights and Forecast - by Shielding Type
- 13.2.1. Heat Shielding
- 13.2.2. Electromagnetic Induction Shielding
- 13.1. Market Analysis, Insights and Forecast - by Vehicle Type
- 14. Rest of Europe Automotive Shielding Market Analysis, Insights and Forecast, 2021-2033
- 14.1. Market Analysis, Insights and Forecast - by Vehicle Type
- 14.1.1. Passenger Cars
- 14.1.2. Commercial Vehicles
- 14.2. Market Analysis, Insights and Forecast - by Shielding Type
- 14.2.1. Heat Shielding
- 14.2.2. Electromagnetic Induction Shielding
- 14.1. Market Analysis, Insights and Forecast - by Vehicle Type
- 15. China Automotive Shielding Market Analysis, Insights and Forecast, 2021-2033
- 15.1. Market Analysis, Insights and Forecast - by Vehicle Type
- 15.1.1. Passenger Cars
- 15.1.2. Commercial Vehicles
- 15.2. Market Analysis, Insights and Forecast - by Shielding Type
- 15.2.1. Heat Shielding
- 15.2.2. Electromagnetic Induction Shielding
- 15.1. Market Analysis, Insights and Forecast - by Vehicle Type
- 16. India Automotive Shielding Market Analysis, Insights and Forecast, 2021-2033
- 16.1. Market Analysis, Insights and Forecast - by Vehicle Type
- 16.1.1. Passenger Cars
- 16.1.2. Commercial Vehicles
- 16.2. Market Analysis, Insights and Forecast - by Shielding Type
- 16.2.1. Heat Shielding
- 16.2.2. Electromagnetic Induction Shielding
- 16.1. Market Analysis, Insights and Forecast - by Vehicle Type
- 17. Japan Automotive Shielding Market Analysis, Insights and Forecast, 2021-2033
- 17.1. Market Analysis, Insights and Forecast - by Vehicle Type
- 17.1.1. Passenger Cars
- 17.1.2. Commercial Vehicles
- 17.2. Market Analysis, Insights and Forecast - by Shielding Type
- 17.2.1. Heat Shielding
- 17.2.2. Electromagnetic Induction Shielding
- 17.1. Market Analysis, Insights and Forecast - by Vehicle Type
- 18. South Korea Automotive Shielding Market Analysis, Insights and Forecast, 2021-2033
- 18.1. Market Analysis, Insights and Forecast - by Vehicle Type
- 18.1.1. Passenger Cars
- 18.1.2. Commercial Vehicles
- 18.2. Market Analysis, Insights and Forecast - by Shielding Type
- 18.2.1. Heat Shielding
- 18.2.2. Electromagnetic Induction Shielding
- 18.1. Market Analysis, Insights and Forecast - by Vehicle Type
- 19. Rest of Asia Pacific Automotive Shielding Market Analysis, Insights and Forecast, 2021-2033
- 19.1. Market Analysis, Insights and Forecast - by Vehicle Type
- 19.1.1. Passenger Cars
- 19.1.2. Commercial Vehicles
- 19.2. Market Analysis, Insights and Forecast - by Shielding Type
- 19.2.1. Heat Shielding
- 19.2.2. Electromagnetic Induction Shielding
- 19.1. Market Analysis, Insights and Forecast - by Vehicle Type
- 20. Mexico Automotive Shielding Market Analysis, Insights and Forecast, 2021-2033
- 20.1. Market Analysis, Insights and Forecast - by Vehicle Type
- 20.1.1. Passenger Cars
- 20.1.2. Commercial Vehicles
- 20.2. Market Analysis, Insights and Forecast - by Shielding Type
- 20.2.1. Heat Shielding
- 20.2.2. Electromagnetic Induction Shielding
- 20.1. Market Analysis, Insights and Forecast - by Vehicle Type
- 21. Brazil Automotive Shielding Market Analysis, Insights and Forecast, 2021-2033
- 21.1. Market Analysis, Insights and Forecast - by Vehicle Type
- 21.1.1. Passenger Cars
- 21.1.2. Commercial Vehicles
- 21.2. Market Analysis, Insights and Forecast - by Shielding Type
- 21.2.1. Heat Shielding
- 21.2.2. Electromagnetic Induction Shielding
- 21.1. Market Analysis, Insights and Forecast - by Vehicle Type
- 22. United Arab Emirates Automotive Shielding Market Analysis, Insights and Forecast, 2021-2033
- 22.1. Market Analysis, Insights and Forecast - by Vehicle Type
- 22.1.1. Passenger Cars
- 22.1.2. Commercial Vehicles
- 22.2. Market Analysis, Insights and Forecast - by Shielding Type
- 22.2.1. Heat Shielding
- 22.2.2. Electromagnetic Induction Shielding
- 22.1. Market Analysis, Insights and Forecast - by Vehicle Type
- 23. Other Countries Automotive Shielding Market Analysis, Insights and Forecast, 2021-2033
- 23.1. Market Analysis, Insights and Forecast - by Vehicle Type
- 23.1.1. Passenger Cars
- 23.1.2. Commercial Vehicles
- 23.2. Market Analysis, Insights and Forecast - by Shielding Type
- 23.2.1. Heat Shielding
- 23.2.2. Electromagnetic Induction Shielding
- 23.1. Market Analysis, Insights and Forecast - by Vehicle Type
- 24. Competitive Analysis
- 24.1. Company Profiles
- 24.1.1 Liard Plc
- 24.1.1.1. Company Overview
- 24.1.1.2. Products
- 24.1.1.3. Company Financials
- 24.1.1.4. SWOT Analysis
- 24.1.2 Morgan Advanced Material
- 24.1.2.1. Company Overview
- 24.1.2.2. Products
- 24.1.2.3. Company Financials
- 24.1.2.4. SWOT Analysis
- 24.1.3 3M
- 24.1.3.1. Company Overview
- 24.1.3.2. Products
- 24.1.3.3. Company Financials
- 24.1.3.4. SWOT Analysis
- 24.1.4 RTP Company
- 24.1.4.1. Company Overview
- 24.1.4.2. Products
- 24.1.4.3. Company Financials
- 24.1.4.4. SWOT Analysis
- 24.1.5 Dana Incorporated
- 24.1.5.1. Company Overview
- 24.1.5.2. Products
- 24.1.5.3. Company Financials
- 24.1.5.4. SWOT Analysis
- 24.1.6 Tenneco Inc
- 24.1.6.1. Company Overview
- 24.1.6.2. Products
- 24.1.6.3. Company Financials
- 24.1.6.4. SWOT Analysis
- 24.1.7 Autoneum
- 24.1.7.1. Company Overview
- 24.1.7.2. Products
- 24.1.7.3. Company Financials
- 24.1.7.4. SWOT Analysis
- 24.1.8 Parker Hannifi
- 24.1.8.1. Company Overview
- 24.1.8.2. Products
- 24.1.8.3. Company Financials
- 24.1.8.4. SWOT Analysis
- 24.1.9 Marian Inc
- 24.1.9.1. Company Overview
- 24.1.9.2. Products
- 24.1.9.3. Company Financials
- 24.1.9.4. SWOT Analysis
- 24.1.10 Henkel
- 24.1.10.1. Company Overview
- 24.1.10.2. Products
- 24.1.10.3. Company Financials
- 24.1.10.4. SWOT Analysis
- 24.1.1 Liard Plc
- 24.2. Market Entropy
- 24.2.1 Company's Key Areas Served
- 24.2.2 Recent Developments
- 24.3. Company Market Share Analysis 2025
- 24.3.1 Top 5 Companies Market Share Analysis
- 24.3.2 Top 3 Companies Market Share Analysis
- 24.4. List of Potential Customers
- 25. Research Methodology
List of Figures
- Figure 1: Global Automotive Shielding Market Revenue Breakdown (Million, %) by Region 2025 & 2033
- Figure 2: United States Automotive Shielding Market Revenue (Million), by Vehicle Type 2025 & 2033
- Figure 3: United States Automotive Shielding Market Revenue Share (%), by Vehicle Type 2025 & 2033
- Figure 4: United States Automotive Shielding Market Revenue (Million), by Shielding Type 2025 & 2033
- Figure 5: United States Automotive Shielding Market Revenue Share (%), by Shielding Type 2025 & 2033
- Figure 6: United States Automotive Shielding Market Revenue (Million), by Country 2025 & 2033
- Figure 7: United States Automotive Shielding Market Revenue Share (%), by Country 2025 & 2033
- Figure 8: Canada Automotive Shielding Market Revenue (Million), by Vehicle Type 2025 & 2033
- Figure 9: Canada Automotive Shielding Market Revenue Share (%), by Vehicle Type 2025 & 2033
- Figure 10: Canada Automotive Shielding Market Revenue (Million), by Shielding Type 2025 & 2033
- Figure 11: Canada Automotive Shielding Market Revenue Share (%), by Shielding Type 2025 & 2033
- Figure 12: Canada Automotive Shielding Market Revenue (Million), by Country 2025 & 2033
- Figure 13: Canada Automotive Shielding Market Revenue Share (%), by Country 2025 & 2033
- Figure 14: Rest of North America Automotive Shielding Market Revenue (Million), by Vehicle Type 2025 & 2033
- Figure 15: Rest of North America Automotive Shielding Market Revenue Share (%), by Vehicle Type 2025 & 2033
- Figure 16: Rest of North America Automotive Shielding Market Revenue (Million), by Shielding Type 2025 & 2033
- Figure 17: Rest of North America Automotive Shielding Market Revenue Share (%), by Shielding Type 2025 & 2033
- Figure 18: Rest of North America Automotive Shielding Market Revenue (Million), by Country 2025 & 2033
- Figure 19: Rest of North America Automotive Shielding Market Revenue Share (%), by Country 2025 & 2033
- Figure 20: Germany Automotive Shielding Market Revenue (Million), by Vehicle Type 2025 & 2033
- Figure 21: Germany Automotive Shielding Market Revenue Share (%), by Vehicle Type 2025 & 2033
- Figure 22: Germany Automotive Shielding Market Revenue (Million), by Shielding Type 2025 & 2033
- Figure 23: Germany Automotive Shielding Market Revenue Share (%), by Shielding Type 2025 & 2033
- Figure 24: Germany Automotive Shielding Market Revenue (Million), by Country 2025 & 2033
- Figure 25: Germany Automotive Shielding Market Revenue Share (%), by Country 2025 & 2033
- Figure 26: United Kingdom Automotive Shielding Market Revenue (Million), by Vehicle Type 2025 & 2033
- Figure 27: United Kingdom Automotive Shielding Market Revenue Share (%), by Vehicle Type 2025 & 2033
- Figure 28: United Kingdom Automotive Shielding Market Revenue (Million), by Shielding Type 2025 & 2033
- Figure 29: United Kingdom Automotive Shielding Market Revenue Share (%), by Shielding Type 2025 & 2033
- Figure 30: United Kingdom Automotive Shielding Market Revenue (Million), by Country 2025 & 2033
- Figure 31: United Kingdom Automotive Shielding Market Revenue Share (%), by Country 2025 & 2033
- Figure 32: France Automotive Shielding Market Revenue (Million), by Vehicle Type 2025 & 2033
- Figure 33: France Automotive Shielding Market Revenue Share (%), by Vehicle Type 2025 & 2033
- Figure 34: France Automotive Shielding Market Revenue (Million), by Shielding Type 2025 & 2033
- Figure 35: France Automotive Shielding Market Revenue Share (%), by Shielding Type 2025 & 2033
- Figure 36: France Automotive Shielding Market Revenue (Million), by Country 2025 & 2033
- Figure 37: France Automotive Shielding Market Revenue Share (%), by Country 2025 & 2033
- Figure 38: Italy Automotive Shielding Market Revenue (Million), by Vehicle Type 2025 & 2033
- Figure 39: Italy Automotive Shielding Market Revenue Share (%), by Vehicle Type 2025 & 2033
- Figure 40: Italy Automotive Shielding Market Revenue (Million), by Shielding Type 2025 & 2033
- Figure 41: Italy Automotive Shielding Market Revenue Share (%), by Shielding Type 2025 & 2033
- Figure 42: Italy Automotive Shielding Market Revenue (Million), by Country 2025 & 2033
- Figure 43: Italy Automotive Shielding Market Revenue Share (%), by Country 2025 & 2033
- Figure 44: Rest of Europe Automotive Shielding Market Revenue (Million), by Vehicle Type 2025 & 2033
- Figure 45: Rest of Europe Automotive Shielding Market Revenue Share (%), by Vehicle Type 2025 & 2033
- Figure 46: Rest of Europe Automotive Shielding Market Revenue (Million), by Shielding Type 2025 & 2033
- Figure 47: Rest of Europe Automotive Shielding Market Revenue Share (%), by Shielding Type 2025 & 2033
- Figure 48: Rest of Europe Automotive Shielding Market Revenue (Million), by Country 2025 & 2033
- Figure 49: Rest of Europe Automotive Shielding Market Revenue Share (%), by Country 2025 & 2033
- Figure 50: China Automotive Shielding Market Revenue (Million), by Vehicle Type 2025 & 2033
- Figure 51: China Automotive Shielding Market Revenue Share (%), by Vehicle Type 2025 & 2033
- Figure 52: China Automotive Shielding Market Revenue (Million), by Shielding Type 2025 & 2033
- Figure 53: China Automotive Shielding Market Revenue Share (%), by Shielding Type 2025 & 2033
- Figure 54: China Automotive Shielding Market Revenue (Million), by Country 2025 & 2033
- Figure 55: China Automotive Shielding Market Revenue Share (%), by Country 2025 & 2033
- Figure 56: India Automotive Shielding Market Revenue (Million), by Vehicle Type 2025 & 2033
- Figure 57: India Automotive Shielding Market Revenue Share (%), by Vehicle Type 2025 & 2033
- Figure 58: India Automotive Shielding Market Revenue (Million), by Shielding Type 2025 & 2033
- Figure 59: India Automotive Shielding Market Revenue Share (%), by Shielding Type 2025 & 2033
- Figure 60: India Automotive Shielding Market Revenue (Million), by Country 2025 & 2033
- Figure 61: India Automotive Shielding Market Revenue Share (%), by Country 2025 & 2033
- Figure 62: Japan Automotive Shielding Market Revenue (Million), by Vehicle Type 2025 & 2033
- Figure 63: Japan Automotive Shielding Market Revenue Share (%), by Vehicle Type 2025 & 2033
- Figure 64: Japan Automotive Shielding Market Revenue (Million), by Shielding Type 2025 & 2033
- Figure 65: Japan Automotive Shielding Market Revenue Share (%), by Shielding Type 2025 & 2033
- Figure 66: Japan Automotive Shielding Market Revenue (Million), by Country 2025 & 2033
- Figure 67: Japan Automotive Shielding Market Revenue Share (%), by Country 2025 & 2033
- Figure 68: South Korea Automotive Shielding Market Revenue (Million), by Vehicle Type 2025 & 2033
- Figure 69: South Korea Automotive Shielding Market Revenue Share (%), by Vehicle Type 2025 & 2033
- Figure 70: South Korea Automotive Shielding Market Revenue (Million), by Shielding Type 2025 & 2033
- Figure 71: South Korea Automotive Shielding Market Revenue Share (%), by Shielding Type 2025 & 2033
- Figure 72: South Korea Automotive Shielding Market Revenue (Million), by Country 2025 & 2033
- Figure 73: South Korea Automotive Shielding Market Revenue Share (%), by Country 2025 & 2033
- Figure 74: Rest of Asia Pacific Automotive Shielding Market Revenue (Million), by Vehicle Type 2025 & 2033
- Figure 75: Rest of Asia Pacific Automotive Shielding Market Revenue Share (%), by Vehicle Type 2025 & 2033
- Figure 76: Rest of Asia Pacific Automotive Shielding Market Revenue (Million), by Shielding Type 2025 & 2033
- Figure 77: Rest of Asia Pacific Automotive Shielding Market Revenue Share (%), by Shielding Type 2025 & 2033
- Figure 78: Rest of Asia Pacific Automotive Shielding Market Revenue (Million), by Country 2025 & 2033
- Figure 79: Rest of Asia Pacific Automotive Shielding Market Revenue Share (%), by Country 2025 & 2033
- Figure 80: Mexico Automotive Shielding Market Revenue (Million), by Vehicle Type 2025 & 2033
- Figure 81: Mexico Automotive Shielding Market Revenue Share (%), by Vehicle Type 2025 & 2033
- Figure 82: Mexico Automotive Shielding Market Revenue (Million), by Shielding Type 2025 & 2033
- Figure 83: Mexico Automotive Shielding Market Revenue Share (%), by Shielding Type 2025 & 2033
- Figure 84: Mexico Automotive Shielding Market Revenue (Million), by Country 2025 & 2033
- Figure 85: Mexico Automotive Shielding Market Revenue Share (%), by Country 2025 & 2033
- Figure 86: Brazil Automotive Shielding Market Revenue (Million), by Vehicle Type 2025 & 2033
- Figure 87: Brazil Automotive Shielding Market Revenue Share (%), by Vehicle Type 2025 & 2033
- Figure 88: Brazil Automotive Shielding Market Revenue (Million), by Shielding Type 2025 & 2033
- Figure 89: Brazil Automotive Shielding Market Revenue Share (%), by Shielding Type 2025 & 2033
- Figure 90: Brazil Automotive Shielding Market Revenue (Million), by Country 2025 & 2033
- Figure 91: Brazil Automotive Shielding Market Revenue Share (%), by Country 2025 & 2033
- Figure 92: United Arab Emirates Automotive Shielding Market Revenue (Million), by Vehicle Type 2025 & 2033
- Figure 93: United Arab Emirates Automotive Shielding Market Revenue Share (%), by Vehicle Type 2025 & 2033
- Figure 94: United Arab Emirates Automotive Shielding Market Revenue (Million), by Shielding Type 2025 & 2033
- Figure 95: United Arab Emirates Automotive Shielding Market Revenue Share (%), by Shielding Type 2025 & 2033
- Figure 96: United Arab Emirates Automotive Shielding Market Revenue (Million), by Country 2025 & 2033
- Figure 97: United Arab Emirates Automotive Shielding Market Revenue Share (%), by Country 2025 & 2033
- Figure 98: Other Countries Automotive Shielding Market Revenue (Million), by Vehicle Type 2025 & 2033
- Figure 99: Other Countries Automotive Shielding Market Revenue Share (%), by Vehicle Type 2025 & 2033
- Figure 100: Other Countries Automotive Shielding Market Revenue (Million), by Shielding Type 2025 & 2033
- Figure 101: Other Countries Automotive Shielding Market Revenue Share (%), by Shielding Type 2025 & 2033
- Figure 102: Other Countries Automotive Shielding Market Revenue (Million), by Country 2025 & 2033
- Figure 103: Other Countries Automotive Shielding Market Revenue Share (%), by Country 2025 & 2033
List of Tables
- Table 1: Global Automotive Shielding Market Revenue Million Forecast, by Vehicle Type 2020 & 2033
- Table 2: Global Automotive Shielding Market Revenue Million Forecast, by Shielding Type 2020 & 2033
- Table 3: Global Automotive Shielding Market Revenue Million Forecast, by Region 2020 & 2033
- Table 4: Global Automotive Shielding Market Revenue Million Forecast, by Vehicle Type 2020 & 2033
- Table 5: Global Automotive Shielding Market Revenue Million Forecast, by Shielding Type 2020 & 2033
- Table 6: Global Automotive Shielding Market Revenue Million Forecast, by Country 2020 & 2033
- Table 7: Global Automotive Shielding Market Revenue Million Forecast, by Vehicle Type 2020 & 2033
- Table 8: Global Automotive Shielding Market Revenue Million Forecast, by Shielding Type 2020 & 2033
- Table 9: Global Automotive Shielding Market Revenue Million Forecast, by Country 2020 & 2033
- Table 10: Global Automotive Shielding Market Revenue Million Forecast, by Vehicle Type 2020 & 2033
- Table 11: Global Automotive Shielding Market Revenue Million Forecast, by Shielding Type 2020 & 2033
- Table 12: Global Automotive Shielding Market Revenue Million Forecast, by Country 2020 & 2033
- Table 13: Global Automotive Shielding Market Revenue Million Forecast, by Vehicle Type 2020 & 2033
- Table 14: Global Automotive Shielding Market Revenue Million Forecast, by Shielding Type 2020 & 2033
- Table 15: Global Automotive Shielding Market Revenue Million Forecast, by Country 2020 & 2033
- Table 16: Global Automotive Shielding Market Revenue Million Forecast, by Vehicle Type 2020 & 2033
- Table 17: Global Automotive Shielding Market Revenue Million Forecast, by Shielding Type 2020 & 2033
- Table 18: Global Automotive Shielding Market Revenue Million Forecast, by Country 2020 & 2033
- Table 19: Global Automotive Shielding Market Revenue Million Forecast, by Vehicle Type 2020 & 2033
- Table 20: Global Automotive Shielding Market Revenue Million Forecast, by Shielding Type 2020 & 2033
- Table 21: Global Automotive Shielding Market Revenue Million Forecast, by Country 2020 & 2033
- Table 22: Global Automotive Shielding Market Revenue Million Forecast, by Vehicle Type 2020 & 2033
- Table 23: Global Automotive Shielding Market Revenue Million Forecast, by Shielding Type 2020 & 2033
- Table 24: Global Automotive Shielding Market Revenue Million Forecast, by Country 2020 & 2033
- Table 25: Global Automotive Shielding Market Revenue Million Forecast, by Vehicle Type 2020 & 2033
- Table 26: Global Automotive Shielding Market Revenue Million Forecast, by Shielding Type 2020 & 2033
- Table 27: Global Automotive Shielding Market Revenue Million Forecast, by Country 2020 & 2033
- Table 28: Global Automotive Shielding Market Revenue Million Forecast, by Vehicle Type 2020 & 2033
- Table 29: Global Automotive Shielding Market Revenue Million Forecast, by Shielding Type 2020 & 2033
- Table 30: Global Automotive Shielding Market Revenue Million Forecast, by Country 2020 & 2033
- Table 31: Global Automotive Shielding Market Revenue Million Forecast, by Vehicle Type 2020 & 2033
- Table 32: Global Automotive Shielding Market Revenue Million Forecast, by Shielding Type 2020 & 2033
- Table 33: Global Automotive Shielding Market Revenue Million Forecast, by Country 2020 & 2033
- Table 34: Global Automotive Shielding Market Revenue Million Forecast, by Vehicle Type 2020 & 2033
- Table 35: Global Automotive Shielding Market Revenue Million Forecast, by Shielding Type 2020 & 2033
- Table 36: Global Automotive Shielding Market Revenue Million Forecast, by Country 2020 & 2033
- Table 37: Global Automotive Shielding Market Revenue Million Forecast, by Vehicle Type 2020 & 2033
- Table 38: Global Automotive Shielding Market Revenue Million Forecast, by Shielding Type 2020 & 2033
- Table 39: Global Automotive Shielding Market Revenue Million Forecast, by Country 2020 & 2033
- Table 40: Global Automotive Shielding Market Revenue Million Forecast, by Vehicle Type 2020 & 2033
- Table 41: Global Automotive Shielding Market Revenue Million Forecast, by Shielding Type 2020 & 2033
- Table 42: Global Automotive Shielding Market Revenue Million Forecast, by Country 2020 & 2033
- Table 43: Global Automotive Shielding Market Revenue Million Forecast, by Vehicle Type 2020 & 2033
- Table 44: Global Automotive Shielding Market Revenue Million Forecast, by Shielding Type 2020 & 2033
- Table 45: Global Automotive Shielding Market Revenue Million Forecast, by Country 2020 & 2033
- Table 46: Global Automotive Shielding Market Revenue Million Forecast, by Vehicle Type 2020 & 2033
- Table 47: Global Automotive Shielding Market Revenue Million Forecast, by Shielding Type 2020 & 2033
- Table 48: Global Automotive Shielding Market Revenue Million Forecast, by Country 2020 & 2033
- Table 49: Global Automotive Shielding Market Revenue Million Forecast, by Vehicle Type 2020 & 2033
- Table 50: Global Automotive Shielding Market Revenue Million Forecast, by Shielding Type 2020 & 2033
- Table 51: Global Automotive Shielding Market Revenue Million Forecast, by Country 2020 & 2033
- Table 52: Global Automotive Shielding Market Revenue Million Forecast, by Vehicle Type 2020 & 2033
- Table 53: Global Automotive Shielding Market Revenue Million Forecast, by Shielding Type 2020 & 2033
- Table 54: Global Automotive Shielding Market Revenue Million Forecast, by Country 2020 & 2033
Frequently Asked Questions
1. What is the projected Compound Annual Growth Rate (CAGR) of the Automotive Shielding Market?
The projected CAGR is approximately > 4.00%.
2. Which companies are prominent players in the Automotive Shielding Market?
Key companies in the market include Liard Plc, Morgan Advanced Material, 3M, RTP Company, Dana Incorporated, Tenneco Inc, Autoneum, Parker Hannifi, Marian Inc, Henkel.
3. What are the main segments of the Automotive Shielding Market?
The market segments include Vehicle Type, Shielding Type.
4. Can you provide details about the market size?
The market size is estimated to be USD XX Million as of 2022.
5. What are some drivers contributing to market growth?
Increasing Demand of Luxury Vehicles is Expected to Drive the Market.
6. What are the notable trends driving market growth?
Passenger Car Segment is Expected to Grow with the Highest CAGR.
7. Are there any restraints impacting market growth?
High Cost of the Vehicle may Hinder the Market Growth.
8. Can you provide examples of recent developments in the market?
N/A
9. What pricing options are available for accessing the report?
Pricing options include single-user, multi-user, and enterprise licenses priced at USD 4750, USD 5250, and USD 8750 respectively.
10. Is the market size provided in terms of value or volume?
The market size is provided in terms of value, measured in Million.
11. Are there any specific market keywords associated with the report?
Yes, the market keyword associated with the report is "Automotive Shielding Market," which aids in identifying and referencing the specific market segment covered.
12. How do I determine which pricing option suits my needs best?
The pricing options vary based on user requirements and access needs. Individual users may opt for single-user licenses, while businesses requiring broader access may choose multi-user or enterprise licenses for cost-effective access to the report.
13. Are there any additional resources or data provided in the Automotive Shielding Market report?
While the report offers comprehensive insights, it's advisable to review the specific contents or supplementary materials provided to ascertain if additional resources or data are available.
14. How can I stay updated on further developments or reports in the Automotive Shielding Market?
To stay informed about further developments, trends, and reports in the Automotive Shielding Market, consider subscribing to industry newsletters, following relevant companies and organizations, or regularly checking reputable industry news sources and publications.
Methodology
Step 1 - Identification of Relevant Samples Size from Population Database


Step 2 - Approaches for Defining Global Market Size (Value, Volume* & Price*)

Note*: In applicable scenarios
Step 3 - Data Sources
Primary Research
- Web Analytics
- Survey Reports
- Research Institute
- Latest Research Reports
- Opinion Leaders
Secondary Research
- Annual Reports
- White Paper
- Latest Press Release
- Industry Association
- Paid Database
- Investor Presentations

Step 4 - Data Triangulation
Involves using different sources of information in order to increase the validity of a study
These sources are likely to be stakeholders in a program - participants, other researchers, program staff, other community members, and so on.
Then we put all data in single framework & apply various statistical tools to find out the dynamic on the market.
During the analysis stage, feedback from the stakeholder groups would be compared to determine areas of agreement as well as areas of divergence