

Key Insights
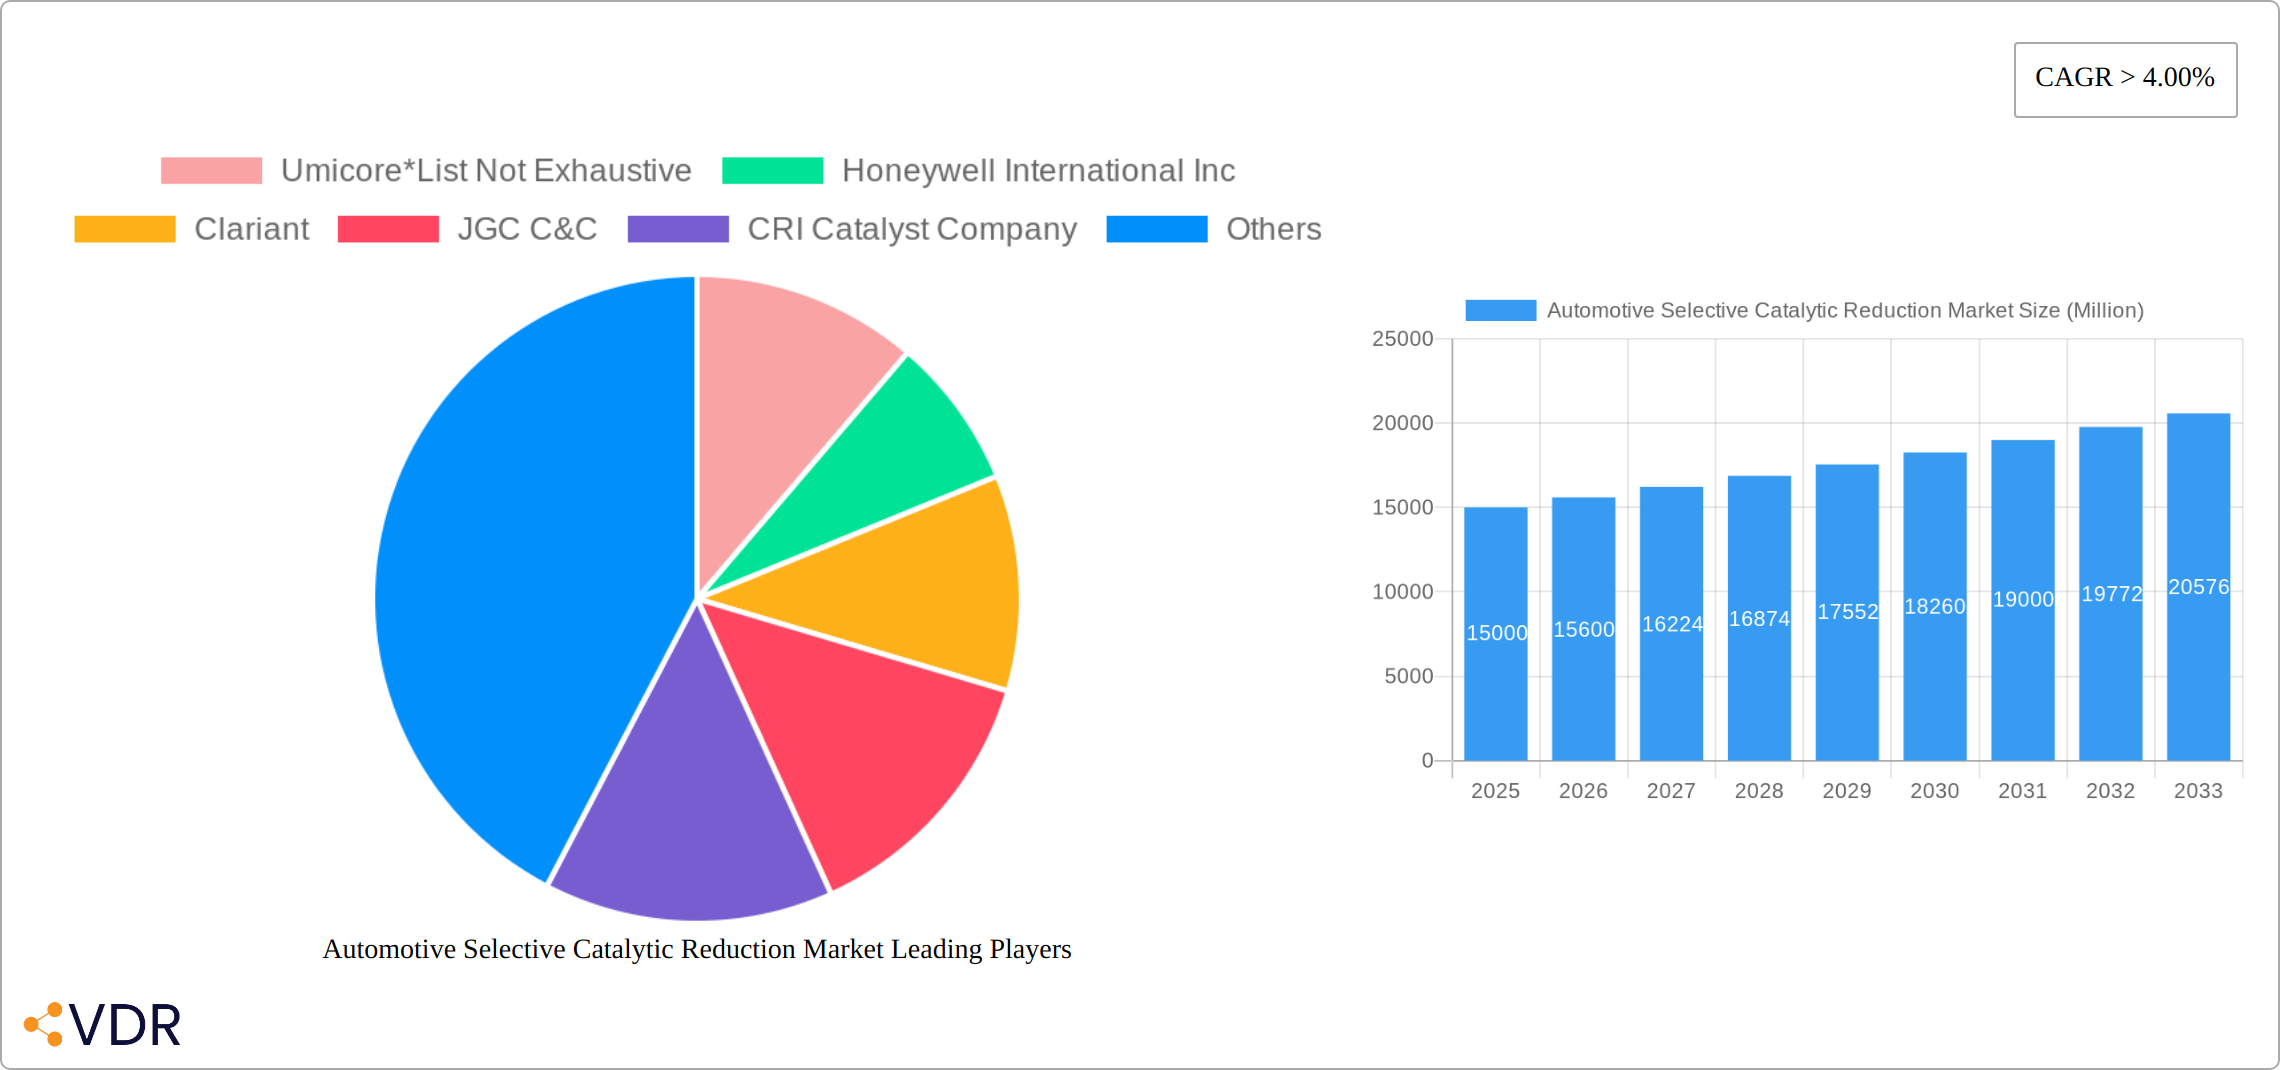
The Automotive Selective Catalytic Reduction (SCR) market is poised for substantial growth, driven by stringent global emission regulations and the increasing deployment of diesel vehicles, particularly within commercial transportation sectors. This market is projected to expand significantly, with a compound annual growth rate (CAGR) of 11.8%. The market size was valued at 13.22 billion in the base year 2025 and is expected to reach a considerable valuation by 2033. Key growth catalysts include the expanding global commercial vehicle fleet, accelerated by rapid industrialization in emerging economies such as China and India, alongside the implementation of rigorous emission standards like Euro VII and analogous regulations worldwide. The continued reliance on diesel engines for heavy-duty applications and the proven efficacy of SCR technology in significantly reducing harmful nitrogen oxide (NOx) emissions are primary drivers of market expansion. The market offers diverse catalyst types, including honeycomb, plate, and corrugated catalysts, each designed to meet specific vehicle applications and performance demands, facilitating robust market segmentation. While challenges such as the initial investment cost of SCR systems and the potential for ammonia slip exist, ongoing technological advancements and increasing economies of scale are effectively addressing these concerns. The market is segmented by process type (SCR, Non-selective Catalytic Reduction, Diesel Particulate Filters, Catalytic Oxidation), application (power generation excluding coal, coal-based thermal power generation, industrial), and catalyst type. Leading industry players, including Umicore, Honeywell, Clariant, and Johnson Matthey, are actively engaged in innovation and strategic collaborations to enhance their market positions. The Asia Pacific region is anticipated to lead market expansion, propelled by robust industrial growth and the burgeoning commercial vehicle sectors in China and India.
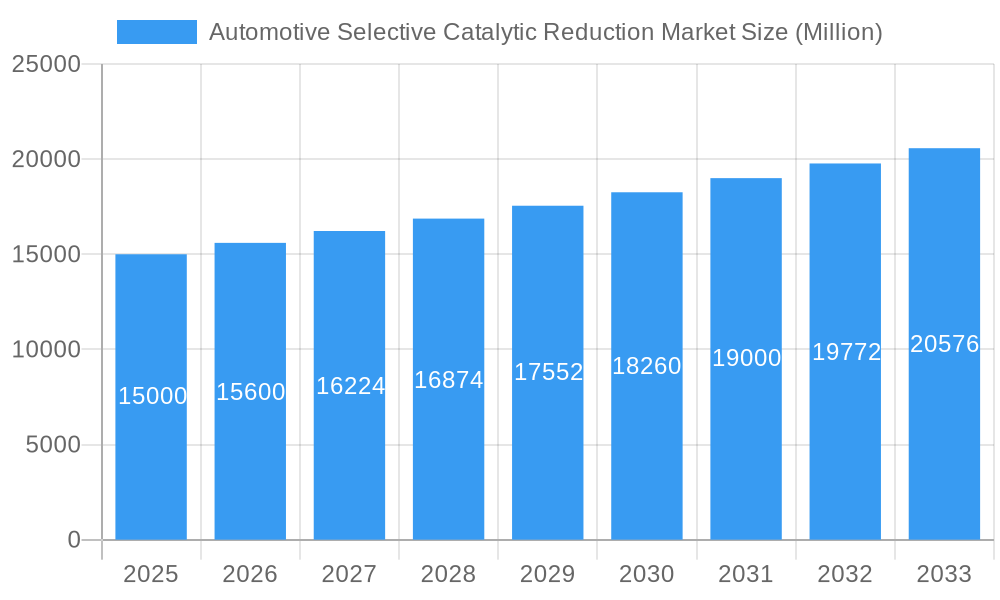
Automotive Selective Catalytic Reduction Market Market Size (In Billion)
The forecast period (2025-2033) will likely see transformative advancements in SCR technology. Expect the development of more efficient, durable catalysts engineered to minimize ammonia slip and optimize overall performance. These innovations, supported by government incentives promoting cleaner transportation solutions, will be instrumental in sustaining market growth. Intensified competition among established manufacturers and the emergence of new market entrants are expected to drive down costs, thereby increasing the accessibility and adoption of SCR technology across a broader spectrum of vehicle segments. While the long-term transition to electric vehicles may present a challenge, the persistent demand for diesel engines in heavy-duty applications ensures a sustained market for SCR systems in the foreseeable future. Further granular insights can be gained through detailed market segmentation by vehicle type (e.g., heavy-duty trucks, buses) and specific geographic regions, offering a comprehensive view of this critical emission control technology's dynamic landscape.
Automotive Selective Catalytic Reduction Market Company Market Share
Automotive Selective Catalytic Reduction Market: A Comprehensive Report (2019-2033)
This comprehensive report provides an in-depth analysis of the Automotive Selective Catalytic Reduction (SCR) market, encompassing its parent market (automotive emission control systems) and child markets (various catalyst types and applications). The study period covers 2019-2033, with 2025 as the base and estimated year. The report offers valuable insights for industry professionals, investors, and strategic decision-makers seeking to navigate this dynamic market. Projected market size values are presented in million units.
Automotive Selective Catalytic Reduction Market Dynamics & Structure
The Automotive SCR market is characterized by moderate concentration, with key players like Umicore, Honeywell International Inc, Clariant, and Johnson Matthey holding significant market share (xx%). Technological innovation, primarily focused on improving catalyst efficiency and durability, is a major driver. Stringent emission regulations globally, particularly in Europe and North America, are further propelling market growth. The market also faces competition from alternative emission control technologies like Diesel Particulate Filters (DPF) and Non-Selective Catalytic Reduction (NSCR). Recent M&A activity has been moderate (xx deals in the past 5 years), indicating consolidation within the industry.
- Market Concentration: Moderately concentrated, with top 5 players holding xx% market share.
- Technological Innovation: Focus on improving catalyst efficiency, reducing precious metal loading, and enhancing durability.
- Regulatory Framework: Stringent emission norms in key regions drive demand.
- Competitive Substitutes: DPFs, NSCR, and other after-treatment technologies.
- End-User Demographics: Primarily automotive manufacturers and aftermarket suppliers.
- M&A Trends: Moderate consolidation, with xx deals in the last 5 years.
Automotive Selective Catalytic Reduction Market Growth Trends & Insights
The Automotive Selective Catalytic Reduction (SCR) market demonstrated robust growth between 2019 and 2024, expanding from [Insert Precise Figure] million units to [Insert Precise Figure] million units. This surge can be attributed to several key factors: a rise in global vehicle production, increasingly stringent emission regulations worldwide, and a heightened public awareness of the detrimental effects of air pollution. This positive trajectory is projected to continue throughout the forecast period (2025-2033), with a projected Compound Annual Growth Rate (CAGR) of [Insert Precise Percentage]%. This sustained growth is further fueled by ongoing technological advancements, such as the development of more efficient and durable catalysts with improved NOx reduction capabilities and extended lifespans. While the increasing adoption of electric vehicles (EVs) might subtly moderate long-term growth, the continued prevalence of internal combustion engine (ICE) vehicles, especially in developing nations, will ensure a substantial and consistent demand for SCR systems for the foreseeable future. The market is segmented by vehicle type (light-duty, heavy-duty), by geographical region (North America, Europe, Asia-Pacific, etc.), and by technology type (urea-SCR, ammonia-SCR, etc.). Further analysis of these segments reveals nuanced growth patterns and opportunities.
Dominant Regions, Countries, or Segments in Automotive Selective Catalytic Reduction Market
The North American and European regions currently dominate the Automotive SCR market, driven by stringent emission regulations and a large installed base of diesel vehicles. Within the segment breakdown, Selective Catalytic Reduction (SCR) process type holds the largest market share (xx%), followed by Diesel Particulate Filters (DPF) (xx%). The "Power Generation (Excluding Coal-based)" application segment shows robust growth potential, driven by increasing power generation capacity. Within catalyst types, Honeycomb catalysts lead the market, owing to their superior performance and efficiency.
- Key Drivers: Stringent emission regulations, increasing vehicle production (particularly in Asia), and rising demand for cleaner air.
- Dominant Regions: North America and Europe currently hold the largest market share.
- Fastest Growing Segment: Power Generation (excluding Coal based) application segment.
- Dominant Process Type: Selective Catalytic Reduction (SCR).
- Dominant Catalyst Type: Honeycomb Catalyst
Automotive Selective Catalytic Reduction Market Product Landscape
The Automotive SCR market showcases a diverse range of products, encompassing various catalyst formulations meticulously engineered to optimize performance across different engine types and diverse operating conditions. Innovation within this sector is intensely focused on enhancing NOx reduction efficiency, extending catalyst lifespan, minimizing precious metal usage (reducing costs and environmental impact), and improving overall system durability. Key performance indicators (KPIs) include NOx conversion efficiency, backpressure, thermal durability, and ammonia slip. Competitive advantages are frequently established through superior performance, reduced operating costs, and unwavering compliance with the most stringent global emission standards. Recent technological advancements include the utilization of advanced materials (like zeolites and metal oxides), refined catalyst designs (e.g., improved washcoat formulations), and the development of integrated system solutions that seamlessly combine SCR with other emission control technologies. This integration optimizes efficiency and reduces complexity.
Key Drivers, Barriers & Challenges in Automotive Selective Catalytic Reduction Market
Key Drivers:
- Stringent government regulations mandating increasingly lower NOx emission limits globally.
- Growing public and regulatory awareness of air pollution's severe health consequences, driving demand for cleaner transportation.
- Increasing demand for fuel-efficient vehicles, which often incorporate SCR technology as a key component.
- Expanding infrastructure for urea and AdBlue distribution supporting SCR adoption.
Challenges & Restraints:
- High initial capital expenditure associated with the implementation of SCR systems.
- Potential for ammonia slip – the unintended release of ammonia – which can have negative environmental effects if not properly managed. Advanced catalyst designs and control systems are mitigating this risk.
- Price volatility in the precious metals (platinum, palladium, rhodium) utilized in catalyst manufacturing. This impacts profitability, potentially disrupting supply chains and affecting affordability and accessibility. Research into alternative catalyst materials is underway to address this challenge.
- The need for regular maintenance and AdBlue replenishment adds to the operational costs.
Emerging Opportunities in Automotive Selective Catalytic Reduction Market
- Expansion into developing markets: Growing vehicle ownership in developing countries presents significant opportunities.
- Development of advanced catalyst formulations: Research into more efficient and durable catalysts with reduced precious metal content can improve profitability and sustainability.
- Integration with other emission control technologies: Combining SCR with DPF and other after-treatment systems can enhance overall emission control.
Growth Accelerators in the Automotive Selective Catalytic Reduction Market Industry
Sustained long-term growth in the Automotive SCR market hinges on continuous technological breakthroughs resulting in more cost-effective and efficient SCR systems. Strategic alliances and collaborations between catalyst manufacturers and automotive Original Equipment Manufacturers (OEMs) are streamlining production processes and enhancing system integration. Expansion into high-growth emerging markets and the development of integrated emission control solutions that combine SCR with other technologies (like particulate filters (DPF) and diesel oxidation catalysts (DOC)) will significantly propel market expansion. The development of robust and cost-effective ammonia storage systems are also playing an important role.
Key Players Shaping the Automotive Selective Catalytic Reduction Market Market
- Umicore
- Honeywell International Inc
- Clariant
- JGC C&C
- CRI Catalyst Company
- DCL International Inc
- CDTi Advanced Materials Inc
- Hitachi Zosen Corporation
- CORMETECH
- BASF SE
- Cataler Corporation
- Johnson Matthey
- IBIDEN Porzellanfabrik Frauenthal
- Corning Incorporated
Notable Milestones in Automotive Selective Catalytic Reduction Market Sector
- 2022 Q3: Johnson Matthey announces a new generation of SCR catalysts with improved efficiency.
- 2021 Q4: Umicore acquires a smaller SCR catalyst manufacturer, expanding its market share.
- 2020 Q1: New emission regulations are implemented in Europe, significantly impacting the demand for SCR systems. (Further specific milestones can be added based on available data).
In-Depth Automotive Selective Catalytic Reduction Market Market Outlook
The Automotive SCR market presents a compelling outlook for continued growth, fueled by the synergy of persistent technological innovation, increasingly stringent emission regulations globally, and the expansion into lucrative new markets. Strategic investments in research and development (R&D), coupled with strategic partnerships and collaborations across the value chain, will be paramount for sustained competitiveness and success within this dynamic landscape. The market presents exceptional opportunities for companies capable of delivering innovative, cost-effective, and environmentally sustainable SCR solutions that meet evolving regulatory requirements and consumer demands.
Automotive Selective Catalytic Reduction Market Segmentation
-
1. Catalyst Type
- 1.1. Honeycomb Catalyst
- 1.2. Plate Catalyst
- 1.3. Corrugated Catalyst
-
2. Process Type
- 2.1. Selective Catalytic Reduction
- 2.2. Non-selective Catalytic Reduction
- 2.3. Diesel Particulate Filters
- 2.4. Catalytic Oxidation
-
3. Application
- 3.1. Power Generation (Excluding Coal based)
- 3.2. Coal-based Thermal Power Generation
- 3.3. Industrial
Automotive Selective Catalytic Reduction Market Segmentation By Geography
-
1. Asia Pacific
- 1.1. China
- 1.2. India
- 1.3. Japan
- 1.4. South Korea
- 1.5. ASEAN Countries
- 1.6. Rest of Asia Pacific
-
2. North America
- 2.1. United States
- 2.2. Canada
- 2.3. Mexico
-
3. Europe
- 3.1. Germany
- 3.2. United Kingdom
- 3.3. Italy
- 3.4. Russia
- 3.5. Rest of the Europe
-
4. South America
- 4.1. Brazil
- 4.2. Argentina
- 4.3. Rest of South America
-
5. Middle East and Africa
- 5.1. Saudi Arabia
- 5.2. South Africa
- 5.3. Rest of Middle East and Africa
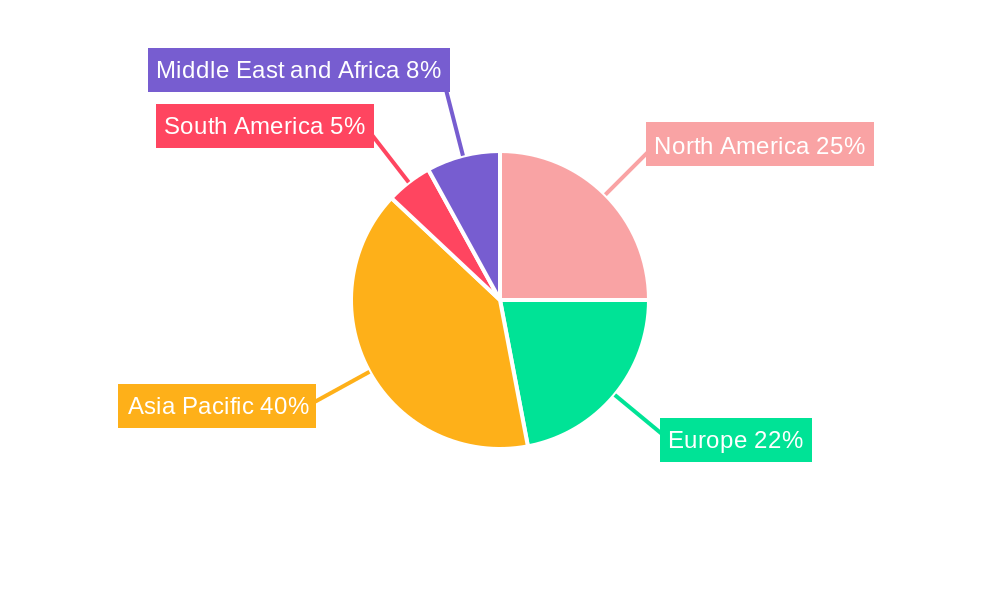
Automotive Selective Catalytic Reduction Market Regional Market Share
Geographic Coverage of Automotive Selective Catalytic Reduction Market
Automotive Selective Catalytic Reduction Market REPORT HIGHLIGHTS
| Aspects | Details |
|---|---|
| Study Period | 2020-2034 |
| Base Year | 2025 |
| Estimated Year | 2026 |
| Forecast Period | 2026-2034 |
| Historical Period | 2020-2025 |
| Growth Rate | CAGR of 11.8% from 2020-2034 |
| Segmentation |
|
Table of Contents
- 1. Introduction
- 1.1. Research Scope
- 1.2. Market Segmentation
- 1.3. Research Objective
- 1.4. Definitions and Assumptions
- 2. Executive Summary
- 2.1. Market Snapshot
- 3. Market Dynamics
- 3.1. Market Drivers
- 3.2. Market Restrains
- 3.3. Market Trends
- 3.4. Market Opportunities
- 4. Market Factor Analysis
- 4.1. Porters Five Forces
- 4.1.1. Bargaining Power of Suppliers
- 4.1.2. Bargaining Power of Buyers
- 4.1.3. Threat of New Entrants
- 4.1.4. Threat of Substitutes
- 4.1.5. Competitive Rivalry
- 4.2. PESTEL analysis
- 4.3. BCG Analysis
- 4.3.1. Stars (High Growth, High Market Share)
- 4.3.2. Cash Cows (Low Growth, High Market Share)
- 4.3.3. Question Mark (High Growth, Low Market Share)
- 4.3.4. Dogs (Low Growth, Low Market Share)
- 4.4. Ansoff Matrix Analysis
- 4.5. Supply Chain Analysis
- 4.6. Regulatory Landscape
- 4.7. Current Market Potential and Opportunity Assessment (TAM–SAM–SOM Framework)
- 4.8. VDR Analyst Note
- 4.1. Porters Five Forces
- 5. Market Analysis, Insights and Forecast 2021-2033
- 5.1. Market Analysis, Insights and Forecast - by Catalyst Type
- 5.1.1. Honeycomb Catalyst
- 5.1.2. Plate Catalyst
- 5.1.3. Corrugated Catalyst
- 5.2. Market Analysis, Insights and Forecast - by Process Type
- 5.2.1. Selective Catalytic Reduction
- 5.2.2. Non-selective Catalytic Reduction
- 5.2.3. Diesel Particulate Filters
- 5.2.4. Catalytic Oxidation
- 5.3. Market Analysis, Insights and Forecast - by Application
- 5.3.1. Power Generation (Excluding Coal based)
- 5.3.2. Coal-based Thermal Power Generation
- 5.3.3. Industrial
- 5.4. Market Analysis, Insights and Forecast - by Region
- 5.4.1. Asia Pacific
- 5.4.2. North America
- 5.4.3. Europe
- 5.4.4. South America
- 5.4.5. Middle East and Africa
- 5.1. Market Analysis, Insights and Forecast - by Catalyst Type
- 6. Global Automotive Selective Catalytic Reduction Market Analysis, Insights and Forecast, 2021-2033
- 6.1. Market Analysis, Insights and Forecast - by Catalyst Type
- 6.1.1. Honeycomb Catalyst
- 6.1.2. Plate Catalyst
- 6.1.3. Corrugated Catalyst
- 6.2. Market Analysis, Insights and Forecast - by Process Type
- 6.2.1. Selective Catalytic Reduction
- 6.2.2. Non-selective Catalytic Reduction
- 6.2.3. Diesel Particulate Filters
- 6.2.4. Catalytic Oxidation
- 6.3. Market Analysis, Insights and Forecast - by Application
- 6.3.1. Power Generation (Excluding Coal based)
- 6.3.2. Coal-based Thermal Power Generation
- 6.3.3. Industrial
- 6.1. Market Analysis, Insights and Forecast - by Catalyst Type
- 7. Asia Pacific Automotive Selective Catalytic Reduction Market Analysis, Insights and Forecast, 2021-2033
- 7.1. Market Analysis, Insights and Forecast - by Catalyst Type
- 7.1.1. Honeycomb Catalyst
- 7.1.2. Plate Catalyst
- 7.1.3. Corrugated Catalyst
- 7.2. Market Analysis, Insights and Forecast - by Process Type
- 7.2.1. Selective Catalytic Reduction
- 7.2.2. Non-selective Catalytic Reduction
- 7.2.3. Diesel Particulate Filters
- 7.2.4. Catalytic Oxidation
- 7.3. Market Analysis, Insights and Forecast - by Application
- 7.3.1. Power Generation (Excluding Coal based)
- 7.3.2. Coal-based Thermal Power Generation
- 7.3.3. Industrial
- 7.1. Market Analysis, Insights and Forecast - by Catalyst Type
- 8. North America Automotive Selective Catalytic Reduction Market Analysis, Insights and Forecast, 2021-2033
- 8.1. Market Analysis, Insights and Forecast - by Catalyst Type
- 8.1.1. Honeycomb Catalyst
- 8.1.2. Plate Catalyst
- 8.1.3. Corrugated Catalyst
- 8.2. Market Analysis, Insights and Forecast - by Process Type
- 8.2.1. Selective Catalytic Reduction
- 8.2.2. Non-selective Catalytic Reduction
- 8.2.3. Diesel Particulate Filters
- 8.2.4. Catalytic Oxidation
- 8.3. Market Analysis, Insights and Forecast - by Application
- 8.3.1. Power Generation (Excluding Coal based)
- 8.3.2. Coal-based Thermal Power Generation
- 8.3.3. Industrial
- 8.1. Market Analysis, Insights and Forecast - by Catalyst Type
- 9. Europe Automotive Selective Catalytic Reduction Market Analysis, Insights and Forecast, 2021-2033
- 9.1. Market Analysis, Insights and Forecast - by Catalyst Type
- 9.1.1. Honeycomb Catalyst
- 9.1.2. Plate Catalyst
- 9.1.3. Corrugated Catalyst
- 9.2. Market Analysis, Insights and Forecast - by Process Type
- 9.2.1. Selective Catalytic Reduction
- 9.2.2. Non-selective Catalytic Reduction
- 9.2.3. Diesel Particulate Filters
- 9.2.4. Catalytic Oxidation
- 9.3. Market Analysis, Insights and Forecast - by Application
- 9.3.1. Power Generation (Excluding Coal based)
- 9.3.2. Coal-based Thermal Power Generation
- 9.3.3. Industrial
- 9.1. Market Analysis, Insights and Forecast - by Catalyst Type
- 10. South America Automotive Selective Catalytic Reduction Market Analysis, Insights and Forecast, 2021-2033
- 10.1. Market Analysis, Insights and Forecast - by Catalyst Type
- 10.1.1. Honeycomb Catalyst
- 10.1.2. Plate Catalyst
- 10.1.3. Corrugated Catalyst
- 10.2. Market Analysis, Insights and Forecast - by Process Type
- 10.2.1. Selective Catalytic Reduction
- 10.2.2. Non-selective Catalytic Reduction
- 10.2.3. Diesel Particulate Filters
- 10.2.4. Catalytic Oxidation
- 10.3. Market Analysis, Insights and Forecast - by Application
- 10.3.1. Power Generation (Excluding Coal based)
- 10.3.2. Coal-based Thermal Power Generation
- 10.3.3. Industrial
- 10.1. Market Analysis, Insights and Forecast - by Catalyst Type
- 11. Middle East and Africa Automotive Selective Catalytic Reduction Market Analysis, Insights and Forecast, 2021-2033
- 11.1. Market Analysis, Insights and Forecast - by Catalyst Type
- 11.1.1. Honeycomb Catalyst
- 11.1.2. Plate Catalyst
- 11.1.3. Corrugated Catalyst
- 11.2. Market Analysis, Insights and Forecast - by Process Type
- 11.2.1. Selective Catalytic Reduction
- 11.2.2. Non-selective Catalytic Reduction
- 11.2.3. Diesel Particulate Filters
- 11.2.4. Catalytic Oxidation
- 11.3. Market Analysis, Insights and Forecast - by Application
- 11.3.1. Power Generation (Excluding Coal based)
- 11.3.2. Coal-based Thermal Power Generation
- 11.3.3. Industrial
- 11.1. Market Analysis, Insights and Forecast - by Catalyst Type
- 12. Competitive Analysis
- 12.1. Company Profiles
- 12.1.1 Umicore*List Not Exhaustive
- 12.1.1.1. Company Overview
- 12.1.1.2. Products
- 12.1.1.3. Company Financials
- 12.1.1.4. SWOT Analysis
- 12.1.2 Honeywell International Inc
- 12.1.2.1. Company Overview
- 12.1.2.2. Products
- 12.1.2.3. Company Financials
- 12.1.2.4. SWOT Analysis
- 12.1.3 Clariant
- 12.1.3.1. Company Overview
- 12.1.3.2. Products
- 12.1.3.3. Company Financials
- 12.1.3.4. SWOT Analysis
- 12.1.4 JGC C&C
- 12.1.4.1. Company Overview
- 12.1.4.2. Products
- 12.1.4.3. Company Financials
- 12.1.4.4. SWOT Analysis
- 12.1.5 CRI Catalyst Company
- 12.1.5.1. Company Overview
- 12.1.5.2. Products
- 12.1.5.3. Company Financials
- 12.1.5.4. SWOT Analysis
- 12.1.6 DCL International Inc
- 12.1.6.1. Company Overview
- 12.1.6.2. Products
- 12.1.6.3. Company Financials
- 12.1.6.4. SWOT Analysis
- 12.1.7 CDTi Advanced Materials Inc
- 12.1.7.1. Company Overview
- 12.1.7.2. Products
- 12.1.7.3. Company Financials
- 12.1.7.4. SWOT Analysis
- 12.1.8 Hitachi Zosen Corporation
- 12.1.8.1. Company Overview
- 12.1.8.2. Products
- 12.1.8.3. Company Financials
- 12.1.8.4. SWOT Analysis
- 12.1.9 CORMETECH
- 12.1.9.1. Company Overview
- 12.1.9.2. Products
- 12.1.9.3. Company Financials
- 12.1.9.4. SWOT Analysis
- 12.1.10 BASF SE
- 12.1.10.1. Company Overview
- 12.1.10.2. Products
- 12.1.10.3. Company Financials
- 12.1.10.4. SWOT Analysis
- 12.1.11 Cataler Corporation
- 12.1.11.1. Company Overview
- 12.1.11.2. Products
- 12.1.11.3. Company Financials
- 12.1.11.4. SWOT Analysis
- 12.1.12 Johnson Matthey
- 12.1.12.1. Company Overview
- 12.1.12.2. Products
- 12.1.12.3. Company Financials
- 12.1.12.4. SWOT Analysis
- 12.1.13 IBIDEN Porzellanfabrik Frauenthal
- 12.1.13.1. Company Overview
- 12.1.13.2. Products
- 12.1.13.3. Company Financials
- 12.1.13.4. SWOT Analysis
- 12.1.14 Corning Incorporated
- 12.1.14.1. Company Overview
- 12.1.14.2. Products
- 12.1.14.3. Company Financials
- 12.1.14.4. SWOT Analysis
- 12.1.1 Umicore*List Not Exhaustive
- 12.2. Market Entropy
- 12.2.1 Company's Key Areas Served
- 12.2.2 Recent Developments
- 12.3. Company Market Share Analysis 2025
- 12.3.1 Top 5 Companies Market Share Analysis
- 12.3.2 Top 3 Companies Market Share Analysis
- 12.4. List of Potential Customers
- 13. Research Methodology
List of Figures
- Figure 1: Global Automotive Selective Catalytic Reduction Market Revenue Breakdown (billion, %) by Region 2025 & 2033
- Figure 2: Asia Pacific Automotive Selective Catalytic Reduction Market Revenue (billion), by Catalyst Type 2025 & 2033
- Figure 3: Asia Pacific Automotive Selective Catalytic Reduction Market Revenue Share (%), by Catalyst Type 2025 & 2033
- Figure 4: Asia Pacific Automotive Selective Catalytic Reduction Market Revenue (billion), by Process Type 2025 & 2033
- Figure 5: Asia Pacific Automotive Selective Catalytic Reduction Market Revenue Share (%), by Process Type 2025 & 2033
- Figure 6: Asia Pacific Automotive Selective Catalytic Reduction Market Revenue (billion), by Application 2025 & 2033
- Figure 7: Asia Pacific Automotive Selective Catalytic Reduction Market Revenue Share (%), by Application 2025 & 2033
- Figure 8: Asia Pacific Automotive Selective Catalytic Reduction Market Revenue (billion), by Country 2025 & 2033
- Figure 9: Asia Pacific Automotive Selective Catalytic Reduction Market Revenue Share (%), by Country 2025 & 2033
- Figure 10: North America Automotive Selective Catalytic Reduction Market Revenue (billion), by Catalyst Type 2025 & 2033
- Figure 11: North America Automotive Selective Catalytic Reduction Market Revenue Share (%), by Catalyst Type 2025 & 2033
- Figure 12: North America Automotive Selective Catalytic Reduction Market Revenue (billion), by Process Type 2025 & 2033
- Figure 13: North America Automotive Selective Catalytic Reduction Market Revenue Share (%), by Process Type 2025 & 2033
- Figure 14: North America Automotive Selective Catalytic Reduction Market Revenue (billion), by Application 2025 & 2033
- Figure 15: North America Automotive Selective Catalytic Reduction Market Revenue Share (%), by Application 2025 & 2033
- Figure 16: North America Automotive Selective Catalytic Reduction Market Revenue (billion), by Country 2025 & 2033
- Figure 17: North America Automotive Selective Catalytic Reduction Market Revenue Share (%), by Country 2025 & 2033
- Figure 18: Europe Automotive Selective Catalytic Reduction Market Revenue (billion), by Catalyst Type 2025 & 2033
- Figure 19: Europe Automotive Selective Catalytic Reduction Market Revenue Share (%), by Catalyst Type 2025 & 2033
- Figure 20: Europe Automotive Selective Catalytic Reduction Market Revenue (billion), by Process Type 2025 & 2033
- Figure 21: Europe Automotive Selective Catalytic Reduction Market Revenue Share (%), by Process Type 2025 & 2033
- Figure 22: Europe Automotive Selective Catalytic Reduction Market Revenue (billion), by Application 2025 & 2033
- Figure 23: Europe Automotive Selective Catalytic Reduction Market Revenue Share (%), by Application 2025 & 2033
- Figure 24: Europe Automotive Selective Catalytic Reduction Market Revenue (billion), by Country 2025 & 2033
- Figure 25: Europe Automotive Selective Catalytic Reduction Market Revenue Share (%), by Country 2025 & 2033
- Figure 26: South America Automotive Selective Catalytic Reduction Market Revenue (billion), by Catalyst Type 2025 & 2033
- Figure 27: South America Automotive Selective Catalytic Reduction Market Revenue Share (%), by Catalyst Type 2025 & 2033
- Figure 28: South America Automotive Selective Catalytic Reduction Market Revenue (billion), by Process Type 2025 & 2033
- Figure 29: South America Automotive Selective Catalytic Reduction Market Revenue Share (%), by Process Type 2025 & 2033
- Figure 30: South America Automotive Selective Catalytic Reduction Market Revenue (billion), by Application 2025 & 2033
- Figure 31: South America Automotive Selective Catalytic Reduction Market Revenue Share (%), by Application 2025 & 2033
- Figure 32: South America Automotive Selective Catalytic Reduction Market Revenue (billion), by Country 2025 & 2033
- Figure 33: South America Automotive Selective Catalytic Reduction Market Revenue Share (%), by Country 2025 & 2033
- Figure 34: Middle East and Africa Automotive Selective Catalytic Reduction Market Revenue (billion), by Catalyst Type 2025 & 2033
- Figure 35: Middle East and Africa Automotive Selective Catalytic Reduction Market Revenue Share (%), by Catalyst Type 2025 & 2033
- Figure 36: Middle East and Africa Automotive Selective Catalytic Reduction Market Revenue (billion), by Process Type 2025 & 2033
- Figure 37: Middle East and Africa Automotive Selective Catalytic Reduction Market Revenue Share (%), by Process Type 2025 & 2033
- Figure 38: Middle East and Africa Automotive Selective Catalytic Reduction Market Revenue (billion), by Application 2025 & 2033
- Figure 39: Middle East and Africa Automotive Selective Catalytic Reduction Market Revenue Share (%), by Application 2025 & 2033
- Figure 40: Middle East and Africa Automotive Selective Catalytic Reduction Market Revenue (billion), by Country 2025 & 2033
- Figure 41: Middle East and Africa Automotive Selective Catalytic Reduction Market Revenue Share (%), by Country 2025 & 2033
List of Tables
- Table 1: Global Automotive Selective Catalytic Reduction Market Revenue billion Forecast, by Catalyst Type 2020 & 2033
- Table 2: Global Automotive Selective Catalytic Reduction Market Revenue billion Forecast, by Process Type 2020 & 2033
- Table 3: Global Automotive Selective Catalytic Reduction Market Revenue billion Forecast, by Application 2020 & 2033
- Table 4: Global Automotive Selective Catalytic Reduction Market Revenue billion Forecast, by Region 2020 & 2033
- Table 5: Global Automotive Selective Catalytic Reduction Market Revenue billion Forecast, by Catalyst Type 2020 & 2033
- Table 6: Global Automotive Selective Catalytic Reduction Market Revenue billion Forecast, by Process Type 2020 & 2033
- Table 7: Global Automotive Selective Catalytic Reduction Market Revenue billion Forecast, by Application 2020 & 2033
- Table 8: Global Automotive Selective Catalytic Reduction Market Revenue billion Forecast, by Country 2020 & 2033
- Table 9: China Automotive Selective Catalytic Reduction Market Revenue (billion) Forecast, by Application 2020 & 2033
- Table 10: India Automotive Selective Catalytic Reduction Market Revenue (billion) Forecast, by Application 2020 & 2033
- Table 11: Japan Automotive Selective Catalytic Reduction Market Revenue (billion) Forecast, by Application 2020 & 2033
- Table 12: South Korea Automotive Selective Catalytic Reduction Market Revenue (billion) Forecast, by Application 2020 & 2033
- Table 13: ASEAN Countries Automotive Selective Catalytic Reduction Market Revenue (billion) Forecast, by Application 2020 & 2033
- Table 14: Rest of Asia Pacific Automotive Selective Catalytic Reduction Market Revenue (billion) Forecast, by Application 2020 & 2033
- Table 15: Global Automotive Selective Catalytic Reduction Market Revenue billion Forecast, by Catalyst Type 2020 & 2033
- Table 16: Global Automotive Selective Catalytic Reduction Market Revenue billion Forecast, by Process Type 2020 & 2033
- Table 17: Global Automotive Selective Catalytic Reduction Market Revenue billion Forecast, by Application 2020 & 2033
- Table 18: Global Automotive Selective Catalytic Reduction Market Revenue billion Forecast, by Country 2020 & 2033
- Table 19: United States Automotive Selective Catalytic Reduction Market Revenue (billion) Forecast, by Application 2020 & 2033
- Table 20: Canada Automotive Selective Catalytic Reduction Market Revenue (billion) Forecast, by Application 2020 & 2033
- Table 21: Mexico Automotive Selective Catalytic Reduction Market Revenue (billion) Forecast, by Application 2020 & 2033
- Table 22: Global Automotive Selective Catalytic Reduction Market Revenue billion Forecast, by Catalyst Type 2020 & 2033
- Table 23: Global Automotive Selective Catalytic Reduction Market Revenue billion Forecast, by Process Type 2020 & 2033
- Table 24: Global Automotive Selective Catalytic Reduction Market Revenue billion Forecast, by Application 2020 & 2033
- Table 25: Global Automotive Selective Catalytic Reduction Market Revenue billion Forecast, by Country 2020 & 2033
- Table 26: Germany Automotive Selective Catalytic Reduction Market Revenue (billion) Forecast, by Application 2020 & 2033
- Table 27: United Kingdom Automotive Selective Catalytic Reduction Market Revenue (billion) Forecast, by Application 2020 & 2033
- Table 28: Italy Automotive Selective Catalytic Reduction Market Revenue (billion) Forecast, by Application 2020 & 2033
- Table 29: Russia Automotive Selective Catalytic Reduction Market Revenue (billion) Forecast, by Application 2020 & 2033
- Table 30: Rest of the Europe Automotive Selective Catalytic Reduction Market Revenue (billion) Forecast, by Application 2020 & 2033
- Table 31: Global Automotive Selective Catalytic Reduction Market Revenue billion Forecast, by Catalyst Type 2020 & 2033
- Table 32: Global Automotive Selective Catalytic Reduction Market Revenue billion Forecast, by Process Type 2020 & 2033
- Table 33: Global Automotive Selective Catalytic Reduction Market Revenue billion Forecast, by Application 2020 & 2033
- Table 34: Global Automotive Selective Catalytic Reduction Market Revenue billion Forecast, by Country 2020 & 2033
- Table 35: Brazil Automotive Selective Catalytic Reduction Market Revenue (billion) Forecast, by Application 2020 & 2033
- Table 36: Argentina Automotive Selective Catalytic Reduction Market Revenue (billion) Forecast, by Application 2020 & 2033
- Table 37: Rest of South America Automotive Selective Catalytic Reduction Market Revenue (billion) Forecast, by Application 2020 & 2033
- Table 38: Global Automotive Selective Catalytic Reduction Market Revenue billion Forecast, by Catalyst Type 2020 & 2033
- Table 39: Global Automotive Selective Catalytic Reduction Market Revenue billion Forecast, by Process Type 2020 & 2033
- Table 40: Global Automotive Selective Catalytic Reduction Market Revenue billion Forecast, by Application 2020 & 2033
- Table 41: Global Automotive Selective Catalytic Reduction Market Revenue billion Forecast, by Country 2020 & 2033
- Table 42: Saudi Arabia Automotive Selective Catalytic Reduction Market Revenue (billion) Forecast, by Application 2020 & 2033
- Table 43: South Africa Automotive Selective Catalytic Reduction Market Revenue (billion) Forecast, by Application 2020 & 2033
- Table 44: Rest of Middle East and Africa Automotive Selective Catalytic Reduction Market Revenue (billion) Forecast, by Application 2020 & 2033
Frequently Asked Questions
1. What is the projected Compound Annual Growth Rate (CAGR) of the Automotive Selective Catalytic Reduction Market?
The projected CAGR is approximately 11.8%.
2. Which companies are prominent players in the Automotive Selective Catalytic Reduction Market?
Key companies in the market include Umicore*List Not Exhaustive, Honeywell International Inc, Clariant, JGC C&C, CRI Catalyst Company, DCL International Inc, CDTi Advanced Materials Inc, Hitachi Zosen Corporation, CORMETECH, BASF SE, Cataler Corporation, Johnson Matthey, IBIDEN Porzellanfabrik Frauenthal, Corning Incorporated.
3. What are the main segments of the Automotive Selective Catalytic Reduction Market?
The market segments include Catalyst Type, Process Type, Application.
4. Can you provide details about the market size?
The market size is estimated to be USD 13.22 billion as of 2022.
5. What are some drivers contributing to market growth?
Increasing Demand due to Stringent Emission Standards of Developed Countries; Increasing Thermal Power Production Capacity in China and India.
6. What are the notable trends driving market growth?
Power Industry to Dominate the Market.
7. Are there any restraints impacting market growth?
Decline in Coal Based Thermal Power Generation in Western European Countries.
8. Can you provide examples of recent developments in the market?
N/A
9. What pricing options are available for accessing the report?
Pricing options include single-user, multi-user, and enterprise licenses priced at USD 4750, USD 5250, and USD 8750 respectively.
10. Is the market size provided in terms of value or volume?
The market size is provided in terms of value, measured in billion.
11. Are there any specific market keywords associated with the report?
Yes, the market keyword associated with the report is "Automotive Selective Catalytic Reduction Market," which aids in identifying and referencing the specific market segment covered.
12. How do I determine which pricing option suits my needs best?
The pricing options vary based on user requirements and access needs. Individual users may opt for single-user licenses, while businesses requiring broader access may choose multi-user or enterprise licenses for cost-effective access to the report.
13. Are there any additional resources or data provided in the Automotive Selective Catalytic Reduction Market report?
While the report offers comprehensive insights, it's advisable to review the specific contents or supplementary materials provided to ascertain if additional resources or data are available.
14. How can I stay updated on further developments or reports in the Automotive Selective Catalytic Reduction Market?
To stay informed about further developments, trends, and reports in the Automotive Selective Catalytic Reduction Market, consider subscribing to industry newsletters, following relevant companies and organizations, or regularly checking reputable industry news sources and publications.
Methodology
Step 1 - Identification of Relevant Samples Size from Population Database


Step 2 - Approaches for Defining Global Market Size (Value, Volume* & Price*)

Note*: In applicable scenarios
Step 3 - Data Sources
Primary Research
- Web Analytics
- Survey Reports
- Research Institute
- Latest Research Reports
- Opinion Leaders
Secondary Research
- Annual Reports
- White Paper
- Latest Press Release
- Industry Association
- Paid Database
- Investor Presentations

Step 4 - Data Triangulation
Involves using different sources of information in order to increase the validity of a study
These sources are likely to be stakeholders in a program - participants, other researchers, program staff, other community members, and so on.
Then we put all data in single framework & apply various statistical tools to find out the dynamic on the market.
During the analysis stage, feedback from the stakeholder groups would be compared to determine areas of agreement as well as areas of divergence