

Key Insights
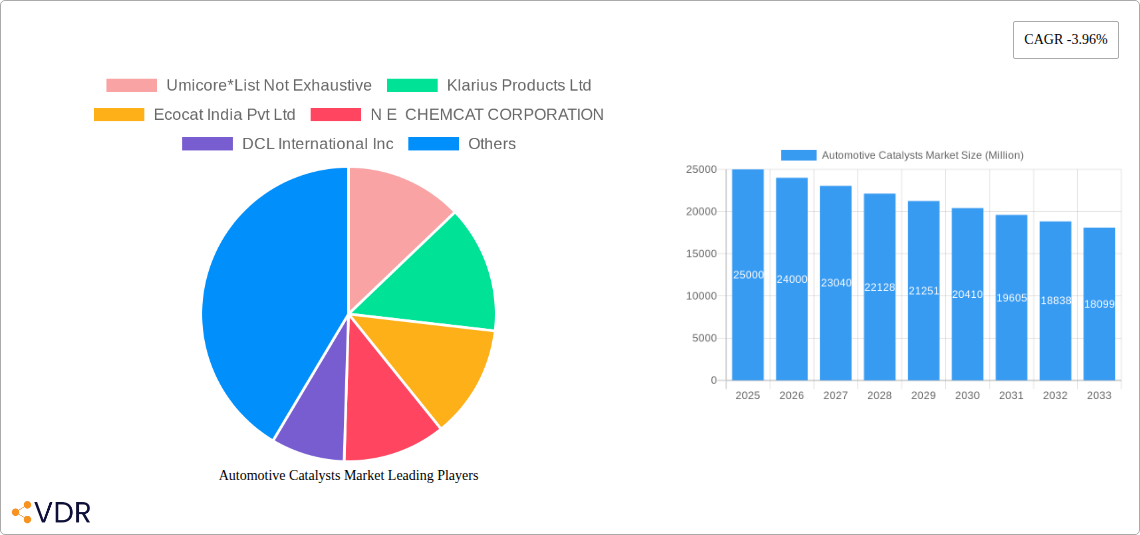
The automotive catalysts market, while facing a negative CAGR of -3.96% between 2019 and 2024, presents a complex picture for the forecast period (2025-2033). The decline likely reflects a combination of factors, including the maturation of established markets and shifts in vehicle technology. However, several factors could influence future growth. Stringent emission regulations worldwide, particularly in developing economies like India and China, continue to drive demand for catalysts in passenger cars and light commercial vehicles. The increasing adoption of electric vehicles (EVs) presents a significant challenge, but the market is adapting. Growth is likely to be concentrated in regions with expanding automotive industries and stricter environmental standards. Platinum, palladium, and rhodium remain dominant catalyst metals, although research and development into cost-effective alternatives could shift the market share in the coming years. The heavy commercial vehicle segment, with its higher emission levels, will likely continue to show comparatively stronger demand for catalysts than passenger cars, despite the EV transition. Key players like Umicore, Johnson Matthey, and BASF are heavily invested in R&D and strategic partnerships to navigate this evolving landscape and maintain market leadership. The competitive landscape is characterized by both established giants and emerging players, leading to ongoing innovation and price competition.
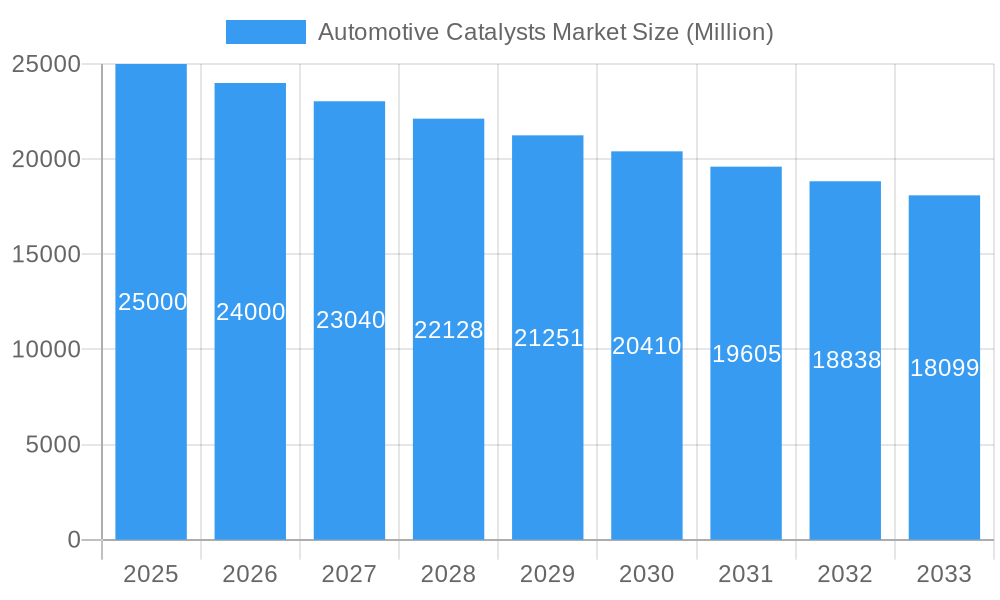
Automotive Catalysts Market Market Size (In Billion)
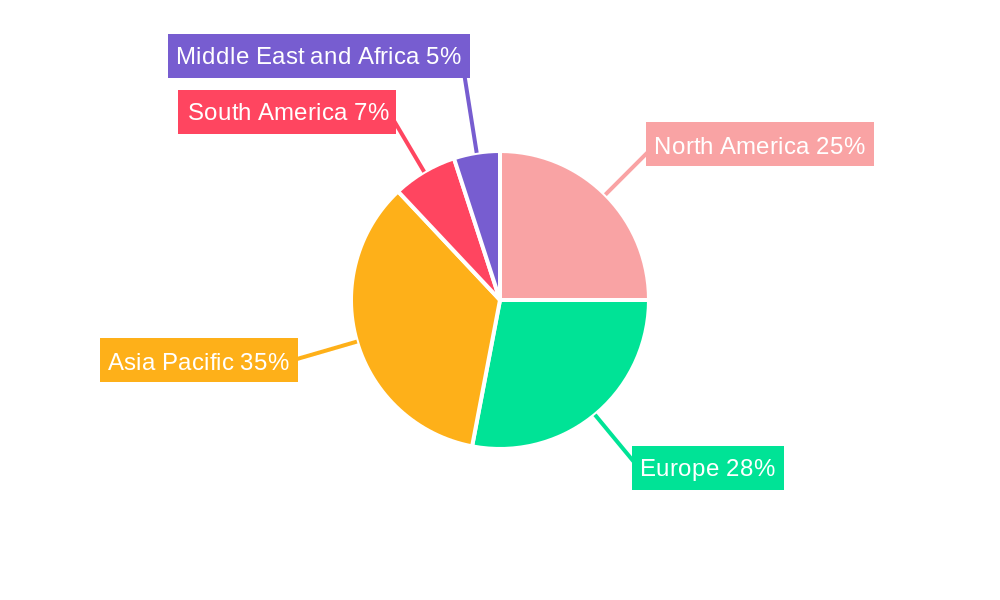
The market segmentation reveals regional disparities. While mature markets like North America and Europe may see slower growth or even decline, the Asia-Pacific region, fueled by burgeoning automotive manufacturing and expanding middle classes, may experience moderate growth, particularly in emerging economies. South America and the Middle East & Africa present opportunities for future growth, contingent on economic development and the implementation of stricter emission controls. The overall market trajectory is intricately linked to the pace of EV adoption and the success of alternative catalyst technologies. A nuanced understanding of these dynamics is crucial for businesses operating within this sector to formulate effective strategies for long-term success. Precise market size estimations for future years would require a deeper analysis of individual segment contributions and specific regional developments.
Automotive Catalysts Market Company Market Share
Automotive Catalysts Market: A Comprehensive Report (2019-2033)
This in-depth report provides a comprehensive analysis of the Automotive Catalysts Market, encompassing market dynamics, growth trends, regional performance, product landscape, key players, and future outlook. The study covers the period from 2019 to 2033, with a base year of 2025 and a forecast period from 2025 to 2033. The market is segmented by Type (Platinum, Palladium, Rhodium, Other Types) and Vehicle Type (Passenger Cars, Light Commercial Vehicles, Heavy Commercial Vehicles). The global market size in 2025 is estimated at xx Million units.
Automotive Catalysts Market Dynamics & Structure
The Automotive Catalysts market is characterized by a moderately concentrated structure, with key players holding significant market share. Umicore, Johnson Matthey, and BASF SE are among the leading companies, together commanding approximately xx% of the global market in 2025. Technological innovation, particularly in the development of more efficient and cost-effective catalysts, is a key driver. Stringent emission regulations globally are pushing the adoption of advanced catalyst technologies. The market also witnesses substantial M&A activity, with xx major deals recorded between 2019 and 2024, primarily focused on expanding geographical reach and technological capabilities. Competitive pressures from substitute technologies, such as selective catalytic reduction (SCR), pose a challenge.
- Market Concentration: Moderately concentrated, with top 5 players holding xx% market share in 2025.
- Technological Innovation: Focus on improving efficiency, reducing precious metal loading, and enhancing durability.
- Regulatory Framework: Stringent emission standards (e.g., Euro 7, California LEV III) driving demand.
- Competitive Substitutes: SCR systems, other emission control technologies posing competitive pressure.
- End-User Demographics: Growth driven by increasing vehicle sales, particularly in developing economies.
- M&A Trends: xx major deals (2019-2024), focusing on geographical expansion and technology acquisition.
Automotive Catalysts Market Growth Trends & Insights
The Automotive Catalysts market has experienced substantial growth over the past five years (2019-2024), with a CAGR of xx%. This growth is primarily attributed to the increasing stringency of emission regulations worldwide and the rising demand for vehicles, particularly in emerging markets. The adoption rate of advanced catalyst technologies, such as those incorporating novel materials and designs, is increasing steadily. Technological disruptions, including the development of more efficient and cost-effective catalysts, are driving market expansion. Consumer preferences for environmentally friendly vehicles are further fueling market demand. The market size is projected to reach xx Million units by 2033, with a forecast CAGR of xx% (2025-2033). Market penetration of advanced catalyst technologies is expected to reach xx% by 2033.
Dominant Regions, Countries, or Segments in Automotive Catalysts Market
The Asia-Pacific region is currently the dominant market for automotive catalysts, driven by robust vehicle production and stringent emission regulations in countries like China and India. Within the segment breakdown, Platinum-based catalysts hold the largest market share, followed by Palladium and Rhodium. Passenger cars account for the largest share of the vehicle type segment.
- Key Drivers in Asia-Pacific:
- Rapid growth in vehicle sales.
- Stringent emission standards.
- Increasing government support for clean transportation.
- Platinum Catalyst Dominance: Higher catalytic activity and superior performance compared to other types.
- Passenger Car Segment: Largest market share due to high vehicle production volumes.
Automotive Catalysts Market Product Landscape
Automotive catalysts are designed to convert harmful exhaust emissions into less harmful substances. Recent innovations focus on reducing precious metal loading while maintaining high efficiency. Advanced designs, such as using more efficient washcoats and improved catalyst geometries, enhance performance and durability. Unique selling propositions include improved conversion efficiency, longer lifespan, and reduced precious metal content.
Key Drivers, Barriers & Challenges in Automotive Catalysts Market
Key Drivers:
- Stringent emission regulations worldwide.
- Increasing vehicle production, especially in developing economies.
- Growing demand for fuel-efficient vehicles.
Challenges:
- Fluctuations in precious metal prices impacting production costs.
- Supply chain disruptions affecting the availability of raw materials.
- Competition from alternative emission control technologies. The impact of these challenges is estimated to reduce the market growth by approximately xx% by 2033.
Emerging Opportunities in Automotive Catalysts Market
- Growing demand for electric vehicles (EVs) presents opportunities for catalysts in battery manufacturing and onboard charging systems.
- Development of catalysts for alternative fuels, such as hydrogen, opens new market segments.
- The increasing focus on reducing greenhouse gas emissions creates opportunities for advanced catalyst technologies that capture carbon dioxide.
Growth Accelerators in the Automotive Catalysts Market Industry
Technological advancements in catalyst design and manufacturing, strategic partnerships between catalyst manufacturers and automotive OEMs, and expansion into emerging markets are driving long-term growth. Government incentives and regulations supporting the adoption of clean technologies further fuel market expansion.
Key Players Shaping the Automotive Catalysts Market Market
- Umicore
- Klarius Products Ltd
- Ecocat India Pvt Ltd
- N E CHEMCAT CORPORATION
- DCL International Inc
- CDTi Advanced Materials Inc
- BASF SE
- Tenneco Inc
- Cummins Inc
- Johnson Matthey
- CLARIANT
Notable Milestones in Automotive Catalysts Market Sector
- 2020: Introduction of new platinum-group metal (PGM)-lean catalysts by Johnson Matthey.
- 2021: Umicore announces a major investment in a new catalyst manufacturing facility in China.
- 2022: BASF SE partners with an automotive OEM to develop a next-generation catalyst for hybrid vehicles.
In-Depth Automotive Catalysts Market Market Outlook
The Automotive Catalysts market is poised for continued growth, driven by the strengthening regulatory environment, the increasing demand for fuel-efficient and environmentally friendly vehicles, and ongoing technological innovations. Strategic partnerships and investments in research and development will play a crucial role in shaping the future of this market. The market presents significant opportunities for companies that can develop and commercialize advanced catalyst technologies to meet the evolving emission control requirements.
Automotive Catalysts Market Segmentation
-
1. Type
- 1.1. Platinum
- 1.2. Palladium
- 1.3. Rhodium
- 1.4. Other Types
-
2. Vehicle Type
- 2.1. Passenger Cars
- 2.2. Light Commercial Vehicles
- 2.3. Heavy Commercial Vehicles
Automotive Catalysts Market Segmentation By Geography
-
1. Asia Pacific
- 1.1. China
- 1.2. India
- 1.3. Japan
- 1.4. South Korea
- 1.5. ASEAN Countries
- 1.6. Rest of Asia Pacific
-
2. North America
- 2.1. United States
- 2.2. Canada
- 2.3. Mexico
-
3. Europe
- 3.1. Germany
- 3.2. United Kingdom
- 3.3. France
- 3.4. Italy
- 3.5. Rest of Europe
-
4. South America
- 4.1. Brazil
- 4.2. Argentina
- 4.3. Rest of South America
-
5. Middle East and Africa
- 5.1. Saudi Arabia
- 5.2. South Africa
- 5.3. Rest of Middle East and Africa
Automotive Catalysts Market Regional Market Share
Geographic Coverage of Automotive Catalysts Market
Automotive Catalysts Market REPORT HIGHLIGHTS
| Aspects | Details |
|---|---|
| Study Period | 2020-2034 |
| Base Year | 2025 |
| Estimated Year | 2026 |
| Forecast Period | 2026-2034 |
| Historical Period | 2020-2025 |
| Growth Rate | CAGR of 5.2% from 2020-2034 |
| Segmentation |
|
Table of Contents
- 1. Introduction
- 1.1. Research Scope
- 1.2. Market Segmentation
- 1.3. Research Objective
- 1.4. Definitions and Assumptions
- 2. Executive Summary
- 2.1. Market Snapshot
- 3. Market Dynamics
- 3.1. Market Drivers
- 3.2. Market Restrains
- 3.3. Market Trends
- 3.4. Market Opportunities
- 4. Market Factor Analysis
- 4.1. Porters Five Forces
- 4.1.1. Bargaining Power of Suppliers
- 4.1.2. Bargaining Power of Buyers
- 4.1.3. Threat of New Entrants
- 4.1.4. Threat of Substitutes
- 4.1.5. Competitive Rivalry
- 4.2. PESTEL analysis
- 4.3. BCG Analysis
- 4.3.1. Stars (High Growth, High Market Share)
- 4.3.2. Cash Cows (Low Growth, High Market Share)
- 4.3.3. Question Mark (High Growth, Low Market Share)
- 4.3.4. Dogs (Low Growth, Low Market Share)
- 4.4. Ansoff Matrix Analysis
- 4.5. Supply Chain Analysis
- 4.6. Regulatory Landscape
- 4.7. Current Market Potential and Opportunity Assessment (TAM–SAM–SOM Framework)
- 4.8. VDR Analyst Note
- 4.1. Porters Five Forces
- 5. Market Analysis, Insights and Forecast 2021-2033
- 5.1. Market Analysis, Insights and Forecast - by Type
- 5.1.1. Platinum
- 5.1.2. Palladium
- 5.1.3. Rhodium
- 5.1.4. Other Types
- 5.2. Market Analysis, Insights and Forecast - by Vehicle Type
- 5.2.1. Passenger Cars
- 5.2.2. Light Commercial Vehicles
- 5.2.3. Heavy Commercial Vehicles
- 5.3. Market Analysis, Insights and Forecast - by Region
- 5.3.1. Asia Pacific
- 5.3.2. North America
- 5.3.3. Europe
- 5.3.4. South America
- 5.3.5. Middle East and Africa
- 5.1. Market Analysis, Insights and Forecast - by Type
- 6. Global Automotive Catalysts Market Analysis, Insights and Forecast, 2021-2033
- 6.1. Market Analysis, Insights and Forecast - by Type
- 6.1.1. Platinum
- 6.1.2. Palladium
- 6.1.3. Rhodium
- 6.1.4. Other Types
- 6.2. Market Analysis, Insights and Forecast - by Vehicle Type
- 6.2.1. Passenger Cars
- 6.2.2. Light Commercial Vehicles
- 6.2.3. Heavy Commercial Vehicles
- 6.1. Market Analysis, Insights and Forecast - by Type
- 7. Asia Pacific Automotive Catalysts Market Analysis, Insights and Forecast, 2021-2033
- 7.1. Market Analysis, Insights and Forecast - by Type
- 7.1.1. Platinum
- 7.1.2. Palladium
- 7.1.3. Rhodium
- 7.1.4. Other Types
- 7.2. Market Analysis, Insights and Forecast - by Vehicle Type
- 7.2.1. Passenger Cars
- 7.2.2. Light Commercial Vehicles
- 7.2.3. Heavy Commercial Vehicles
- 7.1. Market Analysis, Insights and Forecast - by Type
- 8. North America Automotive Catalysts Market Analysis, Insights and Forecast, 2021-2033
- 8.1. Market Analysis, Insights and Forecast - by Type
- 8.1.1. Platinum
- 8.1.2. Palladium
- 8.1.3. Rhodium
- 8.1.4. Other Types
- 8.2. Market Analysis, Insights and Forecast - by Vehicle Type
- 8.2.1. Passenger Cars
- 8.2.2. Light Commercial Vehicles
- 8.2.3. Heavy Commercial Vehicles
- 8.1. Market Analysis, Insights and Forecast - by Type
- 9. Europe Automotive Catalysts Market Analysis, Insights and Forecast, 2021-2033
- 9.1. Market Analysis, Insights and Forecast - by Type
- 9.1.1. Platinum
- 9.1.2. Palladium
- 9.1.3. Rhodium
- 9.1.4. Other Types
- 9.2. Market Analysis, Insights and Forecast - by Vehicle Type
- 9.2.1. Passenger Cars
- 9.2.2. Light Commercial Vehicles
- 9.2.3. Heavy Commercial Vehicles
- 9.1. Market Analysis, Insights and Forecast - by Type
- 10. South America Automotive Catalysts Market Analysis, Insights and Forecast, 2021-2033
- 10.1. Market Analysis, Insights and Forecast - by Type
- 10.1.1. Platinum
- 10.1.2. Palladium
- 10.1.3. Rhodium
- 10.1.4. Other Types
- 10.2. Market Analysis, Insights and Forecast - by Vehicle Type
- 10.2.1. Passenger Cars
- 10.2.2. Light Commercial Vehicles
- 10.2.3. Heavy Commercial Vehicles
- 10.1. Market Analysis, Insights and Forecast - by Type
- 11. Middle East and Africa Automotive Catalysts Market Analysis, Insights and Forecast, 2021-2033
- 11.1. Market Analysis, Insights and Forecast - by Type
- 11.1.1. Platinum
- 11.1.2. Palladium
- 11.1.3. Rhodium
- 11.1.4. Other Types
- 11.2. Market Analysis, Insights and Forecast - by Vehicle Type
- 11.2.1. Passenger Cars
- 11.2.2. Light Commercial Vehicles
- 11.2.3. Heavy Commercial Vehicles
- 11.1. Market Analysis, Insights and Forecast - by Type
- 12. Competitive Analysis
- 12.1. Company Profiles
- 12.1.1 Umicore*List Not Exhaustive
- 12.1.1.1. Company Overview
- 12.1.1.2. Products
- 12.1.1.3. Company Financials
- 12.1.1.4. SWOT Analysis
- 12.1.2 Klarius Products Ltd
- 12.1.2.1. Company Overview
- 12.1.2.2. Products
- 12.1.2.3. Company Financials
- 12.1.2.4. SWOT Analysis
- 12.1.3 Ecocat India Pvt Ltd
- 12.1.3.1. Company Overview
- 12.1.3.2. Products
- 12.1.3.3. Company Financials
- 12.1.3.4. SWOT Analysis
- 12.1.4 N E CHEMCAT CORPORATION
- 12.1.4.1. Company Overview
- 12.1.4.2. Products
- 12.1.4.3. Company Financials
- 12.1.4.4. SWOT Analysis
- 12.1.5 DCL International Inc
- 12.1.5.1. Company Overview
- 12.1.5.2. Products
- 12.1.5.3. Company Financials
- 12.1.5.4. SWOT Analysis
- 12.1.6 CDTi Advanced Materials Inc
- 12.1.6.1. Company Overview
- 12.1.6.2. Products
- 12.1.6.3. Company Financials
- 12.1.6.4. SWOT Analysis
- 12.1.7 BASF SE
- 12.1.7.1. Company Overview
- 12.1.7.2. Products
- 12.1.7.3. Company Financials
- 12.1.7.4. SWOT Analysis
- 12.1.8 Tenneco Inc
- 12.1.8.1. Company Overview
- 12.1.8.2. Products
- 12.1.8.3. Company Financials
- 12.1.8.4. SWOT Analysis
- 12.1.9 Cummins Inc
- 12.1.9.1. Company Overview
- 12.1.9.2. Products
- 12.1.9.3. Company Financials
- 12.1.9.4. SWOT Analysis
- 12.1.10 Johnson Matthey
- 12.1.10.1. Company Overview
- 12.1.10.2. Products
- 12.1.10.3. Company Financials
- 12.1.10.4. SWOT Analysis
- 12.1.11 CLARIANT
- 12.1.11.1. Company Overview
- 12.1.11.2. Products
- 12.1.11.3. Company Financials
- 12.1.11.4. SWOT Analysis
- 12.1.1 Umicore*List Not Exhaustive
- 12.2. Market Entropy
- 12.2.1 Company's Key Areas Served
- 12.2.2 Recent Developments
- 12.3. Company Market Share Analysis 2025
- 12.3.1 Top 5 Companies Market Share Analysis
- 12.3.2 Top 3 Companies Market Share Analysis
- 12.4. List of Potential Customers
- 13. Research Methodology
List of Figures
- Figure 1: Global Automotive Catalysts Market Revenue Breakdown (billion, %) by Region 2025 & 2033
- Figure 2: Global Automotive Catalysts Market Volume Breakdown (Thousand, %) by Region 2025 & 2033
- Figure 3: Asia Pacific Automotive Catalysts Market Revenue (billion), by Type 2025 & 2033
- Figure 4: Asia Pacific Automotive Catalysts Market Volume (Thousand), by Type 2025 & 2033
- Figure 5: Asia Pacific Automotive Catalysts Market Revenue Share (%), by Type 2025 & 2033
- Figure 6: Asia Pacific Automotive Catalysts Market Volume Share (%), by Type 2025 & 2033
- Figure 7: Asia Pacific Automotive Catalysts Market Revenue (billion), by Vehicle Type 2025 & 2033
- Figure 8: Asia Pacific Automotive Catalysts Market Volume (Thousand), by Vehicle Type 2025 & 2033
- Figure 9: Asia Pacific Automotive Catalysts Market Revenue Share (%), by Vehicle Type 2025 & 2033
- Figure 10: Asia Pacific Automotive Catalysts Market Volume Share (%), by Vehicle Type 2025 & 2033
- Figure 11: Asia Pacific Automotive Catalysts Market Revenue (billion), by Country 2025 & 2033
- Figure 12: Asia Pacific Automotive Catalysts Market Volume (Thousand), by Country 2025 & 2033
- Figure 13: Asia Pacific Automotive Catalysts Market Revenue Share (%), by Country 2025 & 2033
- Figure 14: Asia Pacific Automotive Catalysts Market Volume Share (%), by Country 2025 & 2033
- Figure 15: North America Automotive Catalysts Market Revenue (billion), by Type 2025 & 2033
- Figure 16: North America Automotive Catalysts Market Volume (Thousand), by Type 2025 & 2033
- Figure 17: North America Automotive Catalysts Market Revenue Share (%), by Type 2025 & 2033
- Figure 18: North America Automotive Catalysts Market Volume Share (%), by Type 2025 & 2033
- Figure 19: North America Automotive Catalysts Market Revenue (billion), by Vehicle Type 2025 & 2033
- Figure 20: North America Automotive Catalysts Market Volume (Thousand), by Vehicle Type 2025 & 2033
- Figure 21: North America Automotive Catalysts Market Revenue Share (%), by Vehicle Type 2025 & 2033
- Figure 22: North America Automotive Catalysts Market Volume Share (%), by Vehicle Type 2025 & 2033
- Figure 23: North America Automotive Catalysts Market Revenue (billion), by Country 2025 & 2033
- Figure 24: North America Automotive Catalysts Market Volume (Thousand), by Country 2025 & 2033
- Figure 25: North America Automotive Catalysts Market Revenue Share (%), by Country 2025 & 2033
- Figure 26: North America Automotive Catalysts Market Volume Share (%), by Country 2025 & 2033
- Figure 27: Europe Automotive Catalysts Market Revenue (billion), by Type 2025 & 2033
- Figure 28: Europe Automotive Catalysts Market Volume (Thousand), by Type 2025 & 2033
- Figure 29: Europe Automotive Catalysts Market Revenue Share (%), by Type 2025 & 2033
- Figure 30: Europe Automotive Catalysts Market Volume Share (%), by Type 2025 & 2033
- Figure 31: Europe Automotive Catalysts Market Revenue (billion), by Vehicle Type 2025 & 2033
- Figure 32: Europe Automotive Catalysts Market Volume (Thousand), by Vehicle Type 2025 & 2033
- Figure 33: Europe Automotive Catalysts Market Revenue Share (%), by Vehicle Type 2025 & 2033
- Figure 34: Europe Automotive Catalysts Market Volume Share (%), by Vehicle Type 2025 & 2033
- Figure 35: Europe Automotive Catalysts Market Revenue (billion), by Country 2025 & 2033
- Figure 36: Europe Automotive Catalysts Market Volume (Thousand), by Country 2025 & 2033
- Figure 37: Europe Automotive Catalysts Market Revenue Share (%), by Country 2025 & 2033
- Figure 38: Europe Automotive Catalysts Market Volume Share (%), by Country 2025 & 2033
- Figure 39: South America Automotive Catalysts Market Revenue (billion), by Type 2025 & 2033
- Figure 40: South America Automotive Catalysts Market Volume (Thousand), by Type 2025 & 2033
- Figure 41: South America Automotive Catalysts Market Revenue Share (%), by Type 2025 & 2033
- Figure 42: South America Automotive Catalysts Market Volume Share (%), by Type 2025 & 2033
- Figure 43: South America Automotive Catalysts Market Revenue (billion), by Vehicle Type 2025 & 2033
- Figure 44: South America Automotive Catalysts Market Volume (Thousand), by Vehicle Type 2025 & 2033
- Figure 45: South America Automotive Catalysts Market Revenue Share (%), by Vehicle Type 2025 & 2033
- Figure 46: South America Automotive Catalysts Market Volume Share (%), by Vehicle Type 2025 & 2033
- Figure 47: South America Automotive Catalysts Market Revenue (billion), by Country 2025 & 2033
- Figure 48: South America Automotive Catalysts Market Volume (Thousand), by Country 2025 & 2033
- Figure 49: South America Automotive Catalysts Market Revenue Share (%), by Country 2025 & 2033
- Figure 50: South America Automotive Catalysts Market Volume Share (%), by Country 2025 & 2033
- Figure 51: Middle East and Africa Automotive Catalysts Market Revenue (billion), by Type 2025 & 2033
- Figure 52: Middle East and Africa Automotive Catalysts Market Volume (Thousand), by Type 2025 & 2033
- Figure 53: Middle East and Africa Automotive Catalysts Market Revenue Share (%), by Type 2025 & 2033
- Figure 54: Middle East and Africa Automotive Catalysts Market Volume Share (%), by Type 2025 & 2033
- Figure 55: Middle East and Africa Automotive Catalysts Market Revenue (billion), by Vehicle Type 2025 & 2033
- Figure 56: Middle East and Africa Automotive Catalysts Market Volume (Thousand), by Vehicle Type 2025 & 2033
- Figure 57: Middle East and Africa Automotive Catalysts Market Revenue Share (%), by Vehicle Type 2025 & 2033
- Figure 58: Middle East and Africa Automotive Catalysts Market Volume Share (%), by Vehicle Type 2025 & 2033
- Figure 59: Middle East and Africa Automotive Catalysts Market Revenue (billion), by Country 2025 & 2033
- Figure 60: Middle East and Africa Automotive Catalysts Market Volume (Thousand), by Country 2025 & 2033
- Figure 61: Middle East and Africa Automotive Catalysts Market Revenue Share (%), by Country 2025 & 2033
- Figure 62: Middle East and Africa Automotive Catalysts Market Volume Share (%), by Country 2025 & 2033
List of Tables
- Table 1: Global Automotive Catalysts Market Revenue billion Forecast, by Type 2020 & 2033
- Table 2: Global Automotive Catalysts Market Volume Thousand Forecast, by Type 2020 & 2033
- Table 3: Global Automotive Catalysts Market Revenue billion Forecast, by Vehicle Type 2020 & 2033
- Table 4: Global Automotive Catalysts Market Volume Thousand Forecast, by Vehicle Type 2020 & 2033
- Table 5: Global Automotive Catalysts Market Revenue billion Forecast, by Region 2020 & 2033
- Table 6: Global Automotive Catalysts Market Volume Thousand Forecast, by Region 2020 & 2033
- Table 7: Global Automotive Catalysts Market Revenue billion Forecast, by Type 2020 & 2033
- Table 8: Global Automotive Catalysts Market Volume Thousand Forecast, by Type 2020 & 2033
- Table 9: Global Automotive Catalysts Market Revenue billion Forecast, by Vehicle Type 2020 & 2033
- Table 10: Global Automotive Catalysts Market Volume Thousand Forecast, by Vehicle Type 2020 & 2033
- Table 11: Global Automotive Catalysts Market Revenue billion Forecast, by Country 2020 & 2033
- Table 12: Global Automotive Catalysts Market Volume Thousand Forecast, by Country 2020 & 2033
- Table 13: China Automotive Catalysts Market Revenue (billion) Forecast, by Application 2020 & 2033
- Table 14: China Automotive Catalysts Market Volume (Thousand) Forecast, by Application 2020 & 2033
- Table 15: India Automotive Catalysts Market Revenue (billion) Forecast, by Application 2020 & 2033
- Table 16: India Automotive Catalysts Market Volume (Thousand) Forecast, by Application 2020 & 2033
- Table 17: Japan Automotive Catalysts Market Revenue (billion) Forecast, by Application 2020 & 2033
- Table 18: Japan Automotive Catalysts Market Volume (Thousand) Forecast, by Application 2020 & 2033
- Table 19: South Korea Automotive Catalysts Market Revenue (billion) Forecast, by Application 2020 & 2033
- Table 20: South Korea Automotive Catalysts Market Volume (Thousand) Forecast, by Application 2020 & 2033
- Table 21: ASEAN Countries Automotive Catalysts Market Revenue (billion) Forecast, by Application 2020 & 2033
- Table 22: ASEAN Countries Automotive Catalysts Market Volume (Thousand) Forecast, by Application 2020 & 2033
- Table 23: Rest of Asia Pacific Automotive Catalysts Market Revenue (billion) Forecast, by Application 2020 & 2033
- Table 24: Rest of Asia Pacific Automotive Catalysts Market Volume (Thousand) Forecast, by Application 2020 & 2033
- Table 25: Global Automotive Catalysts Market Revenue billion Forecast, by Type 2020 & 2033
- Table 26: Global Automotive Catalysts Market Volume Thousand Forecast, by Type 2020 & 2033
- Table 27: Global Automotive Catalysts Market Revenue billion Forecast, by Vehicle Type 2020 & 2033
- Table 28: Global Automotive Catalysts Market Volume Thousand Forecast, by Vehicle Type 2020 & 2033
- Table 29: Global Automotive Catalysts Market Revenue billion Forecast, by Country 2020 & 2033
- Table 30: Global Automotive Catalysts Market Volume Thousand Forecast, by Country 2020 & 2033
- Table 31: United States Automotive Catalysts Market Revenue (billion) Forecast, by Application 2020 & 2033
- Table 32: United States Automotive Catalysts Market Volume (Thousand) Forecast, by Application 2020 & 2033
- Table 33: Canada Automotive Catalysts Market Revenue (billion) Forecast, by Application 2020 & 2033
- Table 34: Canada Automotive Catalysts Market Volume (Thousand) Forecast, by Application 2020 & 2033
- Table 35: Mexico Automotive Catalysts Market Revenue (billion) Forecast, by Application 2020 & 2033
- Table 36: Mexico Automotive Catalysts Market Volume (Thousand) Forecast, by Application 2020 & 2033
- Table 37: Global Automotive Catalysts Market Revenue billion Forecast, by Type 2020 & 2033
- Table 38: Global Automotive Catalysts Market Volume Thousand Forecast, by Type 2020 & 2033
- Table 39: Global Automotive Catalysts Market Revenue billion Forecast, by Vehicle Type 2020 & 2033
- Table 40: Global Automotive Catalysts Market Volume Thousand Forecast, by Vehicle Type 2020 & 2033
- Table 41: Global Automotive Catalysts Market Revenue billion Forecast, by Country 2020 & 2033
- Table 42: Global Automotive Catalysts Market Volume Thousand Forecast, by Country 2020 & 2033
- Table 43: Germany Automotive Catalysts Market Revenue (billion) Forecast, by Application 2020 & 2033
- Table 44: Germany Automotive Catalysts Market Volume (Thousand) Forecast, by Application 2020 & 2033
- Table 45: United Kingdom Automotive Catalysts Market Revenue (billion) Forecast, by Application 2020 & 2033
- Table 46: United Kingdom Automotive Catalysts Market Volume (Thousand) Forecast, by Application 2020 & 2033
- Table 47: France Automotive Catalysts Market Revenue (billion) Forecast, by Application 2020 & 2033
- Table 48: France Automotive Catalysts Market Volume (Thousand) Forecast, by Application 2020 & 2033
- Table 49: Italy Automotive Catalysts Market Revenue (billion) Forecast, by Application 2020 & 2033
- Table 50: Italy Automotive Catalysts Market Volume (Thousand) Forecast, by Application 2020 & 2033
- Table 51: Rest of Europe Automotive Catalysts Market Revenue (billion) Forecast, by Application 2020 & 2033
- Table 52: Rest of Europe Automotive Catalysts Market Volume (Thousand) Forecast, by Application 2020 & 2033
- Table 53: Global Automotive Catalysts Market Revenue billion Forecast, by Type 2020 & 2033
- Table 54: Global Automotive Catalysts Market Volume Thousand Forecast, by Type 2020 & 2033
- Table 55: Global Automotive Catalysts Market Revenue billion Forecast, by Vehicle Type 2020 & 2033
- Table 56: Global Automotive Catalysts Market Volume Thousand Forecast, by Vehicle Type 2020 & 2033
- Table 57: Global Automotive Catalysts Market Revenue billion Forecast, by Country 2020 & 2033
- Table 58: Global Automotive Catalysts Market Volume Thousand Forecast, by Country 2020 & 2033
- Table 59: Brazil Automotive Catalysts Market Revenue (billion) Forecast, by Application 2020 & 2033
- Table 60: Brazil Automotive Catalysts Market Volume (Thousand) Forecast, by Application 2020 & 2033
- Table 61: Argentina Automotive Catalysts Market Revenue (billion) Forecast, by Application 2020 & 2033
- Table 62: Argentina Automotive Catalysts Market Volume (Thousand) Forecast, by Application 2020 & 2033
- Table 63: Rest of South America Automotive Catalysts Market Revenue (billion) Forecast, by Application 2020 & 2033
- Table 64: Rest of South America Automotive Catalysts Market Volume (Thousand) Forecast, by Application 2020 & 2033
- Table 65: Global Automotive Catalysts Market Revenue billion Forecast, by Type 2020 & 2033
- Table 66: Global Automotive Catalysts Market Volume Thousand Forecast, by Type 2020 & 2033
- Table 67: Global Automotive Catalysts Market Revenue billion Forecast, by Vehicle Type 2020 & 2033
- Table 68: Global Automotive Catalysts Market Volume Thousand Forecast, by Vehicle Type 2020 & 2033
- Table 69: Global Automotive Catalysts Market Revenue billion Forecast, by Country 2020 & 2033
- Table 70: Global Automotive Catalysts Market Volume Thousand Forecast, by Country 2020 & 2033
- Table 71: Saudi Arabia Automotive Catalysts Market Revenue (billion) Forecast, by Application 2020 & 2033
- Table 72: Saudi Arabia Automotive Catalysts Market Volume (Thousand) Forecast, by Application 2020 & 2033
- Table 73: South Africa Automotive Catalysts Market Revenue (billion) Forecast, by Application 2020 & 2033
- Table 74: South Africa Automotive Catalysts Market Volume (Thousand) Forecast, by Application 2020 & 2033
- Table 75: Rest of Middle East and Africa Automotive Catalysts Market Revenue (billion) Forecast, by Application 2020 & 2033
- Table 76: Rest of Middle East and Africa Automotive Catalysts Market Volume (Thousand) Forecast, by Application 2020 & 2033
Frequently Asked Questions
1. What is the projected Compound Annual Growth Rate (CAGR) of the Automotive Catalysts Market?
The projected CAGR is approximately 5.2%.
2. Which companies are prominent players in the Automotive Catalysts Market?
Key companies in the market include Umicore*List Not Exhaustive, Klarius Products Ltd, Ecocat India Pvt Ltd, N E CHEMCAT CORPORATION, DCL International Inc, CDTi Advanced Materials Inc, BASF SE, Tenneco Inc, Cummins Inc, Johnson Matthey, CLARIANT.
3. What are the main segments of the Automotive Catalysts Market?
The market segments include Type, Vehicle Type.
4. Can you provide details about the market size?
The market size is estimated to be USD 92.05 billion as of 2022.
5. What are some drivers contributing to market growth?
Increase in Automobile Production; Stringent Regulations Related to Automotive Emission; Other Drivers.
6. What are the notable trends driving market growth?
The Passenger Cars Segment to Dominate the Market.
7. Are there any restraints impacting market growth?
Rise in Popularity of Electric Vehicles; Other Restraints.
8. Can you provide examples of recent developments in the market?
N/A
9. What pricing options are available for accessing the report?
Pricing options include single-user, multi-user, and enterprise licenses priced at USD 4750, USD 5250, and USD 8750 respectively.
10. Is the market size provided in terms of value or volume?
The market size is provided in terms of value, measured in billion and volume, measured in Thousand.
11. Are there any specific market keywords associated with the report?
Yes, the market keyword associated with the report is "Automotive Catalysts Market," which aids in identifying and referencing the specific market segment covered.
12. How do I determine which pricing option suits my needs best?
The pricing options vary based on user requirements and access needs. Individual users may opt for single-user licenses, while businesses requiring broader access may choose multi-user or enterprise licenses for cost-effective access to the report.
13. Are there any additional resources or data provided in the Automotive Catalysts Market report?
While the report offers comprehensive insights, it's advisable to review the specific contents or supplementary materials provided to ascertain if additional resources or data are available.
14. How can I stay updated on further developments or reports in the Automotive Catalysts Market?
To stay informed about further developments, trends, and reports in the Automotive Catalysts Market, consider subscribing to industry newsletters, following relevant companies and organizations, or regularly checking reputable industry news sources and publications.
Methodology
Step 1 - Identification of Relevant Samples Size from Population Database


Step 2 - Approaches for Defining Global Market Size (Value, Volume* & Price*)

Note*: In applicable scenarios
Step 3 - Data Sources
Primary Research
- Web Analytics
- Survey Reports
- Research Institute
- Latest Research Reports
- Opinion Leaders
Secondary Research
- Annual Reports
- White Paper
- Latest Press Release
- Industry Association
- Paid Database
- Investor Presentations

Step 4 - Data Triangulation
Involves using different sources of information in order to increase the validity of a study
These sources are likely to be stakeholders in a program - participants, other researchers, program staff, other community members, and so on.
Then we put all data in single framework & apply various statistical tools to find out the dynamic on the market.
During the analysis stage, feedback from the stakeholder groups would be compared to determine areas of agreement as well as areas of divergence