

Key Insights
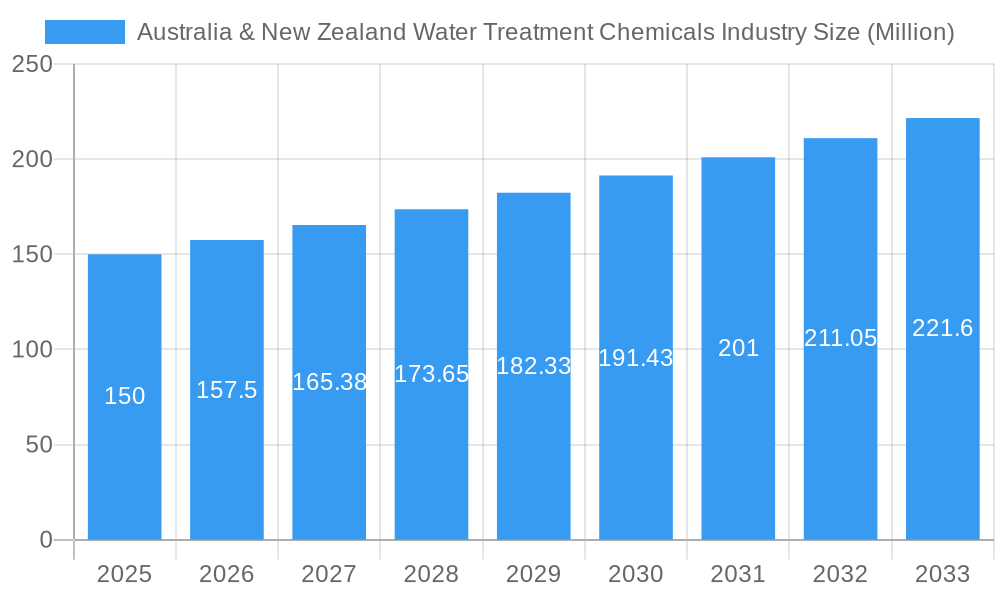
The Australia & New Zealand water treatment chemicals market is poised for significant expansion, propelled by industrial advancement, stringent environmental mandates, and an escalating emphasis on water conservation and quality. The market, valued at $1.1 billion in the base year 2024, is projected to grow at a compound annual growth rate (CAGR) of 5.6% through 2033. Key growth catalysts include the burgeoning power generation and mining sectors, particularly in Australia, which require efficient water treatment for environmental compliance and operational optimization. Furthermore, the increasing adoption of advanced technologies like membrane filtration and reverse osmosis is driving demand for specialized chemicals. Major market segments comprise biocides and disinfectants, crucial for hygiene and regulatory adherence, and coagulants and flocculants, essential for municipal and industrial water purification. Despite potential headwinds such as raw material price volatility and economic slowdowns, the long-term outlook remains positive, underpinned by government initiatives supporting sustainable water management and the adoption of cutting-edge treatment solutions.
Australia & New Zealand Water Treatment Chemicals Industry Market Size (In Billion)
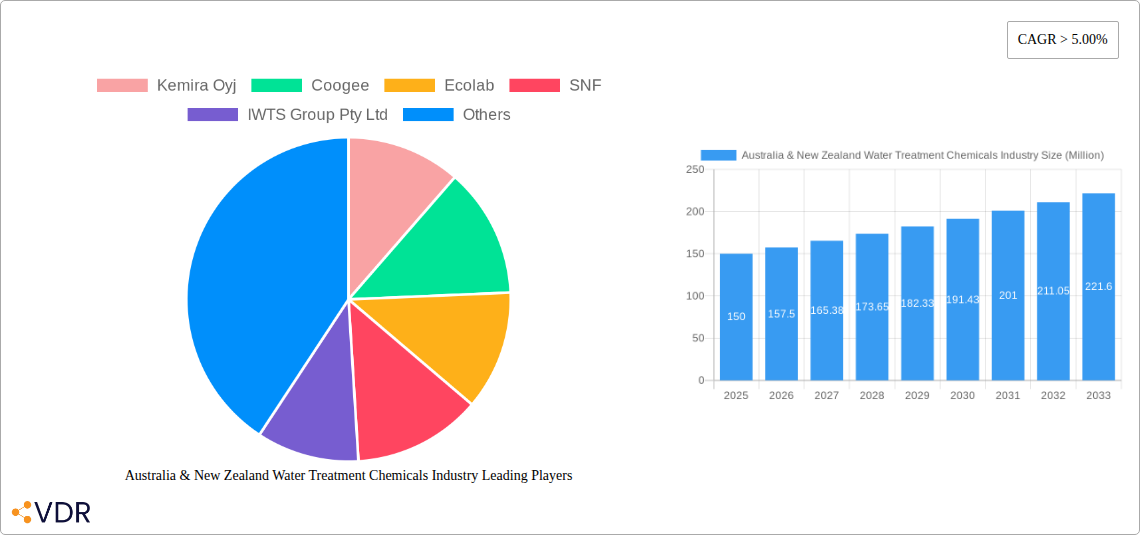
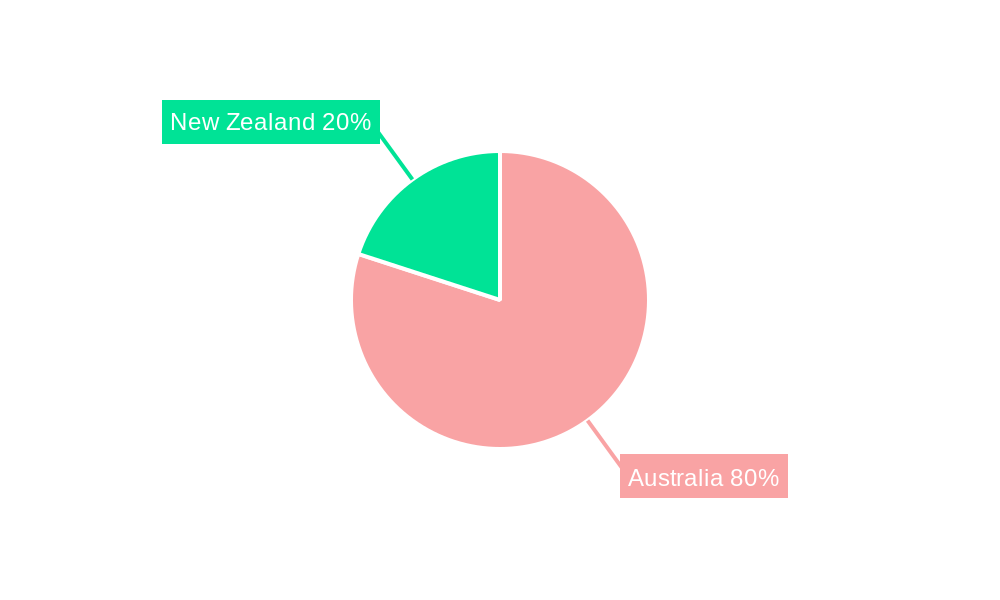
Leading market participants, including Kemira Oyj and Ecolab, are actively investing in R&D to enhance product efficacy and expand their market footprint. Intense competition focuses on delivering tailored solutions for specific industrial needs and superior customer support. The demand for eco-friendly water treatment chemicals is also rising, fostering innovation in sustainable alternatives. Australia currently leads market growth over New Zealand due to its more extensive and diversified industrial landscape. Future growth trajectories will be influenced by sustained economic activity, infrastructure investments, and ongoing technological advancements in water treatment across various industries. The implementation of stricter environmental regulations and growing awareness of water scarcity are expected to further accelerate market expansion.
Australia & New Zealand Water Treatment Chemicals Industry Company Market Share
This comprehensive analysis delves into the Australia & New Zealand water treatment chemicals industry, examining market size, growth trajectories, competitive dynamics, and future projections. The report covers the period 2019-2033, with a detailed forecast for 2024-2033. Key segments analyzed include biocides, coagulants, and corrosion inhibitors, serving diverse end-user industries such as power generation, mining, and municipal water treatment. This report is an indispensable resource for industry stakeholders, investors, and strategic decision-makers seeking a granular understanding of this evolving market.
Australia & New Zealand Water Treatment Chemicals Industry Market Dynamics & Structure
The Australian and New Zealand water treatment chemicals market is characterized by a moderately concentrated landscape with several multinational players and regional specialists competing for market share. The market size in 2025 is estimated at $xx million. Technological innovation, particularly in sustainable and environmentally friendly solutions, is a key driver. Stringent environmental regulations and water quality standards influence product development and adoption. Competitive pressures are intense, with companies vying through product differentiation, pricing strategies, and mergers & acquisitions (M&A). The historical period (2019-2024) witnessed several M&A deals, totaling approximately xx deals, contributing to market consolidation.
- Market Concentration: Moderately concentrated, with top 5 players holding approximately xx% market share in 2025.
- Technological Innovation: Focus on sustainable solutions, automation, and improved efficacy drives innovation.
- Regulatory Framework: Stringent environmental regulations shape product development and market access.
- Competitive Substitutes: Limited substitutes exist, but pricing and performance remain key differentiators.
- End-User Demographics: Growth is driven by expanding industrial and municipal water treatment needs.
- M&A Trends: Consolidation continues, with larger players acquiring smaller firms to expand market reach.
Australia & New Zealand Water Treatment Chemicals Industry Growth Trends & Insights
The Australia & New Zealand water treatment chemicals market exhibited a CAGR of xx% during the historical period (2019-2024), reaching an estimated $xx million in 2025. This growth is fueled by increasing industrialization, urbanization, and stricter environmental regulations. The forecast period (2025-2033) anticipates continued expansion, driven by factors such as rising investment in water infrastructure projects and the growing adoption of advanced water treatment technologies. Market penetration of advanced technologies like membrane filtration and electrochemical treatment is expected to increase significantly, impacting the demand for specific chemicals. Consumer behavior shifts towards sustainable and environmentally responsible solutions further shape market trends. The projected CAGR for 2025-2033 is xx%.
Dominant Regions, Countries, or Segments in Australia & New Zealand Water Treatment Chemicals Industry
The Australian market dominates the overall Australia & New Zealand water treatment chemicals market, accounting for approximately xx% of the total market value in 2025. Within the product type segment, Coagulants and Flocculants hold the largest market share, driven by the high demand from municipal water treatment plants. The Mining and Mineral Processing end-user industry is a significant driver of growth, particularly in Australia, owing to extensive mining activities.
- Key Drivers in Australia: Extensive mining operations, robust infrastructure development, and stringent water quality standards.
- Key Drivers in New Zealand: Increasing focus on sustainable water management practices and tourism sector growth.
- Dominant Product Type: Coagulants and Flocculants, exhibiting xx% market share in 2025.
- Dominant End-user Industry: Mining and Mineral Processing, accounting for xx% of the market in 2025.
Australia & New Zealand Water Treatment Chemicals Industry Product Landscape
The product landscape is diverse, encompassing biocides, coagulants, corrosion inhibitors, and other specialized chemicals. Recent innovations focus on enhanced efficacy, reduced environmental impact, and ease of use. Products are tailored to specific applications, reflecting varying water quality and treatment requirements. Key selling propositions include improved performance, cost-effectiveness, and compliance with environmental regulations. Technological advancements include the development of bio-based and biodegradable alternatives to traditional chemicals.
Key Drivers, Barriers & Challenges in Australia & New Zealand Water Treatment Chemicals Industry
Key Drivers:
- Growing industrialization and urbanization
- Stringent environmental regulations
- Increased investment in water infrastructure
- Adoption of advanced water treatment technologies
Challenges:
- Fluctuations in raw material prices (impact: xx% increase in cost of production in 2024)
- Supply chain disruptions (impact: xx% decrease in production capacity during Q2 2024)
- Intense competition from established and emerging players.
Emerging Opportunities in Australia & New Zealand Water Treatment Chemicals Industry
- Expanding use of water treatment chemicals in desalination plants.
- Growing demand for sustainable and eco-friendly solutions.
- Increasing adoption of advanced oxidation processes.
- Focus on improving water reuse and recycling.
Growth Accelerators in the Australia & New Zealand Water Treatment Chemicals Industry
Technological advancements in water treatment, strategic partnerships between chemical manufacturers and water treatment operators, and expanding into new and untapped markets (e.g., agricultural water treatment) are key growth catalysts. Government initiatives promoting water conservation and efficient water management will further accelerate market growth.
Key Players Shaping the Australia & New Zealand Water Treatment Chemicals Market
- Kemira Oyj
- Coogee
- Ecolab
- SNF
- IWTS Group Pty Ltd
- Solvay
- Buckman
- Aquasol
- Dow
- Solenis
- Ixom
- Albemarle Corporation
- Veolia (Veolia Water Technologies)
Notable Milestones in Australia & New Zealand Water Treatment Chemicals Industry Sector
- 2022: Introduction of a new generation of biocides with enhanced efficacy and lower environmental impact by Kemira Oyj.
- 2023: Acquisition of a regional water treatment chemicals company by Ecolab, expanding its market reach.
- 2024: Launch of a sustainable coagulant by Solvay, gaining market traction due to environmental concerns.
In-Depth Australia & New Zealand Water Treatment Chemicals Industry Market Outlook
The Australia & New Zealand water treatment chemicals market is poised for continued growth, driven by robust investment in water infrastructure, increasing industrial activity, and a growing focus on sustainability. Strategic partnerships, technological innovation, and expansion into new applications present significant opportunities for market players. The market is expected to reach $xx million by 2033, presenting considerable potential for investors and industry participants.
Australia & New Zealand Water Treatment Chemicals Industry Segmentation
-
1. Product Type
- 1.1. Biocides and Disinfectants
- 1.2. Coagulants and Flocculants
- 1.3. Corrosion and Scale Inhibitors
- 1.4. Defoamers and Defoaming Agents
- 1.5. pH Conditioners/Adjusters
- 1.6. Other Product Types
-
2. End-user Industry
- 2.1. Power Generation
- 2.2. Oil and Gas
- 2.3. Chemical Manufacturing
- 2.4. Mining and Mineral Processing
- 2.5. Municipal
- 2.6. Food and Beverage
- 2.7. Pulp and Paper
- 2.8. Other End-user Industries
Australia & New Zealand Water Treatment Chemicals Industry Segmentation By Geography
- 1. Australia
Australia & New Zealand Water Treatment Chemicals Industry Regional Market Share
Geographic Coverage of Australia & New Zealand Water Treatment Chemicals Industry
Australia & New Zealand Water Treatment Chemicals Industry REPORT HIGHLIGHTS
| Aspects | Details |
|---|---|
| Study Period | 2020-2034 |
| Base Year | 2025 |
| Estimated Year | 2026 |
| Forecast Period | 2026-2034 |
| Historical Period | 2020-2025 |
| Growth Rate | CAGR of 5.6% from 2020-2034 |
| Segmentation |
|
Table of Contents
- 1. Introduction
- 1.1. Research Scope
- 1.2. Market Segmentation
- 1.3. Research Objective
- 1.4. Definitions and Assumptions
- 2. Executive Summary
- 2.1. Market Snapshot
- 3. Market Dynamics
- 3.1. Market Drivers
- 3.2. Market Restrains
- 3.3. Market Trends
- 3.4. Market Opportunities
- 4. Market Factor Analysis
- 4.1. Porters Five Forces
- 4.1.1. Bargaining Power of Suppliers
- 4.1.2. Bargaining Power of Buyers
- 4.1.3. Threat of New Entrants
- 4.1.4. Threat of Substitutes
- 4.1.5. Competitive Rivalry
- 4.2. PESTEL analysis
- 4.3. BCG Analysis
- 4.3.1. Stars (High Growth, High Market Share)
- 4.3.2. Cash Cows (Low Growth, High Market Share)
- 4.3.3. Question Mark (High Growth, Low Market Share)
- 4.3.4. Dogs (Low Growth, Low Market Share)
- 4.4. Ansoff Matrix Analysis
- 4.5. Supply Chain Analysis
- 4.6. Regulatory Landscape
- 4.7. Current Market Potential and Opportunity Assessment (TAM–SAM–SOM Framework)
- 4.8. VDR Analyst Note
- 4.1. Porters Five Forces
- 5. Market Analysis, Insights and Forecast 2021-2033
- 5.1. Market Analysis, Insights and Forecast - by Product Type
- 5.1.1. Biocides and Disinfectants
- 5.1.2. Coagulants and Flocculants
- 5.1.3. Corrosion and Scale Inhibitors
- 5.1.4. Defoamers and Defoaming Agents
- 5.1.5. pH Conditioners/Adjusters
- 5.1.6. Other Product Types
- 5.2. Market Analysis, Insights and Forecast - by End-user Industry
- 5.2.1. Power Generation
- 5.2.2. Oil and Gas
- 5.2.3. Chemical Manufacturing
- 5.2.4. Mining and Mineral Processing
- 5.2.5. Municipal
- 5.2.6. Food and Beverage
- 5.2.7. Pulp and Paper
- 5.2.8. Other End-user Industries
- 5.3. Market Analysis, Insights and Forecast - by Region
- 5.3.1. Australia
- 5.1. Market Analysis, Insights and Forecast - by Product Type
- 6. Australia & New Zealand Water Treatment Chemicals Industry Analysis, Insights and Forecast, 2021-2033
- 6.1. Market Analysis, Insights and Forecast - by Product Type
- 6.1.1. Biocides and Disinfectants
- 6.1.2. Coagulants and Flocculants
- 6.1.3. Corrosion and Scale Inhibitors
- 6.1.4. Defoamers and Defoaming Agents
- 6.1.5. pH Conditioners/Adjusters
- 6.1.6. Other Product Types
- 6.2. Market Analysis, Insights and Forecast - by End-user Industry
- 6.2.1. Power Generation
- 6.2.2. Oil and Gas
- 6.2.3. Chemical Manufacturing
- 6.2.4. Mining and Mineral Processing
- 6.2.5. Municipal
- 6.2.6. Food and Beverage
- 6.2.7. Pulp and Paper
- 6.2.8. Other End-user Industries
- 6.1. Market Analysis, Insights and Forecast - by Product Type
- 7. Competitive Analysis
- 7.1. Company Profiles
- 7.1.1 Kemira Oyj
- 7.1.1.1. Company Overview
- 7.1.1.2. Products
- 7.1.1.3. Company Financials
- 7.1.1.4. SWOT Analysis
- 7.1.2 Coogee
- 7.1.2.1. Company Overview
- 7.1.2.2. Products
- 7.1.2.3. Company Financials
- 7.1.2.4. SWOT Analysis
- 7.1.3 Ecolab
- 7.1.3.1. Company Overview
- 7.1.3.2. Products
- 7.1.3.3. Company Financials
- 7.1.3.4. SWOT Analysis
- 7.1.4 SNF
- 7.1.4.1. Company Overview
- 7.1.4.2. Products
- 7.1.4.3. Company Financials
- 7.1.4.4. SWOT Analysis
- 7.1.5 IWTS Group Pty Ltd
- 7.1.5.1. Company Overview
- 7.1.5.2. Products
- 7.1.5.3. Company Financials
- 7.1.5.4. SWOT Analysis
- 7.1.6 Solvay
- 7.1.6.1. Company Overview
- 7.1.6.2. Products
- 7.1.6.3. Company Financials
- 7.1.6.4. SWOT Analysis
- 7.1.7 Buckman
- 7.1.7.1. Company Overview
- 7.1.7.2. Products
- 7.1.7.3. Company Financials
- 7.1.7.4. SWOT Analysis
- 7.1.8 Aquasol
- 7.1.8.1. Company Overview
- 7.1.8.2. Products
- 7.1.8.3. Company Financials
- 7.1.8.4. SWOT Analysis
- 7.1.9 Dow
- 7.1.9.1. Company Overview
- 7.1.9.2. Products
- 7.1.9.3. Company Financials
- 7.1.9.4. SWOT Analysis
- 7.1.10 Solenis
- 7.1.10.1. Company Overview
- 7.1.10.2. Products
- 7.1.10.3. Company Financials
- 7.1.10.4. SWOT Analysis
- 7.1.11 Ixom
- 7.1.11.1. Company Overview
- 7.1.11.2. Products
- 7.1.11.3. Company Financials
- 7.1.11.4. SWOT Analysis
- 7.1.12 Albemarle Corporation
- 7.1.12.1. Company Overview
- 7.1.12.2. Products
- 7.1.12.3. Company Financials
- 7.1.12.4. SWOT Analysis
- 7.1.13 Veolia (Veolia Water Technologies)
- 7.1.13.1. Company Overview
- 7.1.13.2. Products
- 7.1.13.3. Company Financials
- 7.1.13.4. SWOT Analysis
- 7.1.1 Kemira Oyj
- 7.2. Market Entropy
- 7.2.1 Company's Key Areas Served
- 7.2.2 Recent Developments
- 7.3. Company Market Share Analysis 2025
- 7.3.1 Top 5 Companies Market Share Analysis
- 7.3.2 Top 3 Companies Market Share Analysis
- 7.4. List of Potential Customers
- 8. Research Methodology
List of Figures
- Figure 1: Australia & New Zealand Water Treatment Chemicals Industry Revenue Breakdown (billion, %) by Product 2025 & 2033
- Figure 2: Australia & New Zealand Water Treatment Chemicals Industry Share (%) by Company 2025
List of Tables
- Table 1: Australia & New Zealand Water Treatment Chemicals Industry Revenue billion Forecast, by Product Type 2020 & 2033
- Table 2: Australia & New Zealand Water Treatment Chemicals Industry Volume K Tons Forecast, by Product Type 2020 & 2033
- Table 3: Australia & New Zealand Water Treatment Chemicals Industry Revenue billion Forecast, by End-user Industry 2020 & 2033
- Table 4: Australia & New Zealand Water Treatment Chemicals Industry Volume K Tons Forecast, by End-user Industry 2020 & 2033
- Table 5: Australia & New Zealand Water Treatment Chemicals Industry Revenue billion Forecast, by Region 2020 & 2033
- Table 6: Australia & New Zealand Water Treatment Chemicals Industry Volume K Tons Forecast, by Region 2020 & 2033
- Table 7: Australia & New Zealand Water Treatment Chemicals Industry Revenue billion Forecast, by Product Type 2020 & 2033
- Table 8: Australia & New Zealand Water Treatment Chemicals Industry Volume K Tons Forecast, by Product Type 2020 & 2033
- Table 9: Australia & New Zealand Water Treatment Chemicals Industry Revenue billion Forecast, by End-user Industry 2020 & 2033
- Table 10: Australia & New Zealand Water Treatment Chemicals Industry Volume K Tons Forecast, by End-user Industry 2020 & 2033
- Table 11: Australia & New Zealand Water Treatment Chemicals Industry Revenue billion Forecast, by Country 2020 & 2033
- Table 12: Australia & New Zealand Water Treatment Chemicals Industry Volume K Tons Forecast, by Country 2020 & 2033
Frequently Asked Questions
1. What is the projected Compound Annual Growth Rate (CAGR) of the Australia & New Zealand Water Treatment Chemicals Industry?
The projected CAGR is approximately 5.6%.
2. Which companies are prominent players in the Australia & New Zealand Water Treatment Chemicals Industry?
Key companies in the market include Kemira Oyj, Coogee, Ecolab, SNF, IWTS Group Pty Ltd, Solvay, Buckman, Aquasol, Dow, Solenis, Ixom, Albemarle Corporation, Veolia (Veolia Water Technologies).
3. What are the main segments of the Australia & New Zealand Water Treatment Chemicals Industry?
The market segments include Product Type, End-user Industry.
4. Can you provide details about the market size?
The market size is estimated to be USD 1.1 billion as of 2022.
5. What are some drivers contributing to market growth?
Rising Groundwater and Surface Water Pollution; Growing Demand From Power and Industrial Applications; Increasing Government Intervention in Reliable Wastewater Management; Substitution of Other Polyethylene Products.
6. What are the notable trends driving market growth?
Municipal End-user Industry to Dominate the Market.
7. Are there any restraints impacting market growth?
Hazardous Nature of Hydrazine; Emerging Alternatives to Water Treatment Chemicals.
8. Can you provide examples of recent developments in the market?
N/A
9. What pricing options are available for accessing the report?
Pricing options include single-user, multi-user, and enterprise licenses priced at USD 3,950, USD 4,950, and USD 6,950 respectively.
10. Is the market size provided in terms of value or volume?
The market size is provided in terms of value, measured in billion and volume, measured in K Tons.
11. Are there any specific market keywords associated with the report?
Yes, the market keyword associated with the report is "Australia & New Zealand Water Treatment Chemicals Industry," which aids in identifying and referencing the specific market segment covered.
12. How do I determine which pricing option suits my needs best?
The pricing options vary based on user requirements and access needs. Individual users may opt for single-user licenses, while businesses requiring broader access may choose multi-user or enterprise licenses for cost-effective access to the report.
13. Are there any additional resources or data provided in the Australia & New Zealand Water Treatment Chemicals Industry report?
While the report offers comprehensive insights, it's advisable to review the specific contents or supplementary materials provided to ascertain if additional resources or data are available.
14. How can I stay updated on further developments or reports in the Australia & New Zealand Water Treatment Chemicals Industry?
To stay informed about further developments, trends, and reports in the Australia & New Zealand Water Treatment Chemicals Industry, consider subscribing to industry newsletters, following relevant companies and organizations, or regularly checking reputable industry news sources and publications.
Methodology
Step 1 - Identification of Relevant Samples Size from Population Database


Step 2 - Approaches for Defining Global Market Size (Value, Volume* & Price*)

Note*: In applicable scenarios
Step 3 - Data Sources
Primary Research
- Web Analytics
- Survey Reports
- Research Institute
- Latest Research Reports
- Opinion Leaders
Secondary Research
- Annual Reports
- White Paper
- Latest Press Release
- Industry Association
- Paid Database
- Investor Presentations

Step 4 - Data Triangulation
Involves using different sources of information in order to increase the validity of a study
These sources are likely to be stakeholders in a program - participants, other researchers, program staff, other community members, and so on.
Then we put all data in single framework & apply various statistical tools to find out the dynamic on the market.
During the analysis stage, feedback from the stakeholder groups would be compared to determine areas of agreement as well as areas of divergence