
Key Insights
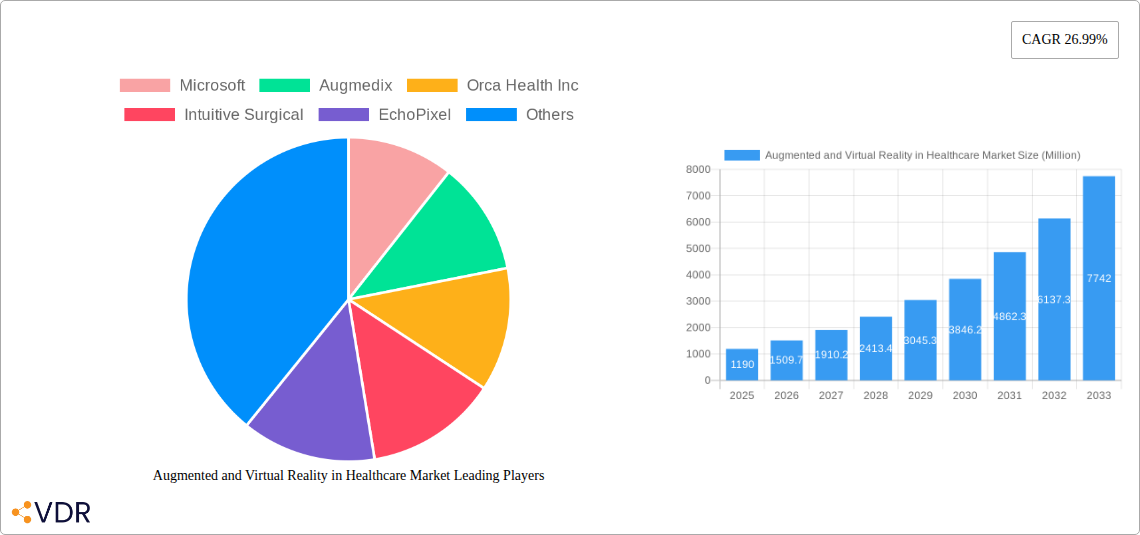
The Augmented and Virtual Reality (AR/VR) in Healthcare market is experiencing robust growth, projected to reach $1.19 billion in 2025 and exhibiting a Compound Annual Growth Rate (CAGR) of 26.99% from 2025 to 2033. This expansion is fueled by several key drivers. The increasing adoption of minimally invasive surgical procedures necessitates advanced visualization tools, where AR/VR technologies provide superior accuracy and real-time data overlays, improving surgical outcomes and reducing complications. Furthermore, the rising demand for effective medical training and education is boosting the market. AR/VR simulations offer immersive and risk-free environments for medical professionals to hone their skills, improving competency and patient safety. The growing prevalence of chronic diseases and the need for remote patient monitoring further propel market growth, as AR/VR enables telehealth consultations and personalized treatment plans, improving patient engagement and access to care, particularly in remote areas. Market segmentation reveals strong growth across all end-users (hospitals, clinics, research labs), with head-mounted devices currently dominating the technology segment due to their immersive capabilities. However, handheld devices are expected to gain significant traction due to their ease of use and portability. While the high initial investment costs for implementing AR/VR systems present a restraint, the long-term cost savings and improved efficiency associated with these technologies are driving widespread adoption.
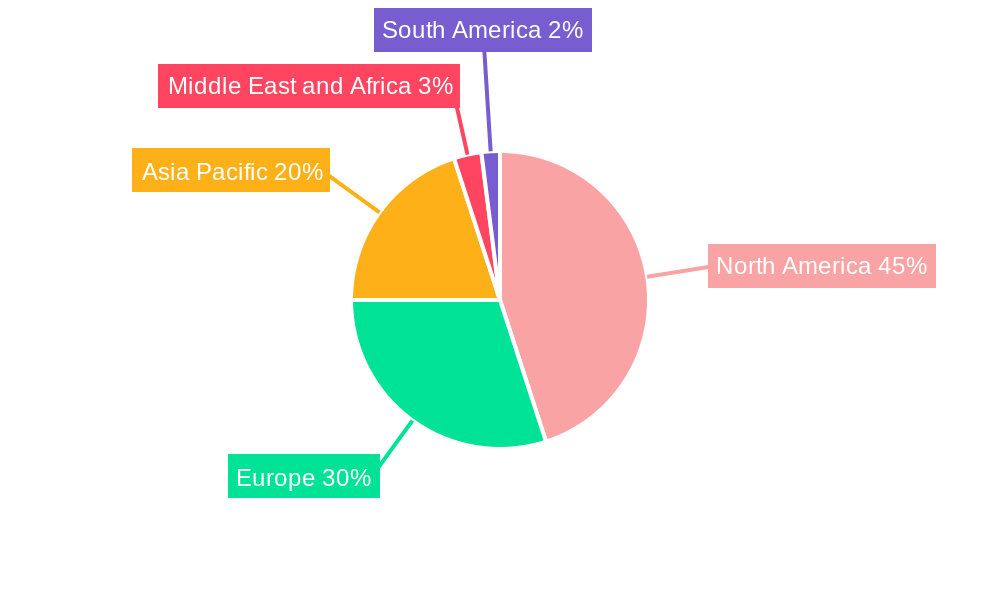
The geographical distribution reveals a significant market share for North America, driven by high technological advancements and increased healthcare spending. Europe is also a key market, followed by the Asia-Pacific region, which is experiencing rapid growth due to rising healthcare expenditure and technological advancements. Key players such as Microsoft, Intuitive Surgical, and Siemens Healthineers are driving innovation and market penetration through strategic partnerships, technological advancements, and product diversification. Competition is expected to intensify as smaller companies bring innovative products and services to the market. The market's future trajectory is promising, with further growth anticipated due to technological advancements in areas such as haptic feedback, improved user interfaces, and greater integration with existing healthcare systems, promising a transformative impact on healthcare delivery and patient outcomes.
This comprehensive report provides a detailed analysis of the Augmented and Virtual Reality (AR/VR) in Healthcare market, encompassing market dynamics, growth trends, regional dominance, product landscape, challenges, opportunities, key players, and future outlook. The study period covers 2019-2033, with 2025 as the base year and a forecast period of 2025-2033. The report segments the market by end-user (Hospitals and Clinics, Research Laboratories, Others), technology (Head Mounted Devices, Handheld Devices), and product (AR Displays, AR Sensors, AR Input Devices, AR Semiconductor Components, Others). The global market size is projected to reach xx Million by 2033.
Augmented and Virtual Reality in Healthcare Market Market Dynamics & Structure
The AR/VR in Healthcare market is characterized by a moderately concentrated structure with a few dominant players and numerous smaller niche players. Technological innovation, particularly in areas like haptic feedback, higher resolution displays, and AI integration, is a major driver. Regulatory frameworks, including data privacy and device safety regulations, significantly impact market growth. Competition from traditional healthcare solutions and the emergence of alternative technologies pose challenges. End-user demographics are shifting towards increased adoption in hospitals and research facilities, driven by the demonstrated benefits in training, surgery, and diagnostics. The market has witnessed a moderate level of M&A activity, with larger companies strategically acquiring smaller firms with specialized technologies.
- Market Concentration: Moderately concentrated, with a Herfindahl-Hirschman Index (HHI) of xx.
- Technological Innovation Drivers: Improved display resolution, haptic feedback advancements, AI integration for diagnostic support.
- Regulatory Frameworks: Stringent regulations on data privacy (HIPAA), device safety, and clinical trial approvals influence market entry and growth.
- Competitive Product Substitutes: Traditional training methods, physical models, and conventional diagnostic tools.
- End-User Demographics: Hospitals and Clinics segment experiencing the highest growth due to increased adoption for surgical guidance and training.
- M&A Trends: Moderate M&A activity (xx deals in the last 5 years), with strategic acquisitions focusing on technology integration and market expansion.
Augmented and Virtual Reality in Healthcare Market Growth Trends & Insights
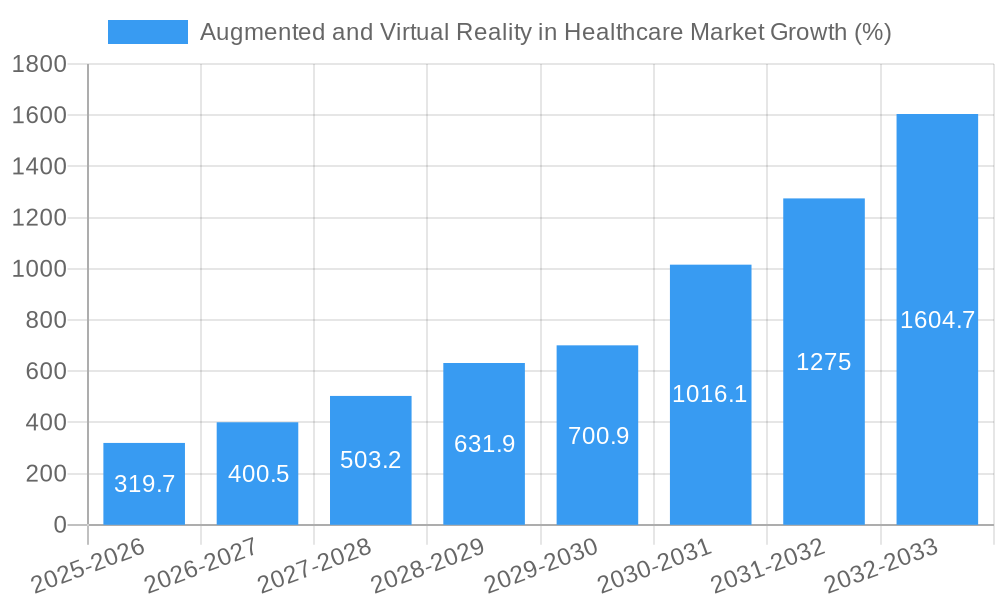
The AR/VR in Healthcare market exhibits robust growth, driven by increasing demand for improved surgical precision, enhanced medical training, and more effective patient care. The market size experienced a CAGR of xx% during the historical period (2019-2024) and is projected to maintain a CAGR of xx% during the forecast period (2025-2033). Adoption rates are increasing across various healthcare settings, with hospitals and clinics leading the charge. Technological disruptions, such as the development of 5G networks and improved AR/VR hardware, are fueling faster adoption. Consumer behavior is shifting towards a preference for technologically advanced healthcare solutions that offer enhanced accuracy, efficiency, and personalization. Market penetration is expected to reach xx% by 2033. Further growth is predicted due to the growing adoption of telehealth and remote patient monitoring solutions incorporating AR/VR technologies.
Dominant Regions, Countries, or Segments in Augmented and Virtual Reality in Healthcare Market
North America currently dominates the AR/VR in Healthcare market, driven by robust technological advancements, substantial investments in healthcare infrastructure, and favorable regulatory environments. Within North America, the United States holds the largest market share due to the high adoption of AR/VR technologies in hospitals and research facilities and the presence of key industry players. Europe is another significant market, fueled by increasing healthcare spending and government initiatives promoting technological advancements. The Asia-Pacific region is experiencing rapid growth, propelled by rising healthcare expenditure and a growing demand for sophisticated medical training programs.
Leading Region: North America (Market share: xx%)
Key Drivers in North America: High adoption rates in hospitals and research labs, presence of major industry players, robust R&D investment, favorable regulatory environment.
High-Growth Segment: Hospitals and Clinics (Market share: xx%), driven by the increasing need for enhanced surgical precision and improved training solutions.
Technology Segment with High Growth Potential: Head Mounted Devices (Market share: xx%), due to their immersive capabilities and suitability for complex surgical procedures and training.
Key Drivers in Europe: Increasing healthcare spending, government support for technological advancements, rising demand for advanced medical training.
Key Drivers in Asia-Pacific: Rising healthcare expenditure, growing demand for advanced medical training, increasing adoption of telehealth solutions.
Augmented and Virtual Reality in Healthcare Market Product Landscape
The AR/VR product landscape is dynamic, with continuous innovation across various segments. AR displays are evolving to provide higher resolution and wider fields of view. AR sensors are becoming more precise and integrated with AI algorithms for enhanced data analysis. AR input devices are being developed with intuitive interfaces for easier use in healthcare settings. Technological advancements include miniaturization of components, improved haptic feedback, and the integration of AI-powered diagnostic tools. The key focus is on user-friendliness, precise data visualization, and seamless integration with existing healthcare workflows.
Key Drivers, Barriers & Challenges in Augmented and Virtual Reality in Healthcare Market
Key Drivers:
- Technological advancements: Improved display resolution, haptic feedback, AI-driven analytics.
- Rising healthcare expenditure: Increased funding for innovative technologies and improved patient care.
- Government initiatives: Funding programs and regulatory frameworks supporting AR/VR adoption.
Key Barriers and Challenges:
- High initial investment costs: AR/VR systems can be expensive to acquire and implement.
- Data privacy and security concerns: Protecting sensitive patient data is crucial.
- Regulatory hurdles: Strict regulations and approval processes can slow down market penetration. (e.g., FDA approval for medical devices).
- Lack of skilled professionals: Training healthcare professionals to effectively use AR/VR technologies is essential. A shortage of trained personnel is a significant restraint on growth. The predicted impact is a delay in market penetration by approximately xx%.
Emerging Opportunities in Augmented and Virtual Reality in Healthcare Market
- Telemedicine and remote patient monitoring: AR/VR enables remote consultations and monitoring of patients' vital signs.
- Personalized medicine: AR/VR can personalize treatment plans by creating customized simulations and visualizations.
- Medical training and education: AR/VR provides immersive and interactive training experiences for medical students and professionals.
- Rehabilitation and therapy: AR/VR facilitates engaging and effective rehabilitation programs for patients with disabilities.
Growth Accelerators in the Augmented and Virtual Reality in Healthcare Market Industry
Strategic partnerships between technology companies and healthcare providers are accelerating market growth. Technological breakthroughs, such as the development of more affordable and user-friendly devices, are also contributing to wider adoption. Market expansion into developing countries with a growing demand for better healthcare services is expected to drive long-term growth.
Key Players Shaping the Augmented and Virtual Reality in Healthcare Market Market
- Microsoft
- Augmedix
- Orca Health Inc
- Intuitive Surgical
- EchoPixel
- Augmented Pixels Inc
- Siemens Healthineers
- Surgical Theater
- Koninklijke Philips N V
- Vuzix Corporation
- AccuVein Inc
- CAE Healthcare
Notable Milestones in Augmented and Virtual Reality in Healthcare Market Sector
- 2020: FDA approves first AR-guided surgical system.
- 2021: Microsoft launches a new cloud-based platform for AR/VR in healthcare.
- 2022: Several key partnerships formed between tech companies and healthcare providers to develop new AR/VR applications.
- 2023: Significant increase in investments in AR/VR healthcare startups.
In-Depth Augmented and Virtual Reality in Healthcare Market Market Outlook
The AR/VR in Healthcare market is poised for significant growth in the coming years, driven by continuous technological innovation, increasing demand for efficient healthcare solutions, and rising investments in the sector. Strategic partnerships and market expansion into new regions will further fuel growth. The market's long-term outlook is positive, with substantial opportunities for key players to capitalize on emerging trends and unmet needs within the healthcare industry.
Augmented and Virtual Reality in Healthcare Market Segmentation
-
1. Technology
- 1.1. Head Mounted Devices
- 1.2. Handheld Devices
-
2. Product
- 2.1. AR Displays
- 2.2. AR Sensors
- 2.3. AR Input Devices
- 2.4. AR Semiconductor Components
- 2.5. Others
-
3. End User
- 3.1. Hospitals and Clinics
- 3.2. Research Laboratories
- 3.3. Others
Augmented and Virtual Reality in Healthcare Market Segmentation By Geography
-
1. North America
- 1.1. United States
- 1.2. Canada
- 1.3. Mexico
-
2. Europe
- 2.1. Germany
- 2.2. United Kingdom
- 2.3. France
- 2.4. Italy
- 2.5. Spain
- 2.6. Rest of Europe
-
3. Asia Pacific
- 3.1. China
- 3.2. Japan
- 3.3. India
- 3.4. Australia
- 3.5. South Korea
- 3.6. Rest of Asia Pacific
-
4. Middle East and Africa
- 4.1. GCC
- 4.2. South Africa
- 4.3. Rest of Middle East and Africa
-
5. South America
- 5.1. Brazil
- 5.2. Argentina
- 5.3. Rest of South America
Augmented and Virtual Reality in Healthcare Market REPORT HIGHLIGHTS
| Aspects | Details |
|---|---|
| Study Period | 2019-2033 |
| Base Year | 2024 |
| Estimated Year | 2025 |
| Forecast Period | 2025-2033 |
| Historical Period | 2019-2024 |
| Growth Rate | CAGR of 26.99% from 2019-2033 |
| Segmentation |
|
Table of Contents
- 1. Introduction
- 1.1. Research Scope
- 1.2. Market Segmentation
- 1.3. Research Methodology
- 1.4. Definitions and Assumptions
- 2. Executive Summary
- 2.1. Introduction
- 3. Market Dynamics
- 3.1. Introduction
- 3.2. Market Drivers
- 3.2.1. Rise in Adoption of Augmented Reality in Healthcare; Increase in Investments in Augmented Reality; Rise in Number of Start Up Companies in the Market
- 3.3. Market Restrains
- 3.3.1. High Cost of Augmented Reality Products; Data Security Concers
- 3.4. Market Trends
- 3.4.1. Head-Mounted Devices Segment is Expected to Hold a Significant Share in the Market Over the Forecast Period
- 4. Market Factor Analysis
- 4.1. Porters Five Forces
- 4.2. Supply/Value Chain
- 4.3. PESTEL analysis
- 4.4. Market Entropy
- 4.5. Patent/Trademark Analysis
- 5. Global Augmented and Virtual Reality in Healthcare Market Analysis, Insights and Forecast, 2019-2031
- 5.1. Market Analysis, Insights and Forecast - by Technology
- 5.1.1. Head Mounted Devices
- 5.1.2. Handheld Devices
- 5.2. Market Analysis, Insights and Forecast - by Product
- 5.2.1. AR Displays
- 5.2.2. AR Sensors
- 5.2.3. AR Input Devices
- 5.2.4. AR Semiconductor Components
- 5.2.5. Others
- 5.3. Market Analysis, Insights and Forecast - by End User
- 5.3.1. Hospitals and Clinics
- 5.3.2. Research Laboratories
- 5.3.3. Others
- 5.4. Market Analysis, Insights and Forecast - by Region
- 5.4.1. North America
- 5.4.2. Europe
- 5.4.3. Asia Pacific
- 5.4.4. Middle East and Africa
- 5.4.5. South America
- 5.1. Market Analysis, Insights and Forecast - by Technology
- 6. North America Augmented and Virtual Reality in Healthcare Market Analysis, Insights and Forecast, 2019-2031
- 6.1. Market Analysis, Insights and Forecast - by Technology
- 6.1.1. Head Mounted Devices
- 6.1.2. Handheld Devices
- 6.2. Market Analysis, Insights and Forecast - by Product
- 6.2.1. AR Displays
- 6.2.2. AR Sensors
- 6.2.3. AR Input Devices
- 6.2.4. AR Semiconductor Components
- 6.2.5. Others
- 6.3. Market Analysis, Insights and Forecast - by End User
- 6.3.1. Hospitals and Clinics
- 6.3.2. Research Laboratories
- 6.3.3. Others
- 6.1. Market Analysis, Insights and Forecast - by Technology
- 7. Europe Augmented and Virtual Reality in Healthcare Market Analysis, Insights and Forecast, 2019-2031
- 7.1. Market Analysis, Insights and Forecast - by Technology
- 7.1.1. Head Mounted Devices
- 7.1.2. Handheld Devices
- 7.2. Market Analysis, Insights and Forecast - by Product
- 7.2.1. AR Displays
- 7.2.2. AR Sensors
- 7.2.3. AR Input Devices
- 7.2.4. AR Semiconductor Components
- 7.2.5. Others
- 7.3. Market Analysis, Insights and Forecast - by End User
- 7.3.1. Hospitals and Clinics
- 7.3.2. Research Laboratories
- 7.3.3. Others
- 7.1. Market Analysis, Insights and Forecast - by Technology
- 8. Asia Pacific Augmented and Virtual Reality in Healthcare Market Analysis, Insights and Forecast, 2019-2031
- 8.1. Market Analysis, Insights and Forecast - by Technology
- 8.1.1. Head Mounted Devices
- 8.1.2. Handheld Devices
- 8.2. Market Analysis, Insights and Forecast - by Product
- 8.2.1. AR Displays
- 8.2.2. AR Sensors
- 8.2.3. AR Input Devices
- 8.2.4. AR Semiconductor Components
- 8.2.5. Others
- 8.3. Market Analysis, Insights and Forecast - by End User
- 8.3.1. Hospitals and Clinics
- 8.3.2. Research Laboratories
- 8.3.3. Others
- 8.1. Market Analysis, Insights and Forecast - by Technology
- 9. Middle East and Africa Augmented and Virtual Reality in Healthcare Market Analysis, Insights and Forecast, 2019-2031
- 9.1. Market Analysis, Insights and Forecast - by Technology
- 9.1.1. Head Mounted Devices
- 9.1.2. Handheld Devices
- 9.2. Market Analysis, Insights and Forecast - by Product
- 9.2.1. AR Displays
- 9.2.2. AR Sensors
- 9.2.3. AR Input Devices
- 9.2.4. AR Semiconductor Components
- 9.2.5. Others
- 9.3. Market Analysis, Insights and Forecast - by End User
- 9.3.1. Hospitals and Clinics
- 9.3.2. Research Laboratories
- 9.3.3. Others
- 9.1. Market Analysis, Insights and Forecast - by Technology
- 10. South America Augmented and Virtual Reality in Healthcare Market Analysis, Insights and Forecast, 2019-2031
- 10.1. Market Analysis, Insights and Forecast - by Technology
- 10.1.1. Head Mounted Devices
- 10.1.2. Handheld Devices
- 10.2. Market Analysis, Insights and Forecast - by Product
- 10.2.1. AR Displays
- 10.2.2. AR Sensors
- 10.2.3. AR Input Devices
- 10.2.4. AR Semiconductor Components
- 10.2.5. Others
- 10.3. Market Analysis, Insights and Forecast - by End User
- 10.3.1. Hospitals and Clinics
- 10.3.2. Research Laboratories
- 10.3.3. Others
- 10.1. Market Analysis, Insights and Forecast - by Technology
- 11. North America Augmented and Virtual Reality in Healthcare Market Analysis, Insights and Forecast, 2019-2031
- 11.1. Market Analysis, Insights and Forecast - By Country/Sub-region
- 11.1.1 United States
- 11.1.2 Canada
- 11.1.3 Mexico
- 12. Europe Augmented and Virtual Reality in Healthcare Market Analysis, Insights and Forecast, 2019-2031
- 12.1. Market Analysis, Insights and Forecast - By Country/Sub-region
- 12.1.1 Germany
- 12.1.2 United Kingdom
- 12.1.3 France
- 12.1.4 Italy
- 12.1.5 Spain
- 12.1.6 Rest of Europe
- 13. Asia Pacific Augmented and Virtual Reality in Healthcare Market Analysis, Insights and Forecast, 2019-2031
- 13.1. Market Analysis, Insights and Forecast - By Country/Sub-region
- 13.1.1 China
- 13.1.2 Japan
- 13.1.3 India
- 13.1.4 Australia
- 13.1.5 South Korea
- 13.1.6 Rest of Asia Pacific
- 14. Middle East and Africa Augmented and Virtual Reality in Healthcare Market Analysis, Insights and Forecast, 2019-2031
- 14.1. Market Analysis, Insights and Forecast - By Country/Sub-region
- 14.1.1 GCC
- 14.1.2 South Africa
- 14.1.3 Rest of Middle East and Africa
- 15. South America Augmented and Virtual Reality in Healthcare Market Analysis, Insights and Forecast, 2019-2031
- 15.1. Market Analysis, Insights and Forecast - By Country/Sub-region
- 15.1.1 Brazil
- 15.1.2 Argentina
- 15.1.3 Rest of South America
- 16. Competitive Analysis
- 16.1. Global Market Share Analysis 2024
- 16.2. Company Profiles
- 16.2.1 Microsoft
- 16.2.1.1. Overview
- 16.2.1.2. Products
- 16.2.1.3. SWOT Analysis
- 16.2.1.4. Recent Developments
- 16.2.1.5. Financials (Based on Availability)
- 16.2.2 Augmedix
- 16.2.2.1. Overview
- 16.2.2.2. Products
- 16.2.2.3. SWOT Analysis
- 16.2.2.4. Recent Developments
- 16.2.2.5. Financials (Based on Availability)
- 16.2.3 Orca Health Inc
- 16.2.3.1. Overview
- 16.2.3.2. Products
- 16.2.3.3. SWOT Analysis
- 16.2.3.4. Recent Developments
- 16.2.3.5. Financials (Based on Availability)
- 16.2.4 Intuitive Surgical
- 16.2.4.1. Overview
- 16.2.4.2. Products
- 16.2.4.3. SWOT Analysis
- 16.2.4.4. Recent Developments
- 16.2.4.5. Financials (Based on Availability)
- 16.2.5 EchoPixel
- 16.2.5.1. Overview
- 16.2.5.2. Products
- 16.2.5.3. SWOT Analysis
- 16.2.5.4. Recent Developments
- 16.2.5.5. Financials (Based on Availability)
- 16.2.6 Augmented Pixels Inc
- 16.2.6.1. Overview
- 16.2.6.2. Products
- 16.2.6.3. SWOT Analysis
- 16.2.6.4. Recent Developments
- 16.2.6.5. Financials (Based on Availability)
- 16.2.7 Siemens Healthineers
- 16.2.7.1. Overview
- 16.2.7.2. Products
- 16.2.7.3. SWOT Analysis
- 16.2.7.4. Recent Developments
- 16.2.7.5. Financials (Based on Availability)
- 16.2.8 Surgical Theater
- 16.2.8.1. Overview
- 16.2.8.2. Products
- 16.2.8.3. SWOT Analysis
- 16.2.8.4. Recent Developments
- 16.2.8.5. Financials (Based on Availability)
- 16.2.9 Koninklijke Philips N V
- 16.2.9.1. Overview
- 16.2.9.2. Products
- 16.2.9.3. SWOT Analysis
- 16.2.9.4. Recent Developments
- 16.2.9.5. Financials (Based on Availability)
- 16.2.10 Vuzix Corporation
- 16.2.10.1. Overview
- 16.2.10.2. Products
- 16.2.10.3. SWOT Analysis
- 16.2.10.4. Recent Developments
- 16.2.10.5. Financials (Based on Availability)
- 16.2.11 AccuVein Inc
- 16.2.11.1. Overview
- 16.2.11.2. Products
- 16.2.11.3. SWOT Analysis
- 16.2.11.4. Recent Developments
- 16.2.11.5. Financials (Based on Availability)
- 16.2.12 CAE Healthcare
- 16.2.12.1. Overview
- 16.2.12.2. Products
- 16.2.12.3. SWOT Analysis
- 16.2.12.4. Recent Developments
- 16.2.12.5. Financials (Based on Availability)
- 16.2.1 Microsoft
List of Figures
- Figure 1: Global Augmented and Virtual Reality in Healthcare Market Revenue Breakdown (Million, %) by Region 2024 & 2032
- Figure 2: Global Augmented and Virtual Reality in Healthcare Market Volume Breakdown (K Unit, %) by Region 2024 & 2032
- Figure 3: North America Augmented and Virtual Reality in Healthcare Market Revenue (Million), by Country 2024 & 2032
- Figure 4: North America Augmented and Virtual Reality in Healthcare Market Volume (K Unit), by Country 2024 & 2032
- Figure 5: North America Augmented and Virtual Reality in Healthcare Market Revenue Share (%), by Country 2024 & 2032
- Figure 6: North America Augmented and Virtual Reality in Healthcare Market Volume Share (%), by Country 2024 & 2032
- Figure 7: Europe Augmented and Virtual Reality in Healthcare Market Revenue (Million), by Country 2024 & 2032
- Figure 8: Europe Augmented and Virtual Reality in Healthcare Market Volume (K Unit), by Country 2024 & 2032
- Figure 9: Europe Augmented and Virtual Reality in Healthcare Market Revenue Share (%), by Country 2024 & 2032
- Figure 10: Europe Augmented and Virtual Reality in Healthcare Market Volume Share (%), by Country 2024 & 2032
- Figure 11: Asia Pacific Augmented and Virtual Reality in Healthcare Market Revenue (Million), by Country 2024 & 2032
- Figure 12: Asia Pacific Augmented and Virtual Reality in Healthcare Market Volume (K Unit), by Country 2024 & 2032
- Figure 13: Asia Pacific Augmented and Virtual Reality in Healthcare Market Revenue Share (%), by Country 2024 & 2032
- Figure 14: Asia Pacific Augmented and Virtual Reality in Healthcare Market Volume Share (%), by Country 2024 & 2032
- Figure 15: Middle East and Africa Augmented and Virtual Reality in Healthcare Market Revenue (Million), by Country 2024 & 2032
- Figure 16: Middle East and Africa Augmented and Virtual Reality in Healthcare Market Volume (K Unit), by Country 2024 & 2032
- Figure 17: Middle East and Africa Augmented and Virtual Reality in Healthcare Market Revenue Share (%), by Country 2024 & 2032
- Figure 18: Middle East and Africa Augmented and Virtual Reality in Healthcare Market Volume Share (%), by Country 2024 & 2032
- Figure 19: South America Augmented and Virtual Reality in Healthcare Market Revenue (Million), by Country 2024 & 2032
- Figure 20: South America Augmented and Virtual Reality in Healthcare Market Volume (K Unit), by Country 2024 & 2032
- Figure 21: South America Augmented and Virtual Reality in Healthcare Market Revenue Share (%), by Country 2024 & 2032
- Figure 22: South America Augmented and Virtual Reality in Healthcare Market Volume Share (%), by Country 2024 & 2032
- Figure 23: North America Augmented and Virtual Reality in Healthcare Market Revenue (Million), by Technology 2024 & 2032
- Figure 24: North America Augmented and Virtual Reality in Healthcare Market Volume (K Unit), by Technology 2024 & 2032
- Figure 25: North America Augmented and Virtual Reality in Healthcare Market Revenue Share (%), by Technology 2024 & 2032
- Figure 26: North America Augmented and Virtual Reality in Healthcare Market Volume Share (%), by Technology 2024 & 2032
- Figure 27: North America Augmented and Virtual Reality in Healthcare Market Revenue (Million), by Product 2024 & 2032
- Figure 28: North America Augmented and Virtual Reality in Healthcare Market Volume (K Unit), by Product 2024 & 2032
- Figure 29: North America Augmented and Virtual Reality in Healthcare Market Revenue Share (%), by Product 2024 & 2032
- Figure 30: North America Augmented and Virtual Reality in Healthcare Market Volume Share (%), by Product 2024 & 2032
- Figure 31: North America Augmented and Virtual Reality in Healthcare Market Revenue (Million), by End User 2024 & 2032
- Figure 32: North America Augmented and Virtual Reality in Healthcare Market Volume (K Unit), by End User 2024 & 2032
- Figure 33: North America Augmented and Virtual Reality in Healthcare Market Revenue Share (%), by End User 2024 & 2032
- Figure 34: North America Augmented and Virtual Reality in Healthcare Market Volume Share (%), by End User 2024 & 2032
- Figure 35: North America Augmented and Virtual Reality in Healthcare Market Revenue (Million), by Country 2024 & 2032
- Figure 36: North America Augmented and Virtual Reality in Healthcare Market Volume (K Unit), by Country 2024 & 2032
- Figure 37: North America Augmented and Virtual Reality in Healthcare Market Revenue Share (%), by Country 2024 & 2032
- Figure 38: North America Augmented and Virtual Reality in Healthcare Market Volume Share (%), by Country 2024 & 2032
- Figure 39: Europe Augmented and Virtual Reality in Healthcare Market Revenue (Million), by Technology 2024 & 2032
- Figure 40: Europe Augmented and Virtual Reality in Healthcare Market Volume (K Unit), by Technology 2024 & 2032
- Figure 41: Europe Augmented and Virtual Reality in Healthcare Market Revenue Share (%), by Technology 2024 & 2032
- Figure 42: Europe Augmented and Virtual Reality in Healthcare Market Volume Share (%), by Technology 2024 & 2032
- Figure 43: Europe Augmented and Virtual Reality in Healthcare Market Revenue (Million), by Product 2024 & 2032
- Figure 44: Europe Augmented and Virtual Reality in Healthcare Market Volume (K Unit), by Product 2024 & 2032
- Figure 45: Europe Augmented and Virtual Reality in Healthcare Market Revenue Share (%), by Product 2024 & 2032
- Figure 46: Europe Augmented and Virtual Reality in Healthcare Market Volume Share (%), by Product 2024 & 2032
- Figure 47: Europe Augmented and Virtual Reality in Healthcare Market Revenue (Million), by End User 2024 & 2032
- Figure 48: Europe Augmented and Virtual Reality in Healthcare Market Volume (K Unit), by End User 2024 & 2032
- Figure 49: Europe Augmented and Virtual Reality in Healthcare Market Revenue Share (%), by End User 2024 & 2032
- Figure 50: Europe Augmented and Virtual Reality in Healthcare Market Volume Share (%), by End User 2024 & 2032
- Figure 51: Europe Augmented and Virtual Reality in Healthcare Market Revenue (Million), by Country 2024 & 2032
- Figure 52: Europe Augmented and Virtual Reality in Healthcare Market Volume (K Unit), by Country 2024 & 2032
- Figure 53: Europe Augmented and Virtual Reality in Healthcare Market Revenue Share (%), by Country 2024 & 2032
- Figure 54: Europe Augmented and Virtual Reality in Healthcare Market Volume Share (%), by Country 2024 & 2032
- Figure 55: Asia Pacific Augmented and Virtual Reality in Healthcare Market Revenue (Million), by Technology 2024 & 2032
- Figure 56: Asia Pacific Augmented and Virtual Reality in Healthcare Market Volume (K Unit), by Technology 2024 & 2032
- Figure 57: Asia Pacific Augmented and Virtual Reality in Healthcare Market Revenue Share (%), by Technology 2024 & 2032
- Figure 58: Asia Pacific Augmented and Virtual Reality in Healthcare Market Volume Share (%), by Technology 2024 & 2032
- Figure 59: Asia Pacific Augmented and Virtual Reality in Healthcare Market Revenue (Million), by Product 2024 & 2032
- Figure 60: Asia Pacific Augmented and Virtual Reality in Healthcare Market Volume (K Unit), by Product 2024 & 2032
- Figure 61: Asia Pacific Augmented and Virtual Reality in Healthcare Market Revenue Share (%), by Product 2024 & 2032
- Figure 62: Asia Pacific Augmented and Virtual Reality in Healthcare Market Volume Share (%), by Product 2024 & 2032
- Figure 63: Asia Pacific Augmented and Virtual Reality in Healthcare Market Revenue (Million), by End User 2024 & 2032
- Figure 64: Asia Pacific Augmented and Virtual Reality in Healthcare Market Volume (K Unit), by End User 2024 & 2032
- Figure 65: Asia Pacific Augmented and Virtual Reality in Healthcare Market Revenue Share (%), by End User 2024 & 2032
- Figure 66: Asia Pacific Augmented and Virtual Reality in Healthcare Market Volume Share (%), by End User 2024 & 2032
- Figure 67: Asia Pacific Augmented and Virtual Reality in Healthcare Market Revenue (Million), by Country 2024 & 2032
- Figure 68: Asia Pacific Augmented and Virtual Reality in Healthcare Market Volume (K Unit), by Country 2024 & 2032
- Figure 69: Asia Pacific Augmented and Virtual Reality in Healthcare Market Revenue Share (%), by Country 2024 & 2032
- Figure 70: Asia Pacific Augmented and Virtual Reality in Healthcare Market Volume Share (%), by Country 2024 & 2032
- Figure 71: Middle East and Africa Augmented and Virtual Reality in Healthcare Market Revenue (Million), by Technology 2024 & 2032
- Figure 72: Middle East and Africa Augmented and Virtual Reality in Healthcare Market Volume (K Unit), by Technology 2024 & 2032
- Figure 73: Middle East and Africa Augmented and Virtual Reality in Healthcare Market Revenue Share (%), by Technology 2024 & 2032
- Figure 74: Middle East and Africa Augmented and Virtual Reality in Healthcare Market Volume Share (%), by Technology 2024 & 2032
- Figure 75: Middle East and Africa Augmented and Virtual Reality in Healthcare Market Revenue (Million), by Product 2024 & 2032
- Figure 76: Middle East and Africa Augmented and Virtual Reality in Healthcare Market Volume (K Unit), by Product 2024 & 2032
- Figure 77: Middle East and Africa Augmented and Virtual Reality in Healthcare Market Revenue Share (%), by Product 2024 & 2032
- Figure 78: Middle East and Africa Augmented and Virtual Reality in Healthcare Market Volume Share (%), by Product 2024 & 2032
- Figure 79: Middle East and Africa Augmented and Virtual Reality in Healthcare Market Revenue (Million), by End User 2024 & 2032
- Figure 80: Middle East and Africa Augmented and Virtual Reality in Healthcare Market Volume (K Unit), by End User 2024 & 2032
- Figure 81: Middle East and Africa Augmented and Virtual Reality in Healthcare Market Revenue Share (%), by End User 2024 & 2032
- Figure 82: Middle East and Africa Augmented and Virtual Reality in Healthcare Market Volume Share (%), by End User 2024 & 2032
- Figure 83: Middle East and Africa Augmented and Virtual Reality in Healthcare Market Revenue (Million), by Country 2024 & 2032
- Figure 84: Middle East and Africa Augmented and Virtual Reality in Healthcare Market Volume (K Unit), by Country 2024 & 2032
- Figure 85: Middle East and Africa Augmented and Virtual Reality in Healthcare Market Revenue Share (%), by Country 2024 & 2032
- Figure 86: Middle East and Africa Augmented and Virtual Reality in Healthcare Market Volume Share (%), by Country 2024 & 2032
- Figure 87: South America Augmented and Virtual Reality in Healthcare Market Revenue (Million), by Technology 2024 & 2032
- Figure 88: South America Augmented and Virtual Reality in Healthcare Market Volume (K Unit), by Technology 2024 & 2032
- Figure 89: South America Augmented and Virtual Reality in Healthcare Market Revenue Share (%), by Technology 2024 & 2032
- Figure 90: South America Augmented and Virtual Reality in Healthcare Market Volume Share (%), by Technology 2024 & 2032
- Figure 91: South America Augmented and Virtual Reality in Healthcare Market Revenue (Million), by Product 2024 & 2032
- Figure 92: South America Augmented and Virtual Reality in Healthcare Market Volume (K Unit), by Product 2024 & 2032
- Figure 93: South America Augmented and Virtual Reality in Healthcare Market Revenue Share (%), by Product 2024 & 2032
- Figure 94: South America Augmented and Virtual Reality in Healthcare Market Volume Share (%), by Product 2024 & 2032
- Figure 95: South America Augmented and Virtual Reality in Healthcare Market Revenue (Million), by End User 2024 & 2032
- Figure 96: South America Augmented and Virtual Reality in Healthcare Market Volume (K Unit), by End User 2024 & 2032
- Figure 97: South America Augmented and Virtual Reality in Healthcare Market Revenue Share (%), by End User 2024 & 2032
- Figure 98: South America Augmented and Virtual Reality in Healthcare Market Volume Share (%), by End User 2024 & 2032
- Figure 99: South America Augmented and Virtual Reality in Healthcare Market Revenue (Million), by Country 2024 & 2032
- Figure 100: South America Augmented and Virtual Reality in Healthcare Market Volume (K Unit), by Country 2024 & 2032
- Figure 101: South America Augmented and Virtual Reality in Healthcare Market Revenue Share (%), by Country 2024 & 2032
- Figure 102: South America Augmented and Virtual Reality in Healthcare Market Volume Share (%), by Country 2024 & 2032
List of Tables
- Table 1: Global Augmented and Virtual Reality in Healthcare Market Revenue Million Forecast, by Region 2019 & 2032
- Table 2: Global Augmented and Virtual Reality in Healthcare Market Volume K Unit Forecast, by Region 2019 & 2032
- Table 3: Global Augmented and Virtual Reality in Healthcare Market Revenue Million Forecast, by Technology 2019 & 2032
- Table 4: Global Augmented and Virtual Reality in Healthcare Market Volume K Unit Forecast, by Technology 2019 & 2032
- Table 5: Global Augmented and Virtual Reality in Healthcare Market Revenue Million Forecast, by Product 2019 & 2032
- Table 6: Global Augmented and Virtual Reality in Healthcare Market Volume K Unit Forecast, by Product 2019 & 2032
- Table 7: Global Augmented and Virtual Reality in Healthcare Market Revenue Million Forecast, by End User 2019 & 2032
- Table 8: Global Augmented and Virtual Reality in Healthcare Market Volume K Unit Forecast, by End User 2019 & 2032
- Table 9: Global Augmented and Virtual Reality in Healthcare Market Revenue Million Forecast, by Region 2019 & 2032
- Table 10: Global Augmented and Virtual Reality in Healthcare Market Volume K Unit Forecast, by Region 2019 & 2032
- Table 11: Global Augmented and Virtual Reality in Healthcare Market Revenue Million Forecast, by Country 2019 & 2032
- Table 12: Global Augmented and Virtual Reality in Healthcare Market Volume K Unit Forecast, by Country 2019 & 2032
- Table 13: United States Augmented and Virtual Reality in Healthcare Market Revenue (Million) Forecast, by Application 2019 & 2032
- Table 14: United States Augmented and Virtual Reality in Healthcare Market Volume (K Unit) Forecast, by Application 2019 & 2032
- Table 15: Canada Augmented and Virtual Reality in Healthcare Market Revenue (Million) Forecast, by Application 2019 & 2032
- Table 16: Canada Augmented and Virtual Reality in Healthcare Market Volume (K Unit) Forecast, by Application 2019 & 2032
- Table 17: Mexico Augmented and Virtual Reality in Healthcare Market Revenue (Million) Forecast, by Application 2019 & 2032
- Table 18: Mexico Augmented and Virtual Reality in Healthcare Market Volume (K Unit) Forecast, by Application 2019 & 2032
- Table 19: Global Augmented and Virtual Reality in Healthcare Market Revenue Million Forecast, by Country 2019 & 2032
- Table 20: Global Augmented and Virtual Reality in Healthcare Market Volume K Unit Forecast, by Country 2019 & 2032
- Table 21: Germany Augmented and Virtual Reality in Healthcare Market Revenue (Million) Forecast, by Application 2019 & 2032
- Table 22: Germany Augmented and Virtual Reality in Healthcare Market Volume (K Unit) Forecast, by Application 2019 & 2032
- Table 23: United Kingdom Augmented and Virtual Reality in Healthcare Market Revenue (Million) Forecast, by Application 2019 & 2032
- Table 24: United Kingdom Augmented and Virtual Reality in Healthcare Market Volume (K Unit) Forecast, by Application 2019 & 2032
- Table 25: France Augmented and Virtual Reality in Healthcare Market Revenue (Million) Forecast, by Application 2019 & 2032
- Table 26: France Augmented and Virtual Reality in Healthcare Market Volume (K Unit) Forecast, by Application 2019 & 2032
- Table 27: Italy Augmented and Virtual Reality in Healthcare Market Revenue (Million) Forecast, by Application 2019 & 2032
- Table 28: Italy Augmented and Virtual Reality in Healthcare Market Volume (K Unit) Forecast, by Application 2019 & 2032
- Table 29: Spain Augmented and Virtual Reality in Healthcare Market Revenue (Million) Forecast, by Application 2019 & 2032
- Table 30: Spain Augmented and Virtual Reality in Healthcare Market Volume (K Unit) Forecast, by Application 2019 & 2032
- Table 31: Rest of Europe Augmented and Virtual Reality in Healthcare Market Revenue (Million) Forecast, by Application 2019 & 2032
- Table 32: Rest of Europe Augmented and Virtual Reality in Healthcare Market Volume (K Unit) Forecast, by Application 2019 & 2032
- Table 33: Global Augmented and Virtual Reality in Healthcare Market Revenue Million Forecast, by Country 2019 & 2032
- Table 34: Global Augmented and Virtual Reality in Healthcare Market Volume K Unit Forecast, by Country 2019 & 2032
- Table 35: China Augmented and Virtual Reality in Healthcare Market Revenue (Million) Forecast, by Application 2019 & 2032
- Table 36: China Augmented and Virtual Reality in Healthcare Market Volume (K Unit) Forecast, by Application 2019 & 2032
- Table 37: Japan Augmented and Virtual Reality in Healthcare Market Revenue (Million) Forecast, by Application 2019 & 2032
- Table 38: Japan Augmented and Virtual Reality in Healthcare Market Volume (K Unit) Forecast, by Application 2019 & 2032
- Table 39: India Augmented and Virtual Reality in Healthcare Market Revenue (Million) Forecast, by Application 2019 & 2032
- Table 40: India Augmented and Virtual Reality in Healthcare Market Volume (K Unit) Forecast, by Application 2019 & 2032
- Table 41: Australia Augmented and Virtual Reality in Healthcare Market Revenue (Million) Forecast, by Application 2019 & 2032
- Table 42: Australia Augmented and Virtual Reality in Healthcare Market Volume (K Unit) Forecast, by Application 2019 & 2032
- Table 43: South Korea Augmented and Virtual Reality in Healthcare Market Revenue (Million) Forecast, by Application 2019 & 2032
- Table 44: South Korea Augmented and Virtual Reality in Healthcare Market Volume (K Unit) Forecast, by Application 2019 & 2032
- Table 45: Rest of Asia Pacific Augmented and Virtual Reality in Healthcare Market Revenue (Million) Forecast, by Application 2019 & 2032
- Table 46: Rest of Asia Pacific Augmented and Virtual Reality in Healthcare Market Volume (K Unit) Forecast, by Application 2019 & 2032
- Table 47: Global Augmented and Virtual Reality in Healthcare Market Revenue Million Forecast, by Country 2019 & 2032
- Table 48: Global Augmented and Virtual Reality in Healthcare Market Volume K Unit Forecast, by Country 2019 & 2032
- Table 49: GCC Augmented and Virtual Reality in Healthcare Market Revenue (Million) Forecast, by Application 2019 & 2032
- Table 50: GCC Augmented and Virtual Reality in Healthcare Market Volume (K Unit) Forecast, by Application 2019 & 2032
- Table 51: South Africa Augmented and Virtual Reality in Healthcare Market Revenue (Million) Forecast, by Application 2019 & 2032
- Table 52: South Africa Augmented and Virtual Reality in Healthcare Market Volume (K Unit) Forecast, by Application 2019 & 2032
- Table 53: Rest of Middle East and Africa Augmented and Virtual Reality in Healthcare Market Revenue (Million) Forecast, by Application 2019 & 2032
- Table 54: Rest of Middle East and Africa Augmented and Virtual Reality in Healthcare Market Volume (K Unit) Forecast, by Application 2019 & 2032
- Table 55: Global Augmented and Virtual Reality in Healthcare Market Revenue Million Forecast, by Country 2019 & 2032
- Table 56: Global Augmented and Virtual Reality in Healthcare Market Volume K Unit Forecast, by Country 2019 & 2032
- Table 57: Brazil Augmented and Virtual Reality in Healthcare Market Revenue (Million) Forecast, by Application 2019 & 2032
- Table 58: Brazil Augmented and Virtual Reality in Healthcare Market Volume (K Unit) Forecast, by Application 2019 & 2032
- Table 59: Argentina Augmented and Virtual Reality in Healthcare Market Revenue (Million) Forecast, by Application 2019 & 2032
- Table 60: Argentina Augmented and Virtual Reality in Healthcare Market Volume (K Unit) Forecast, by Application 2019 & 2032
- Table 61: Rest of South America Augmented and Virtual Reality in Healthcare Market Revenue (Million) Forecast, by Application 2019 & 2032
- Table 62: Rest of South America Augmented and Virtual Reality in Healthcare Market Volume (K Unit) Forecast, by Application 2019 & 2032
- Table 63: Global Augmented and Virtual Reality in Healthcare Market Revenue Million Forecast, by Technology 2019 & 2032
- Table 64: Global Augmented and Virtual Reality in Healthcare Market Volume K Unit Forecast, by Technology 2019 & 2032
- Table 65: Global Augmented and Virtual Reality in Healthcare Market Revenue Million Forecast, by Product 2019 & 2032
- Table 66: Global Augmented and Virtual Reality in Healthcare Market Volume K Unit Forecast, by Product 2019 & 2032
- Table 67: Global Augmented and Virtual Reality in Healthcare Market Revenue Million Forecast, by End User 2019 & 2032
- Table 68: Global Augmented and Virtual Reality in Healthcare Market Volume K Unit Forecast, by End User 2019 & 2032
- Table 69: Global Augmented and Virtual Reality in Healthcare Market Revenue Million Forecast, by Country 2019 & 2032
- Table 70: Global Augmented and Virtual Reality in Healthcare Market Volume K Unit Forecast, by Country 2019 & 2032
- Table 71: United States Augmented and Virtual Reality in Healthcare Market Revenue (Million) Forecast, by Application 2019 & 2032
- Table 72: United States Augmented and Virtual Reality in Healthcare Market Volume (K Unit) Forecast, by Application 2019 & 2032
- Table 73: Canada Augmented and Virtual Reality in Healthcare Market Revenue (Million) Forecast, by Application 2019 & 2032
- Table 74: Canada Augmented and Virtual Reality in Healthcare Market Volume (K Unit) Forecast, by Application 2019 & 2032
- Table 75: Mexico Augmented and Virtual Reality in Healthcare Market Revenue (Million) Forecast, by Application 2019 & 2032
- Table 76: Mexico Augmented and Virtual Reality in Healthcare Market Volume (K Unit) Forecast, by Application 2019 & 2032
- Table 77: Global Augmented and Virtual Reality in Healthcare Market Revenue Million Forecast, by Technology 2019 & 2032
- Table 78: Global Augmented and Virtual Reality in Healthcare Market Volume K Unit Forecast, by Technology 2019 & 2032
- Table 79: Global Augmented and Virtual Reality in Healthcare Market Revenue Million Forecast, by Product 2019 & 2032
- Table 80: Global Augmented and Virtual Reality in Healthcare Market Volume K Unit Forecast, by Product 2019 & 2032
- Table 81: Global Augmented and Virtual Reality in Healthcare Market Revenue Million Forecast, by End User 2019 & 2032
- Table 82: Global Augmented and Virtual Reality in Healthcare Market Volume K Unit Forecast, by End User 2019 & 2032
- Table 83: Global Augmented and Virtual Reality in Healthcare Market Revenue Million Forecast, by Country 2019 & 2032
- Table 84: Global Augmented and Virtual Reality in Healthcare Market Volume K Unit Forecast, by Country 2019 & 2032
- Table 85: Germany Augmented and Virtual Reality in Healthcare Market Revenue (Million) Forecast, by Application 2019 & 2032
- Table 86: Germany Augmented and Virtual Reality in Healthcare Market Volume (K Unit) Forecast, by Application 2019 & 2032
- Table 87: United Kingdom Augmented and Virtual Reality in Healthcare Market Revenue (Million) Forecast, by Application 2019 & 2032
- Table 88: United Kingdom Augmented and Virtual Reality in Healthcare Market Volume (K Unit) Forecast, by Application 2019 & 2032
- Table 89: France Augmented and Virtual Reality in Healthcare Market Revenue (Million) Forecast, by Application 2019 & 2032
- Table 90: France Augmented and Virtual Reality in Healthcare Market Volume (K Unit) Forecast, by Application 2019 & 2032
- Table 91: Italy Augmented and Virtual Reality in Healthcare Market Revenue (Million) Forecast, by Application 2019 & 2032
- Table 92: Italy Augmented and Virtual Reality in Healthcare Market Volume (K Unit) Forecast, by Application 2019 & 2032
- Table 93: Spain Augmented and Virtual Reality in Healthcare Market Revenue (Million) Forecast, by Application 2019 & 2032
- Table 94: Spain Augmented and Virtual Reality in Healthcare Market Volume (K Unit) Forecast, by Application 2019 & 2032
- Table 95: Rest of Europe Augmented and Virtual Reality in Healthcare Market Revenue (Million) Forecast, by Application 2019 & 2032
- Table 96: Rest of Europe Augmented and Virtual Reality in Healthcare Market Volume (K Unit) Forecast, by Application 2019 & 2032
- Table 97: Global Augmented and Virtual Reality in Healthcare Market Revenue Million Forecast, by Technology 2019 & 2032
- Table 98: Global Augmented and Virtual Reality in Healthcare Market Volume K Unit Forecast, by Technology 2019 & 2032
- Table 99: Global Augmented and Virtual Reality in Healthcare Market Revenue Million Forecast, by Product 2019 & 2032
- Table 100: Global Augmented and Virtual Reality in Healthcare Market Volume K Unit Forecast, by Product 2019 & 2032
- Table 101: Global Augmented and Virtual Reality in Healthcare Market Revenue Million Forecast, by End User 2019 & 2032
- Table 102: Global Augmented and Virtual Reality in Healthcare Market Volume K Unit Forecast, by End User 2019 & 2032
- Table 103: Global Augmented and Virtual Reality in Healthcare Market Revenue Million Forecast, by Country 2019 & 2032
- Table 104: Global Augmented and Virtual Reality in Healthcare Market Volume K Unit Forecast, by Country 2019 & 2032
- Table 105: China Augmented and Virtual Reality in Healthcare Market Revenue (Million) Forecast, by Application 2019 & 2032
- Table 106: China Augmented and Virtual Reality in Healthcare Market Volume (K Unit) Forecast, by Application 2019 & 2032
- Table 107: Japan Augmented and Virtual Reality in Healthcare Market Revenue (Million) Forecast, by Application 2019 & 2032
- Table 108: Japan Augmented and Virtual Reality in Healthcare Market Volume (K Unit) Forecast, by Application 2019 & 2032
- Table 109: India Augmented and Virtual Reality in Healthcare Market Revenue (Million) Forecast, by Application 2019 & 2032
- Table 110: India Augmented and Virtual Reality in Healthcare Market Volume (K Unit) Forecast, by Application 2019 & 2032
- Table 111: Australia Augmented and Virtual Reality in Healthcare Market Revenue (Million) Forecast, by Application 2019 & 2032
- Table 112: Australia Augmented and Virtual Reality in Healthcare Market Volume (K Unit) Forecast, by Application 2019 & 2032
- Table 113: South Korea Augmented and Virtual Reality in Healthcare Market Revenue (Million) Forecast, by Application 2019 & 2032
- Table 114: South Korea Augmented and Virtual Reality in Healthcare Market Volume (K Unit) Forecast, by Application 2019 & 2032
- Table 115: Rest of Asia Pacific Augmented and Virtual Reality in Healthcare Market Revenue (Million) Forecast, by Application 2019 & 2032
- Table 116: Rest of Asia Pacific Augmented and Virtual Reality in Healthcare Market Volume (K Unit) Forecast, by Application 2019 & 2032
- Table 117: Global Augmented and Virtual Reality in Healthcare Market Revenue Million Forecast, by Technology 2019 & 2032
- Table 118: Global Augmented and Virtual Reality in Healthcare Market Volume K Unit Forecast, by Technology 2019 & 2032
- Table 119: Global Augmented and Virtual Reality in Healthcare Market Revenue Million Forecast, by Product 2019 & 2032
- Table 120: Global Augmented and Virtual Reality in Healthcare Market Volume K Unit Forecast, by Product 2019 & 2032
- Table 121: Global Augmented and Virtual Reality in Healthcare Market Revenue Million Forecast, by End User 2019 & 2032
- Table 122: Global Augmented and Virtual Reality in Healthcare Market Volume K Unit Forecast, by End User 2019 & 2032
- Table 123: Global Augmented and Virtual Reality in Healthcare Market Revenue Million Forecast, by Country 2019 & 2032
- Table 124: Global Augmented and Virtual Reality in Healthcare Market Volume K Unit Forecast, by Country 2019 & 2032
- Table 125: GCC Augmented and Virtual Reality in Healthcare Market Revenue (Million) Forecast, by Application 2019 & 2032
- Table 126: GCC Augmented and Virtual Reality in Healthcare Market Volume (K Unit) Forecast, by Application 2019 & 2032
- Table 127: South Africa Augmented and Virtual Reality in Healthcare Market Revenue (Million) Forecast, by Application 2019 & 2032
- Table 128: South Africa Augmented and Virtual Reality in Healthcare Market Volume (K Unit) Forecast, by Application 2019 & 2032
- Table 129: Rest of Middle East and Africa Augmented and Virtual Reality in Healthcare Market Revenue (Million) Forecast, by Application 2019 & 2032
- Table 130: Rest of Middle East and Africa Augmented and Virtual Reality in Healthcare Market Volume (K Unit) Forecast, by Application 2019 & 2032
- Table 131: Global Augmented and Virtual Reality in Healthcare Market Revenue Million Forecast, by Technology 2019 & 2032
- Table 132: Global Augmented and Virtual Reality in Healthcare Market Volume K Unit Forecast, by Technology 2019 & 2032
- Table 133: Global Augmented and Virtual Reality in Healthcare Market Revenue Million Forecast, by Product 2019 & 2032
- Table 134: Global Augmented and Virtual Reality in Healthcare Market Volume K Unit Forecast, by Product 2019 & 2032
- Table 135: Global Augmented and Virtual Reality in Healthcare Market Revenue Million Forecast, by End User 2019 & 2032
- Table 136: Global Augmented and Virtual Reality in Healthcare Market Volume K Unit Forecast, by End User 2019 & 2032
- Table 137: Global Augmented and Virtual Reality in Healthcare Market Revenue Million Forecast, by Country 2019 & 2032
- Table 138: Global Augmented and Virtual Reality in Healthcare Market Volume K Unit Forecast, by Country 2019 & 2032
- Table 139: Brazil Augmented and Virtual Reality in Healthcare Market Revenue (Million) Forecast, by Application 2019 & 2032
- Table 140: Brazil Augmented and Virtual Reality in Healthcare Market Volume (K Unit) Forecast, by Application 2019 & 2032
- Table 141: Argentina Augmented and Virtual Reality in Healthcare Market Revenue (Million) Forecast, by Application 2019 & 2032
- Table 142: Argentina Augmented and Virtual Reality in Healthcare Market Volume (K Unit) Forecast, by Application 2019 & 2032
- Table 143: Rest of South America Augmented and Virtual Reality in Healthcare Market Revenue (Million) Forecast, by Application 2019 & 2032
- Table 144: Rest of South America Augmented and Virtual Reality in Healthcare Market Volume (K Unit) Forecast, by Application 2019 & 2032
Frequently Asked Questions
1. What is the projected Compound Annual Growth Rate (CAGR) of the Augmented and Virtual Reality in Healthcare Market?
The projected CAGR is approximately 26.99%.
2. Which companies are prominent players in the Augmented and Virtual Reality in Healthcare Market?
Key companies in the market include Microsoft, Augmedix, Orca Health Inc, Intuitive Surgical, EchoPixel, Augmented Pixels Inc, Siemens Healthineers, Surgical Theater, Koninklijke Philips N V, Vuzix Corporation, AccuVein Inc, CAE Healthcare.
3. What are the main segments of the Augmented and Virtual Reality in Healthcare Market?
The market segments include Technology, Product, End User.
4. Can you provide details about the market size?
The market size is estimated to be USD 1.19 Million as of 2022.
5. What are some drivers contributing to market growth?
Rise in Adoption of Augmented Reality in Healthcare; Increase in Investments in Augmented Reality; Rise in Number of Start Up Companies in the Market.
6. What are the notable trends driving market growth?
Head-Mounted Devices Segment is Expected to Hold a Significant Share in the Market Over the Forecast Period.
7. Are there any restraints impacting market growth?
High Cost of Augmented Reality Products; Data Security Concers.
8. Can you provide examples of recent developments in the market?
N/A
9. What pricing options are available for accessing the report?
Pricing options include single-user, multi-user, and enterprise licenses priced at USD 4750, USD 5250, and USD 8750 respectively.
10. Is the market size provided in terms of value or volume?
The market size is provided in terms of value, measured in Million and volume, measured in K Unit.
11. Are there any specific market keywords associated with the report?
Yes, the market keyword associated with the report is "Augmented and Virtual Reality in Healthcare Market," which aids in identifying and referencing the specific market segment covered.
12. How do I determine which pricing option suits my needs best?
The pricing options vary based on user requirements and access needs. Individual users may opt for single-user licenses, while businesses requiring broader access may choose multi-user or enterprise licenses for cost-effective access to the report.
13. Are there any additional resources or data provided in the Augmented and Virtual Reality in Healthcare Market report?
While the report offers comprehensive insights, it's advisable to review the specific contents or supplementary materials provided to ascertain if additional resources or data are available.
14. How can I stay updated on further developments or reports in the Augmented and Virtual Reality in Healthcare Market?
To stay informed about further developments, trends, and reports in the Augmented and Virtual Reality in Healthcare Market, consider subscribing to industry newsletters, following relevant companies and organizations, or regularly checking reputable industry news sources and publications.
Methodology
Step 1 - Identification of Relevant Samples Size from Population Database


Step 2 - Approaches for Defining Global Market Size (Value, Volume* & Price*)

Note*: In applicable scenarios
Step 3 - Data Sources
Primary Research
- Web Analytics
- Survey Reports
- Research Institute
- Latest Research Reports
- Opinion Leaders
Secondary Research
- Annual Reports
- White Paper
- Latest Press Release
- Industry Association
- Paid Database
- Investor Presentations

Step 4 - Data Triangulation
Involves using different sources of information in order to increase the validity of a study
These sources are likely to be stakeholders in a program - participants, other researchers, program staff, other community members, and so on.
Then we put all data in single framework & apply various statistical tools to find out the dynamic on the market.
During the analysis stage, feedback from the stakeholder groups would be compared to determine areas of agreement as well as areas of divergence


