Key Insights
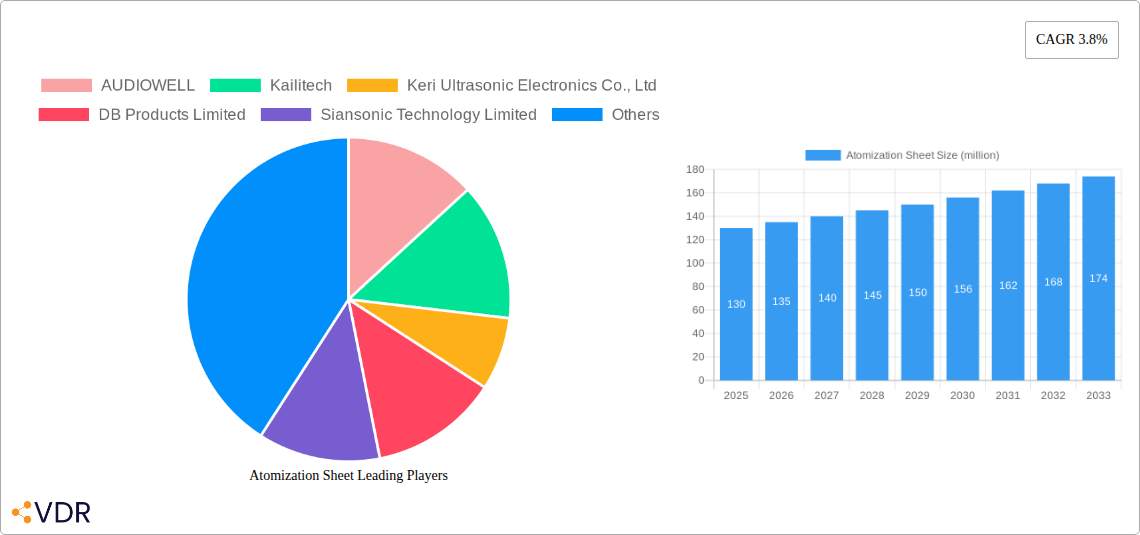
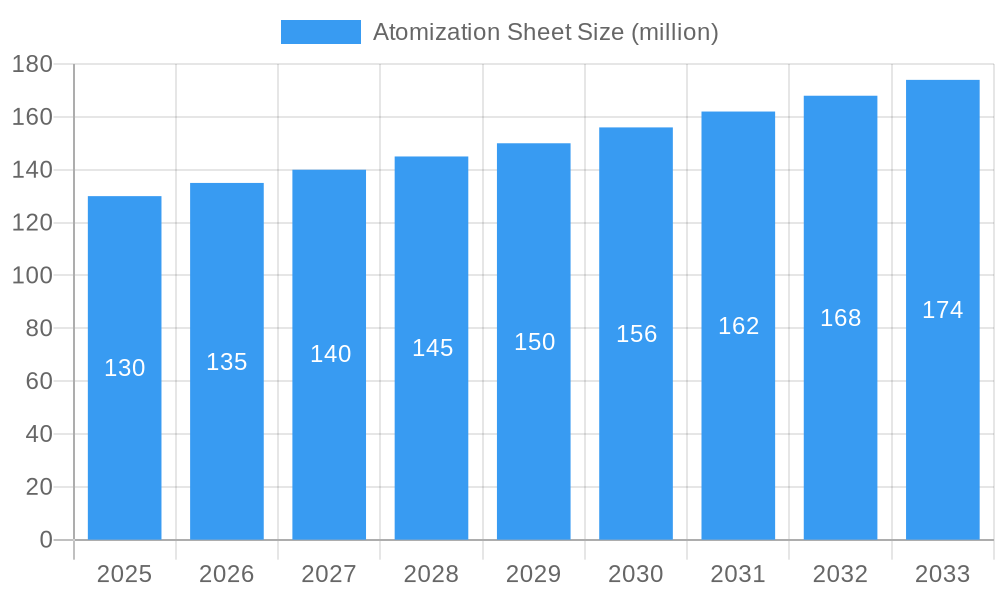
The global Atomization Sheet market is projected to reach an estimated $130 million in 2025, driven by a steady CAGR of 3.8% throughout the forecast period from 2025 to 2033. This growth is fueled by the increasing adoption of ultrasonic atomization technology across diverse applications, most notably in humidifiers and aromatherapy machines, which are experiencing rising consumer demand due to growing awareness of air quality and wellness. The medical nebulizer segment also contributes significantly, benefiting from advancements in respiratory care devices and an aging global population. Emerging applications beyond these core areas are further expanding the market's potential. The market's trajectory is supported by continuous innovation in ceramic and microporous atomization sheet technologies, leading to improved efficiency, durability, and miniaturization of devices.
Atomization Sheet Market Size (In Million)
The market's expansion is further propelled by the increasing integration of atomization sheets into smart home devices and personal care electronics, creating new avenues for growth. The growing preference for aesthetically pleasing and functionally superior humidifiers and aromatherapy diffusers, coupled with the expanding healthcare infrastructure and accessibility to medical devices in developing regions, are key market accelerators. While the market presents a positive outlook, challenges such as the raw material price volatility and the development of alternative atomization technologies could pose some restraints. However, the consistent demand from established applications and the emergence of novel use cases are expected to outweigh these concerns, ensuring robust market expansion. Geographically, the Asia Pacific region, particularly China, is anticipated to lead the market in terms of both production and consumption, owing to its strong manufacturing base and burgeoning consumer market.
Atomization Sheet Company Market Share
Atomization Sheet Market: Comprehensive Analysis & Future Outlook (2019-2033)
This comprehensive report delivers an in-depth analysis of the global atomization sheet market, a critical component across diverse applications including humidifiers, aromatherapy machines, and medical nebulizers. Leveraging advanced analytical frameworks and extensive market intelligence, this report provides actionable insights for stakeholders navigating this dynamic industry. We dissect market segmentation by type, including Ceramic Atomization Sheets and Microporous Atomization Sheets, and explore regional dominance and growth drivers. Our analysis encompasses the historical trajectory, current market state, and a robust forecast for the period 2019–2033, with a base year of 2025.
Atomization Sheet Market Dynamics & Structure
The atomization sheet market exhibits a moderately concentrated structure, characterized by a mix of established players and emerging innovators. Technological innovation serves as a primary driver, with advancements in material science and manufacturing processes continuously improving the efficiency, durability, and cost-effectiveness of atomization sheets. Regulatory frameworks, particularly concerning safety and environmental standards for devices utilizing these components, play a significant role in shaping product development and market access. The competitive landscape is influenced by the availability of competitive product substitutes, although atomization sheets currently hold a strong position for their specific performance characteristics. End-user demographics are evolving, driven by increasing consumer awareness of health and wellness, and a growing demand for portable and efficient atomization solutions. Mergers and acquisitions (M&A) trends indicate a strategic consolidation in certain sub-segments, aimed at expanding product portfolios and market reach.
- Market Concentration: A blend of large, diversified manufacturers and specialized niche players.
- Technological Innovation: Continuous research in piezoelectric ceramics, ultrasonic frequencies, and membrane technologies.
- Regulatory Frameworks: Compliance with health and safety standards (e.g., RoHS, CE, FDA) is crucial.
- Competitive Product Substitutes: While alternatives exist, atomization sheets offer unique performance for specific applications.
- End-User Demographics: Growing demand from health-conscious consumers and the medical sector.
- M&A Trends: Strategic acquisitions for technology integration and market share expansion are observed, with an estimated xx deal volumes in the past five years.
Atomization Sheet Growth Trends & Insights
The global atomization sheet market is poised for significant expansion, driven by escalating demand across its core applications. The market size is projected to evolve from an estimated xx million units in 2025 to a substantial xx million units by 2033, reflecting a robust Compound Annual Growth Rate (CAGR) of xx% during the forecast period. This growth is fueled by increasing adoption rates in both consumer and medical sectors. Technological disruptions are a constant feature, with innovations focusing on miniaturization, energy efficiency, and enhanced atomization precision. Consumer behavior shifts are playing a pivotal role, with a heightened preference for smart home devices, personal wellness products, and portable healthcare solutions, all of which integrate atomization technology. The market penetration of advanced atomization sheets is expected to surge as manufacturers develop more sophisticated and cost-effective solutions. The increasing prevalence of respiratory ailments and a growing emphasis on air quality management further bolster the demand for humidifiers and medical nebulizers, key end-use segments for atomization sheets. Furthermore, the burgeoning aromatherapy industry, driven by consumer interest in natural remedies and stress relief, presents a consistent growth avenue. The development of ultra-fine mist technologies and silent operation features are key trends influencing product development and consumer purchasing decisions.
Dominant Regions, Countries, or Segments in Atomization Sheet
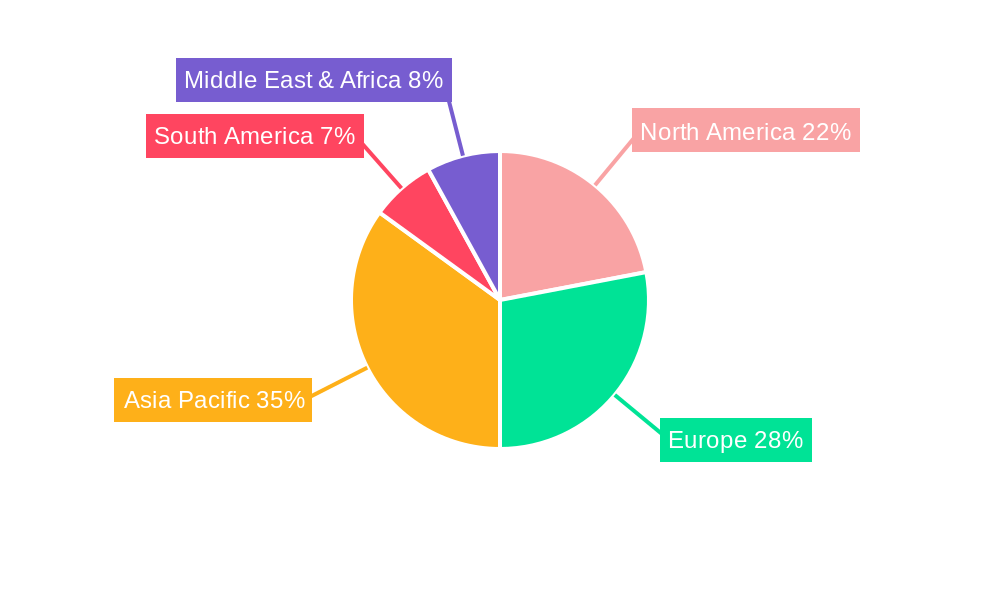
The Asia Pacific region is a dominant force in the global atomization sheet market, driven by its strong manufacturing base, rapidly growing consumer market, and increasing healthcare expenditure. Within this region, China stands out as a leading country, benefiting from extensive domestic production capabilities and a massive consumer base for products like humidifiers and aromatherapy machines. The Ceramic Atomization Sheet segment is a key driver of growth, owing to its widespread application in various consumer electronics and its established manufacturing ecosystem.
- Asia Pacific Dominance: This region accounts for an estimated xx% of the global atomization sheet market share due to its robust manufacturing infrastructure and significant consumer demand.
- China's Leading Role: China's market size is projected to reach xx million units by 2025, driven by its status as a global manufacturing hub and a large domestic consumer base.
- Ceramic Atomization Sheet Segment: This segment holds an estimated xx% of the market share and is expected to grow at a CAGR of xx% during the forecast period, driven by its versatility and cost-effectiveness in humidifiers and aromatherapy machines.
- Medical Nebulizer Growth: The Medical Nebulizer application segment, while smaller, is experiencing a higher CAGR of xx% due to increasing healthcare awareness and demand for portable respiratory care solutions, particularly in developed nations.
- Technological Advancements in Microporous Atomization Sheets: Innovations in microporous technology are enhancing efficiency and portability, leading to increased adoption in niche applications.
- Economic Policies and Infrastructure: Favorable government policies supporting manufacturing and a well-developed supply chain infrastructure in countries like China and South Korea further cement Asia Pacific's dominance.
- Growth Potential in Emerging Markets: While Asia Pacific leads, emerging markets in Southeast Asia and India show significant growth potential due to rising disposable incomes and increasing adoption of home appliances.
Atomization Sheet Product Landscape
The atomization sheet product landscape is characterized by continuous innovation, focusing on enhanced atomization efficiency, reduced power consumption, and increased durability. Ceramic atomization sheets, often leveraging piezoelectric principles, are prevalent in humidifiers and aromatherapy machines for their cost-effectiveness and reliability. Microporous atomization sheets, known for their ability to produce ultra-fine mists, are finding increasing applications in advanced medical nebulizers and skincare devices. Manufacturers are actively developing sheets with specialized coatings to prevent clogging and improve longevity. Performance metrics like droplet size distribution, power efficiency (measured in mW/ml/hr), and operational lifespan (in hours) are key differentiators.
Key Drivers, Barriers & Challenges in Atomization Sheet
Key Drivers:
- Technological Advancements: Innovations in piezoelectric materials and manufacturing processes leading to more efficient and cost-effective atomization.
- Growing Health & Wellness Trends: Increased demand for humidifiers, air purifiers, and aromatherapy devices for personal well-being.
- Expanding Medical Applications: Rising use of nebulizers for respiratory disease management and drug delivery.
- Miniaturization and Portability: Demand for compact and portable atomization solutions in consumer electronics.
Barriers & Challenges:
- Supply Chain Disruptions: Reliance on specific raw materials and potential geopolitical factors impacting global supply chains, with an estimated xx% impact on production timelines.
- Regulatory Hurdles: Stringent quality and safety standards, particularly for medical-grade atomization sheets, requiring significant R&D investment.
- Price Sensitivity: In consumer applications, a balance between performance and cost is crucial, leading to intense price competition.
- Limited Awareness in Niche Applications: Educating potential users about the benefits of atomization technology in new or emerging fields.
Emerging Opportunities in Atomization Sheet
Emerging opportunities lie in the development of smart atomization sheets with integrated sensors for real-time performance monitoring and self-cleaning capabilities. The burgeoning market for personalized medicine and advanced drug delivery systems presents a significant avenue for specialized atomization sheets capable of precise aerosolization of pharmaceutical compounds. Furthermore, the expansion of the industrial humidifier market, particularly in sectors like agriculture and manufacturing requiring precise humidity control, offers untapped potential. Growth in smart home ecosystems also creates opportunities for seamless integration of atomization-based devices.
Growth Accelerators in the Atomization Sheet Industry
Long-term growth in the atomization sheet industry will be significantly accelerated by breakthroughs in nanotechnology for even finer mist generation and improved particle deposition. Strategic partnerships between atomization sheet manufacturers and device OEMs will streamline product development and market penetration. The increasing global focus on air quality and environmental health will drive demand for advanced humidification and purification systems. Furthermore, market expansion into developing economies, coupled with rising disposable incomes, will unlock new consumer segments for atomization-based products.
Key Players Shaping the Atomization Sheet Market
- AUDIOWELL
- Kailitech
- Keri Ultrasonic Electronics Co., Ltd
- DB Products Limited
- Siansonic Technology Limited
- Nanjing Hanzhou Technologie Co., LTD.
- HUNAN JIAYE DA ELECTRONIC CO.,LTD
- Dongguan Tiangong Laser Products Co., Ltd
Notable Milestones in Atomization Sheet Sector
- 2021: Launch of ultra-low power consumption ceramic atomization sheets by [Company Name], enhancing battery life for portable devices.
- 2022: Introduction of antimicrobial coatings for medical nebulizer atomization sheets by [Company Name], improving patient safety.
- 2023: Significant investment in R&D for nanotechnology-based atomization by [Company Name], promising finer mist generation.
- 2024: Key acquisition of a specialized atomization technology firm by [Company Name], expanding their product portfolio and market reach in the medical segment.
In-Depth Atomization Sheet Market Outlook
The future outlook for the atomization sheet market is exceptionally positive, underpinned by sustained growth accelerators. Continued technological innovation in material science and manufacturing will yield more efficient, durable, and specialized atomization solutions. The increasing global emphasis on health, wellness, and improved air quality will drive demand across consumer and medical applications. Strategic collaborations and market expansion into untapped regions represent significant opportunities for growth. The industry is well-positioned to capitalize on emerging trends, including smart devices and advanced drug delivery systems, ensuring robust long-term market potential.
Atomization Sheet Segmentation
-
1. Application
- 1.1. Humidifier
- 1.2. Aromatherapy Machine
- 1.3. Medical Nebulizer
- 1.4. Other
-
2. Type
- 2.1. Ceramic Atomization Sheet
- 2.2. Microporous Atomization Sheet
Atomization Sheet Segmentation By Geography
-
1. North America
- 1.1. United States
- 1.2. Canada
- 1.3. Mexico
-
2. South America
- 2.1. Brazil
- 2.2. Argentina
- 2.3. Rest of South America
-
3. Europe
- 3.1. United Kingdom
- 3.2. Germany
- 3.3. France
- 3.4. Italy
- 3.5. Spain
- 3.6. Russia
- 3.7. Benelux
- 3.8. Nordics
- 3.9. Rest of Europe
-
4. Middle East & Africa
- 4.1. Turkey
- 4.2. Israel
- 4.3. GCC
- 4.4. North Africa
- 4.5. South Africa
- 4.6. Rest of Middle East & Africa
-
5. Asia Pacific
- 5.1. China
- 5.2. India
- 5.3. Japan
- 5.4. South Korea
- 5.5. ASEAN
- 5.6. Oceania
- 5.7. Rest of Asia Pacific
Atomization Sheet Regional Market Share
Geographic Coverage of Atomization Sheet
Atomization Sheet REPORT HIGHLIGHTS
| Aspects | Details |
|---|---|
| Study Period | 2020-2034 |
| Base Year | 2025 |
| Estimated Year | 2026 |
| Forecast Period | 2026-2034 |
| Historical Period | 2020-2025 |
| Growth Rate | CAGR of 3.8% from 2020-2034 |
| Segmentation |
|
Table of Contents
- 1. Introduction
- 1.1. Research Scope
- 1.2. Market Segmentation
- 1.3. Research Methodology
- 1.4. Definitions and Assumptions
- 2. Executive Summary
- 2.1. Introduction
- 3. Market Dynamics
- 3.1. Introduction
- 3.2. Market Drivers
- 3.3. Market Restrains
- 3.4. Market Trends
- 4. Market Factor Analysis
- 4.1. Porters Five Forces
- 4.2. Supply/Value Chain
- 4.3. PESTEL analysis
- 4.4. Market Entropy
- 4.5. Patent/Trademark Analysis
- 5. Global Atomization Sheet Analysis, Insights and Forecast, 2020-2032
- 5.1. Market Analysis, Insights and Forecast - by Application
- 5.1.1. Humidifier
- 5.1.2. Aromatherapy Machine
- 5.1.3. Medical Nebulizer
- 5.1.4. Other
- 5.2. Market Analysis, Insights and Forecast - by Type
- 5.2.1. Ceramic Atomization Sheet
- 5.2.2. Microporous Atomization Sheet
- 5.3. Market Analysis, Insights and Forecast - by Region
- 5.3.1. North America
- 5.3.2. South America
- 5.3.3. Europe
- 5.3.4. Middle East & Africa
- 5.3.5. Asia Pacific
- 5.1. Market Analysis, Insights and Forecast - by Application
- 6. North America Atomization Sheet Analysis, Insights and Forecast, 2020-2032
- 6.1. Market Analysis, Insights and Forecast - by Application
- 6.1.1. Humidifier
- 6.1.2. Aromatherapy Machine
- 6.1.3. Medical Nebulizer
- 6.1.4. Other
- 6.2. Market Analysis, Insights and Forecast - by Type
- 6.2.1. Ceramic Atomization Sheet
- 6.2.2. Microporous Atomization Sheet
- 6.1. Market Analysis, Insights and Forecast - by Application
- 7. South America Atomization Sheet Analysis, Insights and Forecast, 2020-2032
- 7.1. Market Analysis, Insights and Forecast - by Application
- 7.1.1. Humidifier
- 7.1.2. Aromatherapy Machine
- 7.1.3. Medical Nebulizer
- 7.1.4. Other
- 7.2. Market Analysis, Insights and Forecast - by Type
- 7.2.1. Ceramic Atomization Sheet
- 7.2.2. Microporous Atomization Sheet
- 7.1. Market Analysis, Insights and Forecast - by Application
- 8. Europe Atomization Sheet Analysis, Insights and Forecast, 2020-2032
- 8.1. Market Analysis, Insights and Forecast - by Application
- 8.1.1. Humidifier
- 8.1.2. Aromatherapy Machine
- 8.1.3. Medical Nebulizer
- 8.1.4. Other
- 8.2. Market Analysis, Insights and Forecast - by Type
- 8.2.1. Ceramic Atomization Sheet
- 8.2.2. Microporous Atomization Sheet
- 8.1. Market Analysis, Insights and Forecast - by Application
- 9. Middle East & Africa Atomization Sheet Analysis, Insights and Forecast, 2020-2032
- 9.1. Market Analysis, Insights and Forecast - by Application
- 9.1.1. Humidifier
- 9.1.2. Aromatherapy Machine
- 9.1.3. Medical Nebulizer
- 9.1.4. Other
- 9.2. Market Analysis, Insights and Forecast - by Type
- 9.2.1. Ceramic Atomization Sheet
- 9.2.2. Microporous Atomization Sheet
- 9.1. Market Analysis, Insights and Forecast - by Application
- 10. Asia Pacific Atomization Sheet Analysis, Insights and Forecast, 2020-2032
- 10.1. Market Analysis, Insights and Forecast - by Application
- 10.1.1. Humidifier
- 10.1.2. Aromatherapy Machine
- 10.1.3. Medical Nebulizer
- 10.1.4. Other
- 10.2. Market Analysis, Insights and Forecast - by Type
- 10.2.1. Ceramic Atomization Sheet
- 10.2.2. Microporous Atomization Sheet
- 10.1. Market Analysis, Insights and Forecast - by Application
- 11. Competitive Analysis
- 11.1. Global Market Share Analysis 2025
- 11.2. Company Profiles
- 11.2.1 AUDIOWELL
- 11.2.1.1. Overview
- 11.2.1.2. Products
- 11.2.1.3. SWOT Analysis
- 11.2.1.4. Recent Developments
- 11.2.1.5. Financials (Based on Availability)
- 11.2.2 Kailitech
- 11.2.2.1. Overview
- 11.2.2.2. Products
- 11.2.2.3. SWOT Analysis
- 11.2.2.4. Recent Developments
- 11.2.2.5. Financials (Based on Availability)
- 11.2.3 Keri Ultrasonic Electronics Co. Ltd
- 11.2.3.1. Overview
- 11.2.3.2. Products
- 11.2.3.3. SWOT Analysis
- 11.2.3.4. Recent Developments
- 11.2.3.5. Financials (Based on Availability)
- 11.2.4 DB Products Limited
- 11.2.4.1. Overview
- 11.2.4.2. Products
- 11.2.4.3. SWOT Analysis
- 11.2.4.4. Recent Developments
- 11.2.4.5. Financials (Based on Availability)
- 11.2.5 Siansonic Technology Limited
- 11.2.5.1. Overview
- 11.2.5.2. Products
- 11.2.5.3. SWOT Analysis
- 11.2.5.4. Recent Developments
- 11.2.5.5. Financials (Based on Availability)
- 11.2.6 Nanjing Hanzhou Technologie Co. LTD.
- 11.2.6.1. Overview
- 11.2.6.2. Products
- 11.2.6.3. SWOT Analysis
- 11.2.6.4. Recent Developments
- 11.2.6.5. Financials (Based on Availability)
- 11.2.7 HUNAN JIAYE DA ELECTRONIC CO.,LTD
- 11.2.7.1. Overview
- 11.2.7.2. Products
- 11.2.7.3. SWOT Analysis
- 11.2.7.4. Recent Developments
- 11.2.7.5. Financials (Based on Availability)
- 11.2.8 Dongguan Tiangong Laser Products Co. Ltd
- 11.2.8.1. Overview
- 11.2.8.2. Products
- 11.2.8.3. SWOT Analysis
- 11.2.8.4. Recent Developments
- 11.2.8.5. Financials (Based on Availability)
- 11.2.1 AUDIOWELL
List of Figures
- Figure 1: Global Atomization Sheet Revenue Breakdown (million, %) by Region 2025 & 2033
- Figure 2: Global Atomization Sheet Volume Breakdown (K, %) by Region 2025 & 2033
- Figure 3: North America Atomization Sheet Revenue (million), by Application 2025 & 2033
- Figure 4: North America Atomization Sheet Volume (K), by Application 2025 & 2033
- Figure 5: North America Atomization Sheet Revenue Share (%), by Application 2025 & 2033
- Figure 6: North America Atomization Sheet Volume Share (%), by Application 2025 & 2033
- Figure 7: North America Atomization Sheet Revenue (million), by Type 2025 & 2033
- Figure 8: North America Atomization Sheet Volume (K), by Type 2025 & 2033
- Figure 9: North America Atomization Sheet Revenue Share (%), by Type 2025 & 2033
- Figure 10: North America Atomization Sheet Volume Share (%), by Type 2025 & 2033
- Figure 11: North America Atomization Sheet Revenue (million), by Country 2025 & 2033
- Figure 12: North America Atomization Sheet Volume (K), by Country 2025 & 2033
- Figure 13: North America Atomization Sheet Revenue Share (%), by Country 2025 & 2033
- Figure 14: North America Atomization Sheet Volume Share (%), by Country 2025 & 2033
- Figure 15: South America Atomization Sheet Revenue (million), by Application 2025 & 2033
- Figure 16: South America Atomization Sheet Volume (K), by Application 2025 & 2033
- Figure 17: South America Atomization Sheet Revenue Share (%), by Application 2025 & 2033
- Figure 18: South America Atomization Sheet Volume Share (%), by Application 2025 & 2033
- Figure 19: South America Atomization Sheet Revenue (million), by Type 2025 & 2033
- Figure 20: South America Atomization Sheet Volume (K), by Type 2025 & 2033
- Figure 21: South America Atomization Sheet Revenue Share (%), by Type 2025 & 2033
- Figure 22: South America Atomization Sheet Volume Share (%), by Type 2025 & 2033
- Figure 23: South America Atomization Sheet Revenue (million), by Country 2025 & 2033
- Figure 24: South America Atomization Sheet Volume (K), by Country 2025 & 2033
- Figure 25: South America Atomization Sheet Revenue Share (%), by Country 2025 & 2033
- Figure 26: South America Atomization Sheet Volume Share (%), by Country 2025 & 2033
- Figure 27: Europe Atomization Sheet Revenue (million), by Application 2025 & 2033
- Figure 28: Europe Atomization Sheet Volume (K), by Application 2025 & 2033
- Figure 29: Europe Atomization Sheet Revenue Share (%), by Application 2025 & 2033
- Figure 30: Europe Atomization Sheet Volume Share (%), by Application 2025 & 2033
- Figure 31: Europe Atomization Sheet Revenue (million), by Type 2025 & 2033
- Figure 32: Europe Atomization Sheet Volume (K), by Type 2025 & 2033
- Figure 33: Europe Atomization Sheet Revenue Share (%), by Type 2025 & 2033
- Figure 34: Europe Atomization Sheet Volume Share (%), by Type 2025 & 2033
- Figure 35: Europe Atomization Sheet Revenue (million), by Country 2025 & 2033
- Figure 36: Europe Atomization Sheet Volume (K), by Country 2025 & 2033
- Figure 37: Europe Atomization Sheet Revenue Share (%), by Country 2025 & 2033
- Figure 38: Europe Atomization Sheet Volume Share (%), by Country 2025 & 2033
- Figure 39: Middle East & Africa Atomization Sheet Revenue (million), by Application 2025 & 2033
- Figure 40: Middle East & Africa Atomization Sheet Volume (K), by Application 2025 & 2033
- Figure 41: Middle East & Africa Atomization Sheet Revenue Share (%), by Application 2025 & 2033
- Figure 42: Middle East & Africa Atomization Sheet Volume Share (%), by Application 2025 & 2033
- Figure 43: Middle East & Africa Atomization Sheet Revenue (million), by Type 2025 & 2033
- Figure 44: Middle East & Africa Atomization Sheet Volume (K), by Type 2025 & 2033
- Figure 45: Middle East & Africa Atomization Sheet Revenue Share (%), by Type 2025 & 2033
- Figure 46: Middle East & Africa Atomization Sheet Volume Share (%), by Type 2025 & 2033
- Figure 47: Middle East & Africa Atomization Sheet Revenue (million), by Country 2025 & 2033
- Figure 48: Middle East & Africa Atomization Sheet Volume (K), by Country 2025 & 2033
- Figure 49: Middle East & Africa Atomization Sheet Revenue Share (%), by Country 2025 & 2033
- Figure 50: Middle East & Africa Atomization Sheet Volume Share (%), by Country 2025 & 2033
- Figure 51: Asia Pacific Atomization Sheet Revenue (million), by Application 2025 & 2033
- Figure 52: Asia Pacific Atomization Sheet Volume (K), by Application 2025 & 2033
- Figure 53: Asia Pacific Atomization Sheet Revenue Share (%), by Application 2025 & 2033
- Figure 54: Asia Pacific Atomization Sheet Volume Share (%), by Application 2025 & 2033
- Figure 55: Asia Pacific Atomization Sheet Revenue (million), by Type 2025 & 2033
- Figure 56: Asia Pacific Atomization Sheet Volume (K), by Type 2025 & 2033
- Figure 57: Asia Pacific Atomization Sheet Revenue Share (%), by Type 2025 & 2033
- Figure 58: Asia Pacific Atomization Sheet Volume Share (%), by Type 2025 & 2033
- Figure 59: Asia Pacific Atomization Sheet Revenue (million), by Country 2025 & 2033
- Figure 60: Asia Pacific Atomization Sheet Volume (K), by Country 2025 & 2033
- Figure 61: Asia Pacific Atomization Sheet Revenue Share (%), by Country 2025 & 2033
- Figure 62: Asia Pacific Atomization Sheet Volume Share (%), by Country 2025 & 2033
List of Tables
- Table 1: Global Atomization Sheet Revenue million Forecast, by Application 2020 & 2033
- Table 2: Global Atomization Sheet Volume K Forecast, by Application 2020 & 2033
- Table 3: Global Atomization Sheet Revenue million Forecast, by Type 2020 & 2033
- Table 4: Global Atomization Sheet Volume K Forecast, by Type 2020 & 2033
- Table 5: Global Atomization Sheet Revenue million Forecast, by Region 2020 & 2033
- Table 6: Global Atomization Sheet Volume K Forecast, by Region 2020 & 2033
- Table 7: Global Atomization Sheet Revenue million Forecast, by Application 2020 & 2033
- Table 8: Global Atomization Sheet Volume K Forecast, by Application 2020 & 2033
- Table 9: Global Atomization Sheet Revenue million Forecast, by Type 2020 & 2033
- Table 10: Global Atomization Sheet Volume K Forecast, by Type 2020 & 2033
- Table 11: Global Atomization Sheet Revenue million Forecast, by Country 2020 & 2033
- Table 12: Global Atomization Sheet Volume K Forecast, by Country 2020 & 2033
- Table 13: United States Atomization Sheet Revenue (million) Forecast, by Application 2020 & 2033
- Table 14: United States Atomization Sheet Volume (K) Forecast, by Application 2020 & 2033
- Table 15: Canada Atomization Sheet Revenue (million) Forecast, by Application 2020 & 2033
- Table 16: Canada Atomization Sheet Volume (K) Forecast, by Application 2020 & 2033
- Table 17: Mexico Atomization Sheet Revenue (million) Forecast, by Application 2020 & 2033
- Table 18: Mexico Atomization Sheet Volume (K) Forecast, by Application 2020 & 2033
- Table 19: Global Atomization Sheet Revenue million Forecast, by Application 2020 & 2033
- Table 20: Global Atomization Sheet Volume K Forecast, by Application 2020 & 2033
- Table 21: Global Atomization Sheet Revenue million Forecast, by Type 2020 & 2033
- Table 22: Global Atomization Sheet Volume K Forecast, by Type 2020 & 2033
- Table 23: Global Atomization Sheet Revenue million Forecast, by Country 2020 & 2033
- Table 24: Global Atomization Sheet Volume K Forecast, by Country 2020 & 2033
- Table 25: Brazil Atomization Sheet Revenue (million) Forecast, by Application 2020 & 2033
- Table 26: Brazil Atomization Sheet Volume (K) Forecast, by Application 2020 & 2033
- Table 27: Argentina Atomization Sheet Revenue (million) Forecast, by Application 2020 & 2033
- Table 28: Argentina Atomization Sheet Volume (K) Forecast, by Application 2020 & 2033
- Table 29: Rest of South America Atomization Sheet Revenue (million) Forecast, by Application 2020 & 2033
- Table 30: Rest of South America Atomization Sheet Volume (K) Forecast, by Application 2020 & 2033
- Table 31: Global Atomization Sheet Revenue million Forecast, by Application 2020 & 2033
- Table 32: Global Atomization Sheet Volume K Forecast, by Application 2020 & 2033
- Table 33: Global Atomization Sheet Revenue million Forecast, by Type 2020 & 2033
- Table 34: Global Atomization Sheet Volume K Forecast, by Type 2020 & 2033
- Table 35: Global Atomization Sheet Revenue million Forecast, by Country 2020 & 2033
- Table 36: Global Atomization Sheet Volume K Forecast, by Country 2020 & 2033
- Table 37: United Kingdom Atomization Sheet Revenue (million) Forecast, by Application 2020 & 2033
- Table 38: United Kingdom Atomization Sheet Volume (K) Forecast, by Application 2020 & 2033
- Table 39: Germany Atomization Sheet Revenue (million) Forecast, by Application 2020 & 2033
- Table 40: Germany Atomization Sheet Volume (K) Forecast, by Application 2020 & 2033
- Table 41: France Atomization Sheet Revenue (million) Forecast, by Application 2020 & 2033
- Table 42: France Atomization Sheet Volume (K) Forecast, by Application 2020 & 2033
- Table 43: Italy Atomization Sheet Revenue (million) Forecast, by Application 2020 & 2033
- Table 44: Italy Atomization Sheet Volume (K) Forecast, by Application 2020 & 2033
- Table 45: Spain Atomization Sheet Revenue (million) Forecast, by Application 2020 & 2033
- Table 46: Spain Atomization Sheet Volume (K) Forecast, by Application 2020 & 2033
- Table 47: Russia Atomization Sheet Revenue (million) Forecast, by Application 2020 & 2033
- Table 48: Russia Atomization Sheet Volume (K) Forecast, by Application 2020 & 2033
- Table 49: Benelux Atomization Sheet Revenue (million) Forecast, by Application 2020 & 2033
- Table 50: Benelux Atomization Sheet Volume (K) Forecast, by Application 2020 & 2033
- Table 51: Nordics Atomization Sheet Revenue (million) Forecast, by Application 2020 & 2033
- Table 52: Nordics Atomization Sheet Volume (K) Forecast, by Application 2020 & 2033
- Table 53: Rest of Europe Atomization Sheet Revenue (million) Forecast, by Application 2020 & 2033
- Table 54: Rest of Europe Atomization Sheet Volume (K) Forecast, by Application 2020 & 2033
- Table 55: Global Atomization Sheet Revenue million Forecast, by Application 2020 & 2033
- Table 56: Global Atomization Sheet Volume K Forecast, by Application 2020 & 2033
- Table 57: Global Atomization Sheet Revenue million Forecast, by Type 2020 & 2033
- Table 58: Global Atomization Sheet Volume K Forecast, by Type 2020 & 2033
- Table 59: Global Atomization Sheet Revenue million Forecast, by Country 2020 & 2033
- Table 60: Global Atomization Sheet Volume K Forecast, by Country 2020 & 2033
- Table 61: Turkey Atomization Sheet Revenue (million) Forecast, by Application 2020 & 2033
- Table 62: Turkey Atomization Sheet Volume (K) Forecast, by Application 2020 & 2033
- Table 63: Israel Atomization Sheet Revenue (million) Forecast, by Application 2020 & 2033
- Table 64: Israel Atomization Sheet Volume (K) Forecast, by Application 2020 & 2033
- Table 65: GCC Atomization Sheet Revenue (million) Forecast, by Application 2020 & 2033
- Table 66: GCC Atomization Sheet Volume (K) Forecast, by Application 2020 & 2033
- Table 67: North Africa Atomization Sheet Revenue (million) Forecast, by Application 2020 & 2033
- Table 68: North Africa Atomization Sheet Volume (K) Forecast, by Application 2020 & 2033
- Table 69: South Africa Atomization Sheet Revenue (million) Forecast, by Application 2020 & 2033
- Table 70: South Africa Atomization Sheet Volume (K) Forecast, by Application 2020 & 2033
- Table 71: Rest of Middle East & Africa Atomization Sheet Revenue (million) Forecast, by Application 2020 & 2033
- Table 72: Rest of Middle East & Africa Atomization Sheet Volume (K) Forecast, by Application 2020 & 2033
- Table 73: Global Atomization Sheet Revenue million Forecast, by Application 2020 & 2033
- Table 74: Global Atomization Sheet Volume K Forecast, by Application 2020 & 2033
- Table 75: Global Atomization Sheet Revenue million Forecast, by Type 2020 & 2033
- Table 76: Global Atomization Sheet Volume K Forecast, by Type 2020 & 2033
- Table 77: Global Atomization Sheet Revenue million Forecast, by Country 2020 & 2033
- Table 78: Global Atomization Sheet Volume K Forecast, by Country 2020 & 2033
- Table 79: China Atomization Sheet Revenue (million) Forecast, by Application 2020 & 2033
- Table 80: China Atomization Sheet Volume (K) Forecast, by Application 2020 & 2033
- Table 81: India Atomization Sheet Revenue (million) Forecast, by Application 2020 & 2033
- Table 82: India Atomization Sheet Volume (K) Forecast, by Application 2020 & 2033
- Table 83: Japan Atomization Sheet Revenue (million) Forecast, by Application 2020 & 2033
- Table 84: Japan Atomization Sheet Volume (K) Forecast, by Application 2020 & 2033
- Table 85: South Korea Atomization Sheet Revenue (million) Forecast, by Application 2020 & 2033
- Table 86: South Korea Atomization Sheet Volume (K) Forecast, by Application 2020 & 2033
- Table 87: ASEAN Atomization Sheet Revenue (million) Forecast, by Application 2020 & 2033
- Table 88: ASEAN Atomization Sheet Volume (K) Forecast, by Application 2020 & 2033
- Table 89: Oceania Atomization Sheet Revenue (million) Forecast, by Application 2020 & 2033
- Table 90: Oceania Atomization Sheet Volume (K) Forecast, by Application 2020 & 2033
- Table 91: Rest of Asia Pacific Atomization Sheet Revenue (million) Forecast, by Application 2020 & 2033
- Table 92: Rest of Asia Pacific Atomization Sheet Volume (K) Forecast, by Application 2020 & 2033
Frequently Asked Questions
1. What is the projected Compound Annual Growth Rate (CAGR) of the Atomization Sheet?
The projected CAGR is approximately 3.8%.
2. Which companies are prominent players in the Atomization Sheet?
Key companies in the market include AUDIOWELL, Kailitech, Keri Ultrasonic Electronics Co., Ltd, DB Products Limited, Siansonic Technology Limited, Nanjing Hanzhou Technologie Co., LTD., HUNAN JIAYE DA ELECTRONIC CO.,LTD, Dongguan Tiangong Laser Products Co., Ltd.
3. What are the main segments of the Atomization Sheet?
The market segments include Application, Type.
4. Can you provide details about the market size?
The market size is estimated to be USD 130 million as of 2022.
5. What are some drivers contributing to market growth?
N/A
6. What are the notable trends driving market growth?
N/A
7. Are there any restraints impacting market growth?
N/A
8. Can you provide examples of recent developments in the market?
N/A
9. What pricing options are available for accessing the report?
Pricing options include single-user, multi-user, and enterprise licenses priced at USD 3950.00, USD 5925.00, and USD 7900.00 respectively.
10. Is the market size provided in terms of value or volume?
The market size is provided in terms of value, measured in million and volume, measured in K.
11. Are there any specific market keywords associated with the report?
Yes, the market keyword associated with the report is "Atomization Sheet," which aids in identifying and referencing the specific market segment covered.
12. How do I determine which pricing option suits my needs best?
The pricing options vary based on user requirements and access needs. Individual users may opt for single-user licenses, while businesses requiring broader access may choose multi-user or enterprise licenses for cost-effective access to the report.
13. Are there any additional resources or data provided in the Atomization Sheet report?
While the report offers comprehensive insights, it's advisable to review the specific contents or supplementary materials provided to ascertain if additional resources or data are available.
14. How can I stay updated on further developments or reports in the Atomization Sheet?
To stay informed about further developments, trends, and reports in the Atomization Sheet, consider subscribing to industry newsletters, following relevant companies and organizations, or regularly checking reputable industry news sources and publications.
Methodology
Step 1 - Identification of Relevant Samples Size from Population Database


Step 2 - Approaches for Defining Global Market Size (Value, Volume* & Price*)

Note*: In applicable scenarios
Step 3 - Data Sources
Primary Research
- Web Analytics
- Survey Reports
- Research Institute
- Latest Research Reports
- Opinion Leaders
Secondary Research
- Annual Reports
- White Paper
- Latest Press Release
- Industry Association
- Paid Database
- Investor Presentations

Step 4 - Data Triangulation
Involves using different sources of information in order to increase the validity of a study
These sources are likely to be stakeholders in a program - participants, other researchers, program staff, other community members, and so on.
Then we put all data in single framework & apply various statistical tools to find out the dynamic on the market.
During the analysis stage, feedback from the stakeholder groups would be compared to determine areas of agreement as well as areas of divergence

