


Key Insights
The Asia-Pacific non-lethal weapons market is poised for significant expansion, driven by escalating demand from regional law enforcement and military sectors. Key growth catalysts include heightened concerns regarding civil unrest, terrorism, and the necessity for casualty-minimizing crowd control solutions. Technological advancements in directed energy weapons, electroshock weapons, and less-lethal ammunition are further propelling market growth. Government initiatives advocating for the adoption of non-lethal technologies in peacekeeping and security operations also contribute to market expansion. Despite a fragmented landscape, major stakeholders such as Rheinmetall AG, Axon (Taser International Inc.), and RUAG Group are actively involved in developing and supplying advanced non-lethal weapon systems. The substantial presence of defense manufacturers and an intensifying focus on internal security in nations like China, India, and Japan are pivotal growth drivers. The market is projected to witness a Compound Annual Growth Rate (CAGR) of over 5%, indicating substantial expansion through the forecast period (2025-2033). Market segmentation includes area denial systems, ammunition, explosives, gases and sprays, directed energy weapons, and electroshock weapons, highlighting the diverse range of technologies employed for non-lethal applications. The robust presence of key industry players in the region ensures continuous innovation and market competitiveness.

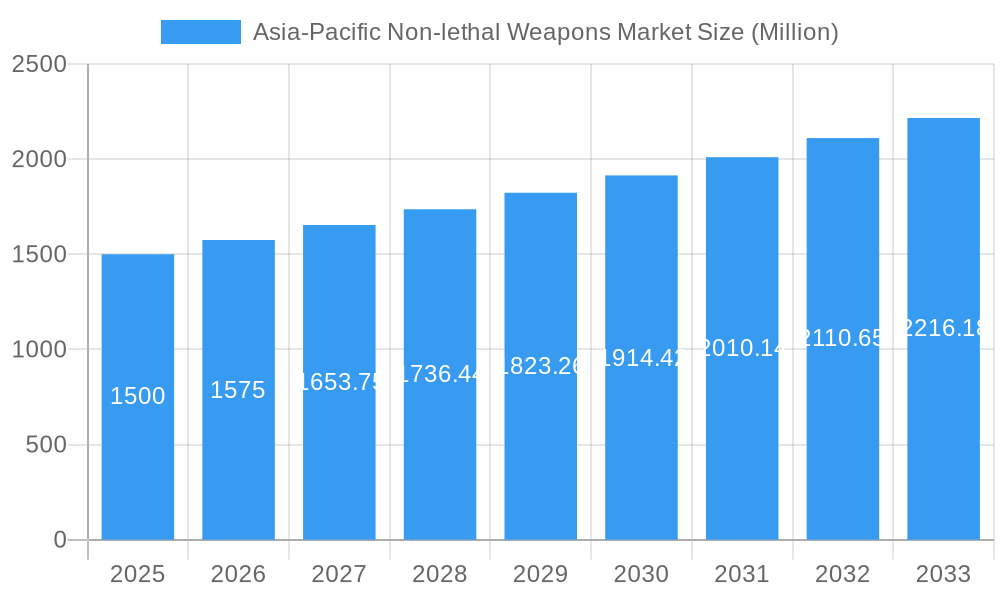
Asia-Pacific Non-lethal Weapons Market Market Size (In Billion)

Growth trajectories will vary across specific segments. Directed energy weapons (e.g., less-lethal lasers) and electroshock weapons are anticipated to experience accelerated growth due to their efficacy and precision compared to conventional methods. Conversely, the market for gases and sprays may encounter regulatory challenges and limitations, potentially resulting in moderated growth. The diverse regulatory frameworks across the Asia-Pacific region will influence growth rates at the national level, with countries prioritizing internal security likely exhibiting higher adoption rates. Consequently, while overall market expansion is steady, granular analysis is essential for understanding nuanced growth dynamics within each segment and nation. Continuous research and development initiatives are expected to further refine the market, introducing more sophisticated and effective non-lethal weaponry in the future.
Asia-Pacific Non-lethal Weapons Market Company Market Share
Asia-Pacific Non-lethal Weapons Market: A Comprehensive Market Report (2019-2033)
This comprehensive report provides an in-depth analysis of the Asia-Pacific Non-lethal Weapons market, offering invaluable insights for industry professionals, investors, and strategic decision-makers. With a focus on market dynamics, growth trends, and key players, this report covers the period from 2019 to 2033, providing a robust understanding of the current landscape and future projections. The report includes a detailed examination of parent markets (Non-lethal Weapons) and child markets (Area Denial systems, Ammunition, etc.) within the Asia-Pacific region. The market size is valued in Million units.
Asia-Pacific Non-lethal Weapons Market Dynamics & Structure
This section analyzes the competitive landscape of the Asia-Pacific non-lethal weapons market, examining market concentration, technological innovation, regulatory frameworks, and key market trends. The study period spans from 2019 to 2033, with 2025 serving as the base year and estimated year. The forecast period is 2025-2033, and the historical period is 2019-2024.
Market Concentration: The Asia-Pacific non-lethal weapons market exhibits a moderately concentrated structure, with a few dominant players and several smaller niche players. Market share analysis reveals that the top five players account for approximately xx% of the total market revenue in 2025.
Technological Innovation: Technological advancements in directed energy weapons, electroshock weapons, and less-lethal ammunition are key drivers of market growth. Innovation is fostering the development of more precise, effective, and safer non-lethal weapons. However, high R&D costs and regulatory hurdles pose significant barriers to entry for new players.
Regulatory Frameworks: Varying regulatory frameworks across different countries in the Asia-Pacific region significantly influence market dynamics. Stringent regulations in some countries limit the adoption of certain non-lethal weapons, while more lenient regulations in others foster market expansion.
Competitive Product Substitutes: The market faces competition from conventional lethal weapons in specific applications. The ongoing development of more sophisticated non-lethal alternatives is crucial for market growth.
End-User Demographics: The primary end-users are law enforcement agencies, military forces, and private security firms. Growing concerns over civil unrest and terrorist threats are boosting demand for non-lethal weapons.
M&A Trends: The Asia-Pacific non-lethal weapons market has witnessed a moderate number of mergers and acquisitions (M&As) in recent years. The total volume of M&A deals between 2019 and 2024 was approximately xx, driven primarily by strategic expansion and technology acquisition.
Asia-Pacific Non-lethal Weapons Market Growth Trends & Insights
The Asia-Pacific non-lethal weapons market is experiencing substantial growth, driven by increasing demand from law enforcement and military sectors. The market size is projected to reach xx million units by 2033, exhibiting a CAGR of xx% during the forecast period (2025-2033). This growth is attributed to several factors, including rising geopolitical instability, increasing urbanization leading to higher instances of civil unrest, and the growing adoption of advanced non-lethal technologies. Market penetration is expected to increase significantly in several key countries within the region. Technological disruptions, such as the development of more precise and effective directed energy weapons, are further accelerating market expansion. Shifting consumer behavior towards advanced security solutions and growing awareness of the need for less-lethal crowd control methods are also contributing factors. The market analysis considers various factors influencing adoption rates, including government policies, budgetary allocations, and technological advancements. The report further analyzes the impact of socio-economic factors and regional disparities on market growth patterns.
Dominant Regions, Countries, or Segments in Asia-Pacific Non-lethal Weapons Market
The Asia-Pacific non-lethal weapons market demonstrates varied growth across different regions and segments. While a specific country or region cannot be definitively declared as the most dominant without specific data, countries with higher defense budgets and instances of civil unrest generally show higher demand. Japan, South Korea, and Australia are significant consumers due to their advanced security systems and strong defense capabilities. India's growing military modernization programs significantly impact its market share. Southeast Asian nations show a considerable demand driven by various internal security concerns.
By Type: The area denial systems segment holds a significant market share, followed by ammunition and gases and sprays. The directed energy weapons segment is expected to witness the fastest growth due to technological advancements. Electroshock weapons also maintain a stable market share due to their widespread use in law enforcement.
By Application: The law enforcement segment dominates the market, driven by the increasing need for effective crowd control and riot management solutions. The military segment also contributes significantly, with demand for non-lethal weapons used in peacekeeping operations and counter-terrorism efforts.
Key Drivers: Factors driving market dominance include increasing government spending on security, growing concerns about internal security and terrorism, and escalating urbanization.
Growth Potential: Countries with rapidly developing economies and rising urbanization are expected to show significant growth potential. Government initiatives promoting the adoption of non-lethal technologies further enhance the market's growth trajectory.
Asia-Pacific Non-lethal Weapons Market Product Landscape
The Asia-Pacific non-lethal weapons market showcases a diverse range of products, including area denial systems (e.g., acoustic hailing devices, water cannons), various types of less-lethal ammunition (e.g., rubber bullets, beanbag rounds), explosives (e.g., flashbang grenades), gases and sprays (e.g., pepper spray, tear gas), directed energy weapons (e.g., lasers, acoustic devices), and electroshock weapons (e.g., tasers). Technological advancements are focused on enhancing the precision, effectiveness, and safety of these weapons. Unique selling propositions often revolve around improved accuracy, reduced collateral damage, and ease of use.
Key Drivers, Barriers & Challenges in Asia-Pacific Non-lethal Weapons Market
Key Drivers: Rising instances of civil unrest and terrorism, increasing government spending on internal security, and technological advancements are driving market growth. Demand for non-lethal solutions is increasing as governments seek to minimize civilian casualties while effectively managing security threats.
Key Challenges & Restraints: Stringent regulatory approvals for new technologies, high R&D costs, and supply chain disruptions pose significant challenges. The lack of standardization across different countries further complicates market penetration. Moreover, ethical concerns surrounding the use of some non-lethal weapons and potential for misuse limit market expansion.
Emerging Opportunities in Asia-Pacific Non-lethal Weapons Market
Untapped markets in less-developed countries with rapidly growing populations present significant growth opportunities. Innovative applications such as advanced crowd control technologies and specialized non-lethal systems for specific threats represent emerging trends. Growing consumer preferences towards less-lethal and more precise security solutions are further opening up new market avenues.
Growth Accelerators in the Asia-Pacific Non-lethal Weapons Market Industry
Technological breakthroughs in directed energy weapons and other non-lethal technologies are significantly accelerating market growth. Strategic partnerships between government agencies and private companies are fostering innovation and market expansion. Government initiatives promoting the adoption of non-lethal solutions in law enforcement and military operations further boost market growth.
Key Players Shaping the Asia-Pacific Non-lethal Weapons Market Market
- Rheinmetall AG
- Lamperd Inc
- Zarc International
- RUAG Group
- Genasys Inc
- AMTEC Less-Lethal Systems Inc (PACEM Defense LLC, Condor Non-lethal Technologies)
- Axon (Taser International Inc)
Notable Milestones in Asia-Pacific Non-lethal Weapons Market Sector
November 2022: China donated two water cannon trucks to the Royal Solomon Islands Police Force (RSIPF), strengthening its role as a security partner and showcasing the application of non-lethal area denial systems.
January 2023: Reports indicate China's provision of non-lethal military aid to Russia, highlighting the geopolitical significance of the non-lethal weapons market and its potential implications for global security dynamics.
In-Depth Asia-Pacific Non-lethal Weapons Market Outlook
The Asia-Pacific non-lethal weapons market is poised for sustained growth driven by continuous technological advancements, increasing security concerns, and strategic investments from governments and private entities. This presents significant opportunities for established players to expand their market share and for new entrants to establish a presence. Strategic partnerships, focusing on R&D and regional expansion, will be crucial for success in this dynamic market. The continued development of safer and more effective non-lethal weapons will play a key role in shaping the future of this market.
Asia-Pacific Non-lethal Weapons Market Segmentation
-
1. Type
- 1.1. Area Denial
- 1.2. Ammunition
- 1.3. Explosives
- 1.4. Gases and Sprays
- 1.5. Directed Energy Weapons
- 1.6. Electroshock Weapons
-
2. Application
- 2.1. Law Enforcement
- 2.2. Military
-
3. Geography
-
3.1. Asia-Pacific
- 3.1.1. India
- 3.1.2. China
- 3.1.3. South Korea
- 3.1.4. Australia
- 3.1.5. Japan
- 3.1.6. Rest of Asia-Pacific
-
3.1. Asia-Pacific
Asia-Pacific Non-lethal Weapons Market Segmentation By Geography
-
1. Asia Pacific
- 1.1. India
- 1.2. China
- 1.3. South Korea
- 1.4. Australia
- 1.5. Japan
- 1.6. Rest of Asia Pacific

Asia-Pacific Non-lethal Weapons Market Regional Market Share
Geographic Coverage of Asia-Pacific Non-lethal Weapons Market
Asia-Pacific Non-lethal Weapons Market REPORT HIGHLIGHTS
| Aspects | Details |
|---|---|
| Study Period | 2020-2034 |
| Base Year | 2025 |
| Estimated Year | 2026 |
| Forecast Period | 2026-2034 |
| Historical Period | 2020-2025 |
| Growth Rate | CAGR of 5% from 2020-2034 |
| Segmentation |
|
Table of Contents
- 1. Introduction
- 1.1. Research Scope
- 1.2. Market Segmentation
- 1.3. Research Methodology
- 1.4. Definitions and Assumptions
- 2. Executive Summary
- 2.1. Introduction
- 3. Market Dynamics
- 3.1. Introduction
- 3.2. Market Drivers
- 3.3. Market Restrains
- 3.4. Market Trends
- 3.4.1. Ammunition Segment is Projected to Grow at a High Pace
- 4. Market Factor Analysis
- 4.1. Porters Five Forces
- 4.2. Supply/Value Chain
- 4.3. PESTEL analysis
- 4.4. Market Entropy
- 4.5. Patent/Trademark Analysis
- 5. Asia-Pacific Non-lethal Weapons Market Analysis, Insights and Forecast, 2020-2032
- 5.1. Market Analysis, Insights and Forecast - by Type
- 5.1.1. Area Denial
- 5.1.2. Ammunition
- 5.1.3. Explosives
- 5.1.4. Gases and Sprays
- 5.1.5. Directed Energy Weapons
- 5.1.6. Electroshock Weapons
- 5.2. Market Analysis, Insights and Forecast - by Application
- 5.2.1. Law Enforcement
- 5.2.2. Military
- 5.3. Market Analysis, Insights and Forecast - by Geography
- 5.3.1. Asia-Pacific
- 5.3.1.1. India
- 5.3.1.2. China
- 5.3.1.3. South Korea
- 5.3.1.4. Australia
- 5.3.1.5. Japan
- 5.3.1.6. Rest of Asia-Pacific
- 5.3.1. Asia-Pacific
- 5.4. Market Analysis, Insights and Forecast - by Region
- 5.4.1. Asia Pacific
- 5.1. Market Analysis, Insights and Forecast - by Type
- 6. Competitive Analysis
- 6.1. Market Share Analysis 2025
- 6.2. Company Profiles
- 6.2.1 Rheinmetall AG
- 6.2.1.1. Overview
- 6.2.1.2. Products
- 6.2.1.3. SWOT Analysis
- 6.2.1.4. Recent Developments
- 6.2.1.5. Financials (Based on Availability)
- 6.2.2 Lamperd Inc
- 6.2.2.1. Overview
- 6.2.2.2. Products
- 6.2.2.3. SWOT Analysis
- 6.2.2.4. Recent Developments
- 6.2.2.5. Financials (Based on Availability)
- 6.2.3 Zarc International
- 6.2.3.1. Overview
- 6.2.3.2. Products
- 6.2.3.3. SWOT Analysis
- 6.2.3.4. Recent Developments
- 6.2.3.5. Financials (Based on Availability)
- 6.2.4 RUAG Group
- 6.2.4.1. Overview
- 6.2.4.2. Products
- 6.2.4.3. SWOT Analysis
- 6.2.4.4. Recent Developments
- 6.2.4.5. Financials (Based on Availability)
- 6.2.5 Genasys Inc
- 6.2.5.1. Overview
- 6.2.5.2. Products
- 6.2.5.3. SWOT Analysis
- 6.2.5.4. Recent Developments
- 6.2.5.5. Financials (Based on Availability)
- 6.2.6 AMTEC Less-Lethal Systems Inc (PACEM Defense LLC
- 6.2.6.1. Overview
- 6.2.6.2. Products
- 6.2.6.3. SWOT Analysis
- 6.2.6.4. Recent Developments
- 6.2.6.5. Financials (Based on Availability)
- 6.2.7 Condor Non-lethal Technologies
- 6.2.7.1. Overview
- 6.2.7.2. Products
- 6.2.7.3. SWOT Analysis
- 6.2.7.4. Recent Developments
- 6.2.7.5. Financials (Based on Availability)
- 6.2.8 Axon (Taser International Inc )
- 6.2.8.1. Overview
- 6.2.8.2. Products
- 6.2.8.3. SWOT Analysis
- 6.2.8.4. Recent Developments
- 6.2.8.5. Financials (Based on Availability)
- 6.2.1 Rheinmetall AG
List of Figures
- Figure 1: Asia-Pacific Non-lethal Weapons Market Revenue Breakdown (billion, %) by Product 2025 & 2033
- Figure 2: Asia-Pacific Non-lethal Weapons Market Share (%) by Company 2025
List of Tables
- Table 1: Asia-Pacific Non-lethal Weapons Market Revenue billion Forecast, by Type 2020 & 2033
- Table 2: Asia-Pacific Non-lethal Weapons Market Revenue billion Forecast, by Application 2020 & 2033
- Table 3: Asia-Pacific Non-lethal Weapons Market Revenue billion Forecast, by Geography 2020 & 2033
- Table 4: Asia-Pacific Non-lethal Weapons Market Revenue billion Forecast, by Region 2020 & 2033
- Table 5: Asia-Pacific Non-lethal Weapons Market Revenue billion Forecast, by Type 2020 & 2033
- Table 6: Asia-Pacific Non-lethal Weapons Market Revenue billion Forecast, by Application 2020 & 2033
- Table 7: Asia-Pacific Non-lethal Weapons Market Revenue billion Forecast, by Geography 2020 & 2033
- Table 8: Asia-Pacific Non-lethal Weapons Market Revenue billion Forecast, by Country 2020 & 2033
- Table 9: India Asia-Pacific Non-lethal Weapons Market Revenue (billion) Forecast, by Application 2020 & 2033
- Table 10: China Asia-Pacific Non-lethal Weapons Market Revenue (billion) Forecast, by Application 2020 & 2033
- Table 11: South Korea Asia-Pacific Non-lethal Weapons Market Revenue (billion) Forecast, by Application 2020 & 2033
- Table 12: Australia Asia-Pacific Non-lethal Weapons Market Revenue (billion) Forecast, by Application 2020 & 2033
- Table 13: Japan Asia-Pacific Non-lethal Weapons Market Revenue (billion) Forecast, by Application 2020 & 2033
- Table 14: Rest of Asia Pacific Asia-Pacific Non-lethal Weapons Market Revenue (billion) Forecast, by Application 2020 & 2033
Frequently Asked Questions
1. What is the projected Compound Annual Growth Rate (CAGR) of the Asia-Pacific Non-lethal Weapons Market?
The projected CAGR is approximately 5%.
2. Which companies are prominent players in the Asia-Pacific Non-lethal Weapons Market?
Key companies in the market include Rheinmetall AG, Lamperd Inc, Zarc International, RUAG Group, Genasys Inc, AMTEC Less-Lethal Systems Inc (PACEM Defense LLC, Condor Non-lethal Technologies, Axon (Taser International Inc ).
3. What are the main segments of the Asia-Pacific Non-lethal Weapons Market?
The market segments include Type, Application, Geography.
4. Can you provide details about the market size?
The market size is estimated to be USD 4.4 billion as of 2022.
5. What are some drivers contributing to market growth?
N/A
6. What are the notable trends driving market growth?
Ammunition Segment is Projected to Grow at a High Pace.
7. Are there any restraints impacting market growth?
N/A
8. Can you provide examples of recent developments in the market?
January 2023: China is providing non-lethal military aid to Russia for Moscow's use in Ukraine. A top-secret intelligence summary stated that Beijing had approved the incremental provision of weapons to Moscow,
9. What pricing options are available for accessing the report?
Pricing options include single-user, multi-user, and enterprise licenses priced at USD 4750, USD 5250, and USD 8750 respectively.
10. Is the market size provided in terms of value or volume?
The market size is provided in terms of value, measured in billion.
11. Are there any specific market keywords associated with the report?
Yes, the market keyword associated with the report is "Asia-Pacific Non-lethal Weapons Market," which aids in identifying and referencing the specific market segment covered.
12. How do I determine which pricing option suits my needs best?
The pricing options vary based on user requirements and access needs. Individual users may opt for single-user licenses, while businesses requiring broader access may choose multi-user or enterprise licenses for cost-effective access to the report.
13. Are there any additional resources or data provided in the Asia-Pacific Non-lethal Weapons Market report?
While the report offers comprehensive insights, it's advisable to review the specific contents or supplementary materials provided to ascertain if additional resources or data are available.
14. How can I stay updated on further developments or reports in the Asia-Pacific Non-lethal Weapons Market?
To stay informed about further developments, trends, and reports in the Asia-Pacific Non-lethal Weapons Market, consider subscribing to industry newsletters, following relevant companies and organizations, or regularly checking reputable industry news sources and publications.
Methodology
Step 1 - Identification of Relevant Samples Size from Population Database


Step 2 - Approaches for Defining Global Market Size (Value, Volume* & Price*)

Note*: In applicable scenarios
Step 3 - Data Sources
Primary Research
- Web Analytics
- Survey Reports
- Research Institute
- Latest Research Reports
- Opinion Leaders
Secondary Research
- Annual Reports
- White Paper
- Latest Press Release
- Industry Association
- Paid Database
- Investor Presentations

Step 4 - Data Triangulation
Involves using different sources of information in order to increase the validity of a study
These sources are likely to be stakeholders in a program - participants, other researchers, program staff, other community members, and so on.
Then we put all data in single framework & apply various statistical tools to find out the dynamic on the market.
During the analysis stage, feedback from the stakeholder groups would be compared to determine areas of agreement as well as areas of divergence