

Key Insights
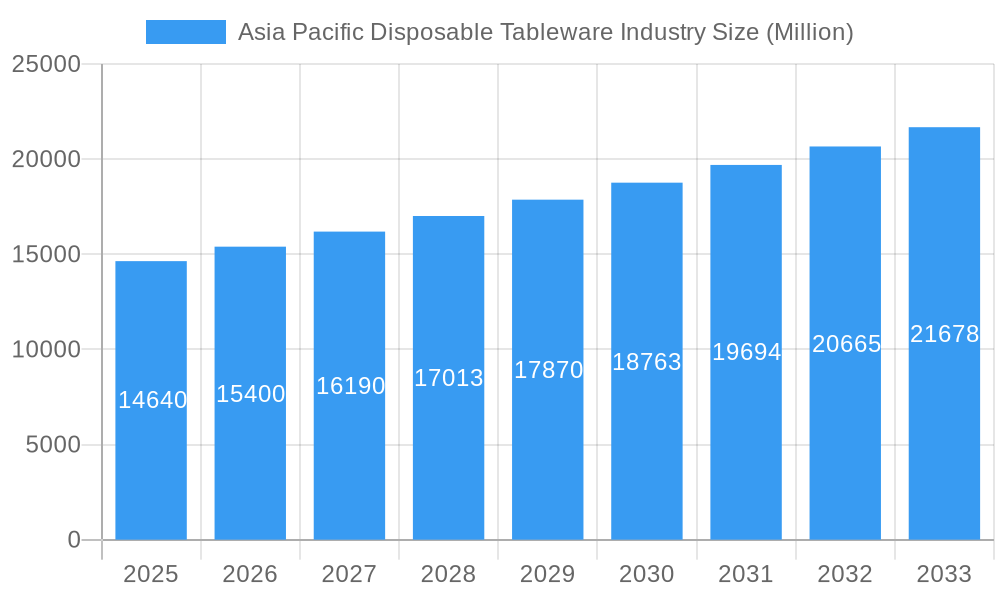
The Asia Pacific disposable tableware market, valued at $14.64 billion in 2025, is projected to experience robust growth, driven by several key factors. The rising popularity of takeaway and delivery food services, fueled by busy lifestyles and increasing urbanization across the region, significantly boosts demand for convenient disposable tableware. Furthermore, the burgeoning tourism and hospitality sectors in countries like China, Japan, and India contribute substantially to market expansion. Convenience stores and online retail channels are witnessing significant growth in sales, reflecting changing consumer preferences. While environmental concerns related to plastic waste pose a restraint, the increasing availability of biodegradable and eco-friendly alternatives is mitigating this challenge and creating new market segments. Product innovation, including the introduction of more aesthetically pleasing and functional designs, is further driving market expansion. The market is segmented by product type (disposable cups, plates, bowls, silverware, and others), application (residential and commercial), and distribution channel (hypermarkets, convenience stores, online, and others). China, Japan, and India represent the largest national markets within the Asia-Pacific region, accounting for a significant portion of the overall market value. The consistent CAGR of 5.12% indicates a steady and predictable growth trajectory over the forecast period (2025-2033). This consistent growth is expected to continue, driven by sustained economic development and evolving consumer habits within the Asia-Pacific region.
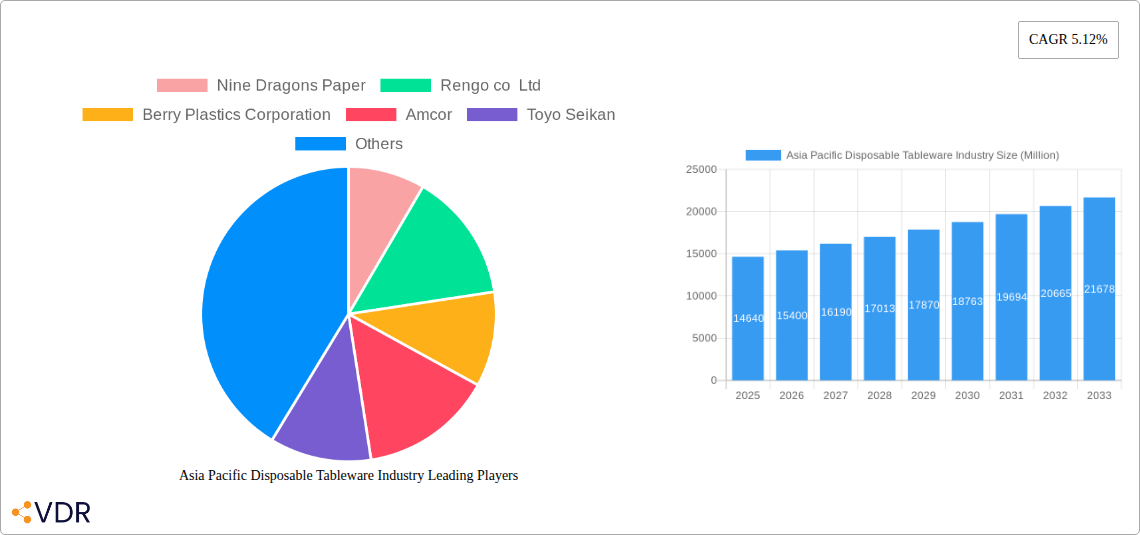
Asia Pacific Disposable Tableware Industry Market Size (In Billion)
The competitive landscape is characterized by a mix of both large multinational corporations and regional players. Key players, including Nine Dragons Paper, Rengo Co. Ltd., Berry Plastics Corporation, and Amcor, compete based on product quality, pricing strategies, and distribution networks. The market’s future growth will hinge on the continued adoption of sustainable and eco-friendly materials, innovative product designs that meet evolving consumer demands, and effective supply chain management to address the challenges posed by raw material costs and fluctuating energy prices. Expansion into new markets within the Asia-Pacific region, particularly in developing economies, represents a significant opportunity for growth. Strategic partnerships and collaborations are likely to play a crucial role in driving market penetration and broadening product portfolios.
Asia Pacific Disposable Tableware Industry Company Market Share
Asia Pacific Disposable Tableware Industry: Market Report 2019-2033
This comprehensive report provides an in-depth analysis of the Asia Pacific disposable tableware market, covering historical data (2019-2024), the base year (2025), and a detailed forecast (2025-2033). The report segments the market by product type (disposable cups, plates, bowls, silverware, others), application (residential, commercial), and distribution channel (hypermarkets/supermarkets, convenience stores, online, others). It provides crucial insights for industry professionals, investors, and strategic decision-makers seeking to understand this dynamic market. The report features analysis of key players like Nine Dragons Paper, Rengo Co. Ltd, Berry Plastics Corporation, Amcor, Toyo Seikan, Nippon Paper, Mondi Group, Guangdong Huasheng Meto, Oji Holdings, Sonoco Products, Taizhou Fuling Plastics (list not exhaustive), and offers valuable information for navigating the complexities of this rapidly evolving sector. The total market size is projected to reach xx Million units by 2033.
Asia Pacific Disposable Tableware Industry Market Dynamics & Structure
The Asia Pacific disposable tableware market exhibits a moderately consolidated structure, with several large multinational corporations and regional players vying for market share. Technological innovation, primarily focused on sustainable and biodegradable materials, is a key driver, while regulatory frameworks concerning plastic waste are significantly shaping industry practices. The market faces competition from reusable tableware, but the convenience and affordability of disposables maintain significant demand. Consumer demographics, particularly in rapidly urbanizing regions, significantly influence consumption patterns. Mergers and acquisitions (M&A) activity has been moderate, with strategic acquisitions aimed at expanding geographical reach and product portfolios.
- Market Concentration: Moderately consolidated, with a top 5 market share of approximately xx%.
- Technological Innovation: Focus on biodegradable materials, improved designs, and automation in manufacturing.
- Regulatory Framework: Increasingly stringent regulations on plastic waste are driving innovation in sustainable materials.
- Competitive Substitutes: Reusable tableware poses a competitive threat, particularly in environmentally conscious segments.
- End-User Demographics: Rapid urbanization and rising disposable incomes fuel market growth in key regions.
- M&A Trends: Strategic acquisitions primarily focus on market expansion and product diversification; xx M&A deals recorded in the last 5 years.
Asia Pacific Disposable Tableware Industry Growth Trends & Insights
The Asia Pacific disposable tableware market experienced significant growth between 2019 and 2024, driven by factors like increasing disposable incomes, changing lifestyles, and the rapid expansion of the food service industry. Technological advancements, including the introduction of eco-friendly materials, are shaping consumer preferences. The market is witnessing a shift towards online distribution channels, which is further accelerated by the growth of e-commerce platforms. Specific growth metrics for the period show a CAGR of xx% between 2019 and 2024, with market penetration exceeding xx% in key urban areas. The forecast period (2025-2033) projects continued growth, driven by factors such as rising tourism and increased disposable income in emerging economies. Consumer behavior is moving towards more sustainable choices impacting product development and marketing strategies.
Dominant Regions, Countries, or Segments in Asia Pacific Disposable Tableware Industry
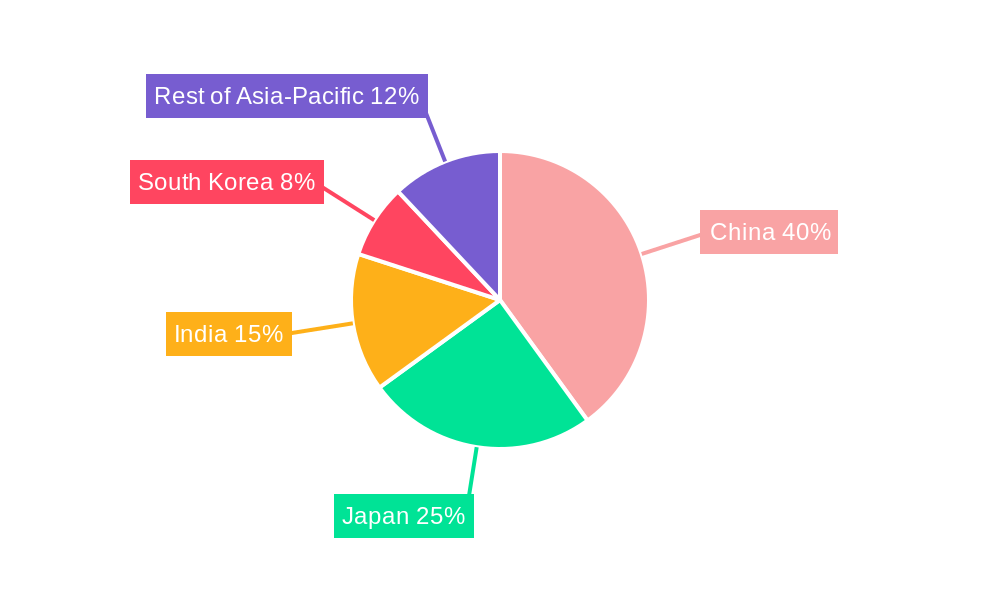
China and India are the dominant markets in the Asia Pacific disposable tableware industry, accounting for approximately xx% of the total market share. Within product segments, disposable cups and plates lead in terms of volume, driven by widespread use in both residential and commercial applications. The commercial segment exhibits higher growth potential due to the expansion of the food service and quick-service restaurant industries. Online distribution is rapidly gaining traction, especially in urban areas with high internet penetration.
- Key Drivers: Rapid urbanization, increasing disposable incomes, growth of food service industry, and expanding e-commerce platforms.
- Dominance Factors: Large populations, high consumption rates, and robust economic growth in key regions.
- Growth Potential: Significant potential remains in emerging markets and underserved segments like rural areas.
Asia Pacific Disposable Tableware Industry Product Landscape
The product landscape is characterized by a diverse range of materials, including traditional plastics, paper, and increasingly, biodegradable and compostable options. Innovation focuses on enhanced aesthetics, improved functionality (e.g., leak-proof cups), and environmentally friendly attributes. Premiumization is evident with the introduction of higher-quality, more durable products targeting specific consumer segments. The focus on sustainability is driving the development of plant-based materials and compostable options, shaping future market trends.
Key Drivers, Barriers & Challenges in Asia Pacific Disposable Tableware Industry
Key Drivers: Rising disposable incomes, rapid urbanization, expansion of the food service sector, and increasing demand for convenience. Government initiatives promoting tourism and food processing industries are additional drivers.
Key Challenges: Fluctuations in raw material prices, environmental concerns related to plastic waste, and intense competition among players. Supply chain disruptions (xx% impact on production in 2022) and increasing regulatory scrutiny pose additional challenges.
Emerging Opportunities in Asia Pacific Disposable Tableware Industry
Emerging opportunities lie in the growing demand for sustainable and eco-friendly disposable tableware made from biodegradable materials. The rise of eco-conscious consumers presents a significant opportunity for companies offering sustainable products. Untapped markets in rural areas also offer considerable potential for expansion.
Growth Accelerators in the Asia Pacific Disposable Tableware Industry Industry
Technological advancements such as automation in manufacturing and the development of innovative, eco-friendly materials will significantly impact future growth. Strategic partnerships and acquisitions will also contribute to market consolidation and expansion. The rise of e-commerce and efficient supply chain management strategies represent key growth catalysts.
Key Players Shaping the Asia Pacific Disposable Tableware Industry Market
- Nine Dragons Paper
- Rengo Co. Ltd
- Berry Plastics Corporation
- Amcor
- Toyo Seikan
- Nippon Paper
- Mondi Group
- Guangdong Huasheng Meto
- Oji Holdings
- Sonoco Products
- Taizhou Fuling Plastics
Notable Milestones in Asia Pacific Disposable Tableware Industry Sector
- September 2021: Oji Holding Corporation acquired an 80% stake in Empire Packages Private Limited, expanding its presence in India, Bangladesh, and Nepal.
- February 2022: Nippon Paper Industries collaborated with Elopak Paper Industries to expand liquid-paper packaging in the Asia-Pacific region.
In-Depth Asia Pacific Disposable Tableware Industry Market Outlook
The Asia Pacific disposable tableware market is poised for continued growth, driven by ongoing urbanization, economic expansion, and the increasing popularity of convenient food service options. Strategic investments in sustainable materials and efficient distribution networks will be crucial for success. The market presents significant opportunities for companies that can adapt to changing consumer preferences and regulatory landscapes. Focus on eco-friendly options and innovations will likely dominate future market strategies.
Asia Pacific Disposable Tableware Industry Segmentation
- 1. Production Analysis
- 2. Consumption Analysis
- 3. Import Market Analysis (Value & Volume)
- 4. Export Market Analysis (Value & Volume)
- 5. Price Trend Analysis
Asia Pacific Disposable Tableware Industry Segmentation By Geography
-
1. Asia Pacific
- 1.1. China
- 1.2. Japan
- 1.3. South Korea
- 1.4. India
- 1.5. Australia
- 1.6. New Zealand
- 1.7. Indonesia
- 1.8. Malaysia
- 1.9. Singapore
- 1.10. Thailand
- 1.11. Vietnam
- 1.12. Philippines
Asia Pacific Disposable Tableware Industry Regional Market Share
Geographic Coverage of Asia Pacific Disposable Tableware Industry
Asia Pacific Disposable Tableware Industry REPORT HIGHLIGHTS
| Aspects | Details |
|---|---|
| Study Period | 2020-2034 |
| Base Year | 2025 |
| Estimated Year | 2026 |
| Forecast Period | 2026-2034 |
| Historical Period | 2020-2025 |
| Growth Rate | CAGR of 5.12% from 2020-2034 |
| Segmentation |
|
Table of Contents
- 1. Introduction
- 1.1. Research Scope
- 1.2. Market Segmentation
- 1.3. Research Objective
- 1.4. Definitions and Assumptions
- 2. Executive Summary
- 2.1. Market Snapshot
- 3. Market Dynamics
- 3.1. Market Drivers
- 3.2. Market Restrains
- 3.3. Market Trends
- 3.4. Market Opportunities
- 4. Market Factor Analysis
- 4.1. Porters Five Forces
- 4.1.1. Bargaining Power of Suppliers
- 4.1.2. Bargaining Power of Buyers
- 4.1.3. Threat of New Entrants
- 4.1.4. Threat of Substitutes
- 4.1.5. Competitive Rivalry
- 4.2. PESTEL analysis
- 4.3. BCG Analysis
- 4.3.1. Stars (High Growth, High Market Share)
- 4.3.2. Cash Cows (Low Growth, High Market Share)
- 4.3.3. Question Mark (High Growth, Low Market Share)
- 4.3.4. Dogs (Low Growth, Low Market Share)
- 4.4. Ansoff Matrix Analysis
- 4.5. Supply Chain Analysis
- 4.6. Regulatory Landscape
- 4.7. Current Market Potential and Opportunity Assessment (TAM–SAM–SOM Framework)
- 4.8. VDR Analyst Note
- 4.1. Porters Five Forces
- 5. Market Analysis, Insights and Forecast 2021-2033
- 5.1. Market Analysis, Insights and Forecast - by Production Analysis
- 5.2. Market Analysis, Insights and Forecast - by Consumption Analysis
- 5.3. Market Analysis, Insights and Forecast - by Import Market Analysis (Value & Volume)
- 5.4. Market Analysis, Insights and Forecast - by Export Market Analysis (Value & Volume)
- 5.5. Market Analysis, Insights and Forecast - by Price Trend Analysis
- 5.6. Market Analysis, Insights and Forecast - by Region
- 5.6.1. Asia Pacific
- 6. Asia Pacific Disposable Tableware Industry Analysis, Insights and Forecast, 2021-2033
- 6.1. Market Analysis, Insights and Forecast - by Production Analysis
- 6.2. Market Analysis, Insights and Forecast - by Consumption Analysis
- 6.3. Market Analysis, Insights and Forecast - by Import Market Analysis (Value & Volume)
- 6.4. Market Analysis, Insights and Forecast - by Export Market Analysis (Value & Volume)
- 6.5. Market Analysis, Insights and Forecast - by Price Trend Analysis
- 7. Competitive Analysis
- 7.1. Company Profiles
- 7.1.1 Nine Dragons Paper
- 7.1.1.1. Company Overview
- 7.1.1.2. Products
- 7.1.1.3. Company Financials
- 7.1.1.4. SWOT Analysis
- 7.1.2 Rengo co Ltd
- 7.1.2.1. Company Overview
- 7.1.2.2. Products
- 7.1.2.3. Company Financials
- 7.1.2.4. SWOT Analysis
- 7.1.3 Berry Plastics Corporation
- 7.1.3.1. Company Overview
- 7.1.3.2. Products
- 7.1.3.3. Company Financials
- 7.1.3.4. SWOT Analysis
- 7.1.4 Amcor
- 7.1.4.1. Company Overview
- 7.1.4.2. Products
- 7.1.4.3. Company Financials
- 7.1.4.4. SWOT Analysis
- 7.1.5 Toyo Seikan
- 7.1.5.1. Company Overview
- 7.1.5.2. Products
- 7.1.5.3. Company Financials
- 7.1.5.4. SWOT Analysis
- 7.1.6 Nippon Paper
- 7.1.6.1. Company Overview
- 7.1.6.2. Products
- 7.1.6.3. Company Financials
- 7.1.6.4. SWOT Analysis
- 7.1.7 Mondi Group
- 7.1.7.1. Company Overview
- 7.1.7.2. Products
- 7.1.7.3. Company Financials
- 7.1.7.4. SWOT Analysis
- 7.1.8 Guangdong Huasheng Meto
- 7.1.8.1. Company Overview
- 7.1.8.2. Products
- 7.1.8.3. Company Financials
- 7.1.8.4. SWOT Analysis
- 7.1.9 Oji Holdings
- 7.1.9.1. Company Overview
- 7.1.9.2. Products
- 7.1.9.3. Company Financials
- 7.1.9.4. SWOT Analysis
- 7.1.10 Sonoco Products**List Not Exhaustive
- 7.1.10.1. Company Overview
- 7.1.10.2. Products
- 7.1.10.3. Company Financials
- 7.1.10.4. SWOT Analysis
- 7.1.11 Taizhou Fuling Plastics
- 7.1.11.1. Company Overview
- 7.1.11.2. Products
- 7.1.11.3. Company Financials
- 7.1.11.4. SWOT Analysis
- 7.1.1 Nine Dragons Paper
- 7.2. Market Entropy
- 7.2.1 Company's Key Areas Served
- 7.2.2 Recent Developments
- 7.3. Company Market Share Analysis 2025
- 7.3.1 Top 5 Companies Market Share Analysis
- 7.3.2 Top 3 Companies Market Share Analysis
- 7.4. List of Potential Customers
- 8. Research Methodology
List of Figures
- Figure 1: Asia Pacific Disposable Tableware Industry Revenue Breakdown (Million, %) by Product 2025 & 2033
- Figure 2: Asia Pacific Disposable Tableware Industry Share (%) by Company 2025
List of Tables
- Table 1: Asia Pacific Disposable Tableware Industry Revenue Million Forecast, by Production Analysis 2020 & 2033
- Table 2: Asia Pacific Disposable Tableware Industry Revenue Million Forecast, by Consumption Analysis 2020 & 2033
- Table 3: Asia Pacific Disposable Tableware Industry Revenue Million Forecast, by Import Market Analysis (Value & Volume) 2020 & 2033
- Table 4: Asia Pacific Disposable Tableware Industry Revenue Million Forecast, by Export Market Analysis (Value & Volume) 2020 & 2033
- Table 5: Asia Pacific Disposable Tableware Industry Revenue Million Forecast, by Price Trend Analysis 2020 & 2033
- Table 6: Asia Pacific Disposable Tableware Industry Revenue Million Forecast, by Region 2020 & 2033
- Table 7: Asia Pacific Disposable Tableware Industry Revenue Million Forecast, by Production Analysis 2020 & 2033
- Table 8: Asia Pacific Disposable Tableware Industry Revenue Million Forecast, by Consumption Analysis 2020 & 2033
- Table 9: Asia Pacific Disposable Tableware Industry Revenue Million Forecast, by Import Market Analysis (Value & Volume) 2020 & 2033
- Table 10: Asia Pacific Disposable Tableware Industry Revenue Million Forecast, by Export Market Analysis (Value & Volume) 2020 & 2033
- Table 11: Asia Pacific Disposable Tableware Industry Revenue Million Forecast, by Price Trend Analysis 2020 & 2033
- Table 12: Asia Pacific Disposable Tableware Industry Revenue Million Forecast, by Country 2020 & 2033
- Table 13: China Asia Pacific Disposable Tableware Industry Revenue (Million) Forecast, by Application 2020 & 2033
- Table 14: Japan Asia Pacific Disposable Tableware Industry Revenue (Million) Forecast, by Application 2020 & 2033
- Table 15: South Korea Asia Pacific Disposable Tableware Industry Revenue (Million) Forecast, by Application 2020 & 2033
- Table 16: India Asia Pacific Disposable Tableware Industry Revenue (Million) Forecast, by Application 2020 & 2033
- Table 17: Australia Asia Pacific Disposable Tableware Industry Revenue (Million) Forecast, by Application 2020 & 2033
- Table 18: New Zealand Asia Pacific Disposable Tableware Industry Revenue (Million) Forecast, by Application 2020 & 2033
- Table 19: Indonesia Asia Pacific Disposable Tableware Industry Revenue (Million) Forecast, by Application 2020 & 2033
- Table 20: Malaysia Asia Pacific Disposable Tableware Industry Revenue (Million) Forecast, by Application 2020 & 2033
- Table 21: Singapore Asia Pacific Disposable Tableware Industry Revenue (Million) Forecast, by Application 2020 & 2033
- Table 22: Thailand Asia Pacific Disposable Tableware Industry Revenue (Million) Forecast, by Application 2020 & 2033
- Table 23: Vietnam Asia Pacific Disposable Tableware Industry Revenue (Million) Forecast, by Application 2020 & 2033
- Table 24: Philippines Asia Pacific Disposable Tableware Industry Revenue (Million) Forecast, by Application 2020 & 2033
Frequently Asked Questions
1. What is the projected Compound Annual Growth Rate (CAGR) of the Asia Pacific Disposable Tableware Industry?
The projected CAGR is approximately 5.12%.
2. Which companies are prominent players in the Asia Pacific Disposable Tableware Industry?
Key companies in the market include Nine Dragons Paper, Rengo co Ltd, Berry Plastics Corporation, Amcor, Toyo Seikan, Nippon Paper, Mondi Group, Guangdong Huasheng Meto, Oji Holdings, Sonoco Products**List Not Exhaustive, Taizhou Fuling Plastics.
3. What are the main segments of the Asia Pacific Disposable Tableware Industry?
The market segments include Production Analysis, Consumption Analysis, Import Market Analysis (Value & Volume), Export Market Analysis (Value & Volume), Price Trend Analysis.
4. Can you provide details about the market size?
The market size is estimated to be USD 14.64 Million as of 2022.
5. What are some drivers contributing to market growth?
Increasing Construction and Renovation Activities is Driving the Market.
6. What are the notable trends driving market growth?
Increase in the Usage of Disposable Items.
7. Are there any restraints impacting market growth?
Increasing Regulations and Tariffs is Restraining the Market.
8. Can you provide examples of recent developments in the market?
In February 2022, Nippon Paper Industries collaborated with Elopak Paper Industries to collectively put efforts in the field of Liquid- Paper Packaging and to expand the market size in Asia - Pacific region.
9. What pricing options are available for accessing the report?
Pricing options include single-user, multi-user, and enterprise licenses priced at USD 4750, USD 5250, and USD 8750 respectively.
10. Is the market size provided in terms of value or volume?
The market size is provided in terms of value, measured in Million.
11. Are there any specific market keywords associated with the report?
Yes, the market keyword associated with the report is "Asia Pacific Disposable Tableware Industry," which aids in identifying and referencing the specific market segment covered.
12. How do I determine which pricing option suits my needs best?
The pricing options vary based on user requirements and access needs. Individual users may opt for single-user licenses, while businesses requiring broader access may choose multi-user or enterprise licenses for cost-effective access to the report.
13. Are there any additional resources or data provided in the Asia Pacific Disposable Tableware Industry report?
While the report offers comprehensive insights, it's advisable to review the specific contents or supplementary materials provided to ascertain if additional resources or data are available.
14. How can I stay updated on further developments or reports in the Asia Pacific Disposable Tableware Industry?
To stay informed about further developments, trends, and reports in the Asia Pacific Disposable Tableware Industry, consider subscribing to industry newsletters, following relevant companies and organizations, or regularly checking reputable industry news sources and publications.
Methodology
Step 1 - Identification of Relevant Samples Size from Population Database


Step 2 - Approaches for Defining Global Market Size (Value, Volume* & Price*)

Note*: In applicable scenarios
Step 3 - Data Sources
Primary Research
- Web Analytics
- Survey Reports
- Research Institute
- Latest Research Reports
- Opinion Leaders
Secondary Research
- Annual Reports
- White Paper
- Latest Press Release
- Industry Association
- Paid Database
- Investor Presentations

Step 4 - Data Triangulation
Involves using different sources of information in order to increase the validity of a study
These sources are likely to be stakeholders in a program - participants, other researchers, program staff, other community members, and so on.
Then we put all data in single framework & apply various statistical tools to find out the dynamic on the market.
During the analysis stage, feedback from the stakeholder groups would be compared to determine areas of agreement as well as areas of divergence