

Key Insights
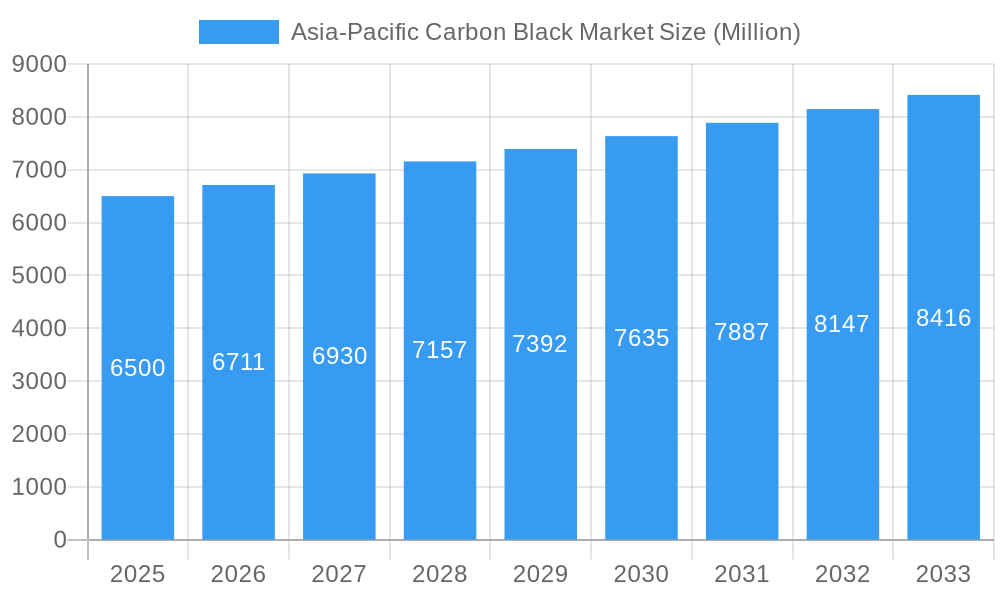
The Asia-Pacific carbon black market is poised for significant expansion, propelled by the robust automotive sector and escalating demand across plastics and rubber industries. Key growth drivers include the region's expanding automotive production, coupled with ongoing infrastructure development and urbanization. The market is projected to achieve a compound annual growth rate (CAGR) of 3.4%, reaching a market size of 9.73 million by the base year 2025. This growth trajectory is further bolstered by the integration of advanced carbon black materials in specialized applications such as conductive inks and high-performance polymers. However, market participants must navigate challenges including volatile raw material costs and environmental considerations. Stringent emission regulations and a focus on sustainable manufacturing are expected to foster innovation in eco-friendly production methods and alternative materials. The competitive landscape features established global entities and regional manufacturers, with key players dominating market share.
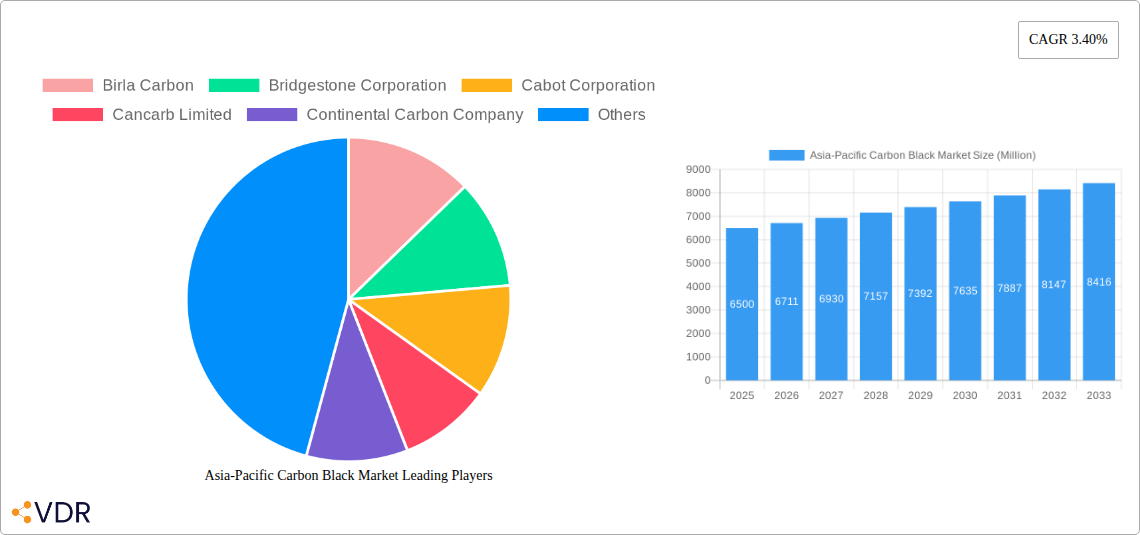
Asia-Pacific Carbon Black Market Market Size (In Million)
Market segmentation within Asia-Pacific carbon black is anticipated to mirror diverse application demands. Tire manufacturing continues to be the primary segment, driven by an increasing vehicle parc. Substantial growth is also projected for the plastics and rubber segments, fueled by the demand for durable, high-performance materials across various industries. Regional dynamics are expected to show variance, with rapidly industrializing economies like China, India, and Southeast Asian nations leading market expansion. Continuous technological advancements in carbon black, focusing on enhanced performance and reduced environmental impact, will be critical for future market development.
Asia-Pacific Carbon Black Market Company Market Share
Asia-Pacific Carbon Black Market: A Comprehensive Market Report (2019-2033)
This comprehensive report provides an in-depth analysis of the Asia-Pacific carbon black market, offering invaluable insights for industry professionals, investors, and strategic decision-makers. Spanning the period from 2019 to 2033, with a focus on 2025, this report meticulously examines market dynamics, growth trends, key players, and future opportunities within this crucial sector. The report encompasses both the parent market (specialty chemicals) and the child market (carbon black) to provide a holistic understanding of market dynamics. The market size is presented in Million units.
Asia-Pacific Carbon Black Market Market Dynamics & Structure
The Asia-Pacific carbon black market is characterized by a moderately concentrated landscape, with several major players holding significant market share. Technological innovation, particularly in sustainable production methods and enhanced product performance, is a key driver. Stringent environmental regulations, coupled with increasing demand from key end-use industries, are shaping market dynamics. Competitive pressure from substitute materials is present, but the inherent properties of carbon black continue to ensure its widespread adoption.
- Market Concentration: Moderately concentrated, with top 5 players holding approximately xx% market share in 2025 (Estimated).
- Technological Innovation: Focus on sustainable production, improved dispersion, and enhanced performance characteristics.
- Regulatory Landscape: Stringent environmental regulations driving innovation in cleaner production methods.
- Competitive Substitutes: Limited substitutes exist, mainly focusing on cost-effective alternatives.
- End-User Demographics: Primarily driven by the tire industry, with growing demand from other sectors such as plastics and inks.
- M&A Activity: xx M&A deals were recorded between 2019-2024, indicating consolidation within the market. Further consolidation is expected, with an estimated xx deals by 2033.
Asia-Pacific Carbon Black Market Growth Trends & Insights
The Asia-Pacific carbon black market exhibits robust growth, driven by factors including expanding industrialization, increasing vehicle production, and rising consumer demand for durable goods. The market is experiencing significant growth, with a projected Compound Annual Growth Rate (CAGR) of xx% during the forecast period (2025-2033). This growth is fueled by technological advancements and the increasing demand across various industries, including the automotive, plastics, and rubber industries. Market penetration is expected to reach xx% by 2033, driven by increased consumption in emerging economies. Technological disruptions, such as the development of advanced carbon black materials with improved properties, are further enhancing market growth.
Dominant Regions, Countries, or Segments in Asia-Pacific Carbon Black Market
China, India, and Japan dominate the Asia-Pacific carbon black market, representing approximately xx% of the total market share in 2025 (Estimated). This dominance is fueled by robust industrial growth, substantial manufacturing capabilities, and favorable government policies promoting infrastructure development within these countries.
- Key Drivers in China: Rapid industrialization, strong automotive sector, and government support for infrastructure projects.
- Key Drivers in India: Growing automotive industry, expanding construction sector, and increasing demand for plastics and rubber products.
- Key Drivers in Japan: Technological advancements, focus on high-performance carbon black, and established automotive industry.
- Growth Potential: Southeast Asia is expected to show significant growth potential, driven by expanding industrialization and economic development.
Asia-Pacific Carbon Black Market Product Landscape
The Asia-Pacific carbon black market offers a diverse range of products catering to specific application requirements. These range from standard grades used in tire production to specialty grades designed for demanding applications in plastics and inks. Continuous innovations focus on improving particle size distribution, surface area, and structure for enhanced performance and sustainability. This leads to products with improved rheological properties, better dispersion characteristics, and enhanced reinforcement capabilities.
Key Drivers, Barriers & Challenges in Asia-Pacific Carbon Black Market
Key Drivers:
- Growing demand from the automotive industry (tire production).
- Increased consumption in the plastics and rubber industries.
- Infrastructure development and industrialization in emerging economies.
Key Challenges:
- Fluctuations in raw material prices (crude oil).
- Stringent environmental regulations increasing production costs.
- Intense competition from established and new market entrants. This leads to price pressure and a need for continuous innovation.
Emerging Opportunities in Asia-Pacific Carbon Black Market
Emerging opportunities lie in developing sustainable and eco-friendly carbon black production methods, expanding into new applications such as conductive inks and advanced materials, and targeting niche markets with specialized carbon black grades.
Growth Accelerators in the Asia-Pacific Carbon Black Market Industry
Technological advancements in carbon black production, coupled with strategic partnerships and market expansion into high-growth regions like Southeast Asia, are key growth catalysts. Emphasis on sustainable production and development of high-performance carbon black grades are also crucial factors.
Key Players Shaping the Asia-Pacific Carbon Black Market Market
- Birla Carbon
- Bridgestone Corporation
- Cabot Corporation
- Cancarb Limited
- Continental Carbon Company
- Epsilon Carbon Private Limited
- Himadri Specialty Chemical Ltd
- Imerys
- Longxing Chemical Stock Co Ltd
- Mitsubishi Chemical Group Corporation
- OCI COMPANY Ltd
- Orion Engineered Carbons
- PCBL (Phillips Carbon Black Limited)
- Shandong Huadong Rubber Materials Co Ltd
- Tokai Carbon Co Ltd
- *List Not Exhaustive
Notable Milestones in Asia-Pacific Carbon Black Market Sector
- April 2023: Phillips Carbon Black opened a new production facility in Tamil Nadu, India, with an expected annual production of 147 kilotons.
- September 2022: Epsilon Carbon announced a capacity expansion in Vijayanagar, India, increasing production from 115 to 215 kilotons, with an investment of ~USD 66.6 million.
In-Depth Asia-Pacific Carbon Black Market Market Outlook
The Asia-Pacific carbon black market is poised for continued growth, driven by strong demand from key industries and technological advancements. Strategic partnerships, focused investments in sustainable production, and expansion into new applications will shape the market's trajectory. The market presents substantial opportunities for established players and new entrants alike, particularly in leveraging technological advancements to create high-performance, sustainable carbon black products.
Asia-Pacific Carbon Black Market Segmentation
-
1. Process Type
- 1.1. Furnace Black
- 1.2. Gas Black
- 1.3. Lamp Black
- 1.4. Thermal Black
-
2. Application
- 2.1. Tires and Industrial Rubber Products
- 2.2. Plastics
- 2.3. Toners and Printing Inks
- 2.4. Coatings
- 2.5. Textile Fibers
- 2.6. Other Ap
-
3. Geography
- 3.1. China
- 3.2. India
- 3.3. Japan
- 3.4. South Korea
- 3.5. ASEAN Countries
- 3.6. Rest of Asia-Pacific
Asia-Pacific Carbon Black Market Segmentation By Geography
- 1. China
- 2. India
- 3. Japan
- 4. South Korea
- 5. ASEAN Countries
- 6. Rest of Asia Pacific
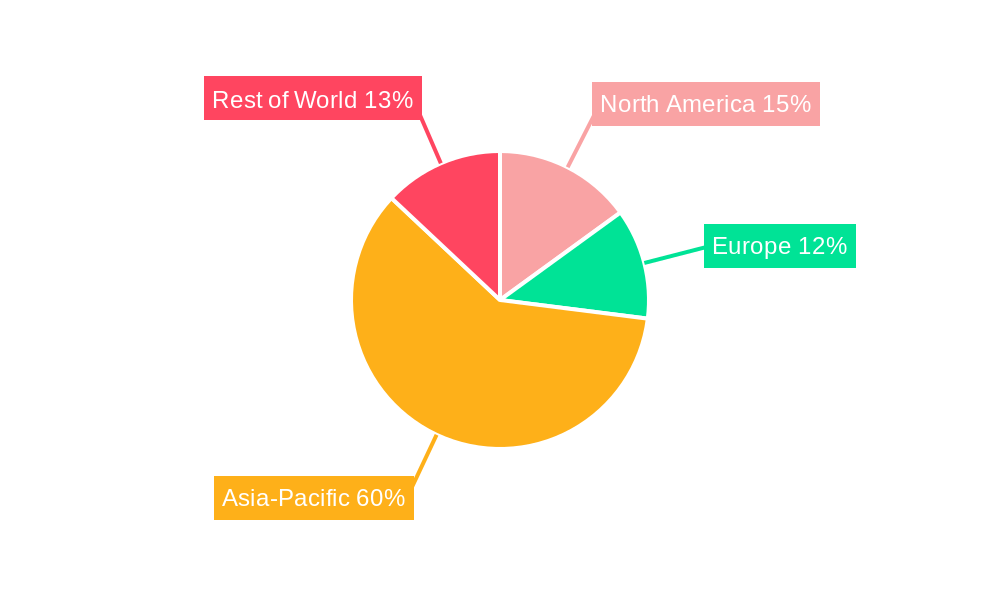
Asia-Pacific Carbon Black Market Regional Market Share
Geographic Coverage of Asia-Pacific Carbon Black Market
Asia-Pacific Carbon Black Market REPORT HIGHLIGHTS
| Aspects | Details |
|---|---|
| Study Period | 2020-2034 |
| Base Year | 2025 |
| Estimated Year | 2026 |
| Forecast Period | 2026-2034 |
| Historical Period | 2020-2025 |
| Growth Rate | CAGR of 3.4% from 2020-2034 |
| Segmentation |
|
Table of Contents
- 1. Introduction
- 1.1. Research Scope
- 1.2. Market Segmentation
- 1.3. Research Objective
- 1.4. Definitions and Assumptions
- 2. Executive Summary
- 2.1. Market Snapshot
- 3. Market Dynamics
- 3.1. Market Drivers
- 3.2. Market Restrains
- 3.3. Market Trends
- 3.4. Market Opportunities
- 4. Market Factor Analysis
- 4.1. Porters Five Forces
- 4.1.1. Bargaining Power of Suppliers
- 4.1.2. Bargaining Power of Buyers
- 4.1.3. Threat of New Entrants
- 4.1.4. Threat of Substitutes
- 4.1.5. Competitive Rivalry
- 4.2. PESTEL analysis
- 4.3. BCG Analysis
- 4.3.1. Stars (High Growth, High Market Share)
- 4.3.2. Cash Cows (Low Growth, High Market Share)
- 4.3.3. Question Mark (High Growth, Low Market Share)
- 4.3.4. Dogs (Low Growth, Low Market Share)
- 4.4. Ansoff Matrix Analysis
- 4.5. Supply Chain Analysis
- 4.6. Regulatory Landscape
- 4.7. Current Market Potential and Opportunity Assessment (TAM–SAM–SOM Framework)
- 4.8. VDR Analyst Note
- 4.1. Porters Five Forces
- 5. Market Analysis, Insights and Forecast 2021-2033
- 5.1. Market Analysis, Insights and Forecast - by Process Type
- 5.1.1. Furnace Black
- 5.1.2. Gas Black
- 5.1.3. Lamp Black
- 5.1.4. Thermal Black
- 5.2. Market Analysis, Insights and Forecast - by Application
- 5.2.1. Tires and Industrial Rubber Products
- 5.2.2. Plastics
- 5.2.3. Toners and Printing Inks
- 5.2.4. Coatings
- 5.2.5. Textile Fibers
- 5.2.6. Other Ap
- 5.3. Market Analysis, Insights and Forecast - by Geography
- 5.3.1. China
- 5.3.2. India
- 5.3.3. Japan
- 5.3.4. South Korea
- 5.3.5. ASEAN Countries
- 5.3.6. Rest of Asia-Pacific
- 5.4. Market Analysis, Insights and Forecast - by Region
- 5.4.1. China
- 5.4.2. India
- 5.4.3. Japan
- 5.4.4. South Korea
- 5.4.5. ASEAN Countries
- 5.4.6. Rest of Asia Pacific
- 5.1. Market Analysis, Insights and Forecast - by Process Type
- 6. Global Asia-Pacific Carbon Black Market Analysis, Insights and Forecast, 2021-2033
- 6.1. Market Analysis, Insights and Forecast - by Process Type
- 6.1.1. Furnace Black
- 6.1.2. Gas Black
- 6.1.3. Lamp Black
- 6.1.4. Thermal Black
- 6.2. Market Analysis, Insights and Forecast - by Application
- 6.2.1. Tires and Industrial Rubber Products
- 6.2.2. Plastics
- 6.2.3. Toners and Printing Inks
- 6.2.4. Coatings
- 6.2.5. Textile Fibers
- 6.2.6. Other Ap
- 6.3. Market Analysis, Insights and Forecast - by Geography
- 6.3.1. China
- 6.3.2. India
- 6.3.3. Japan
- 6.3.4. South Korea
- 6.3.5. ASEAN Countries
- 6.3.6. Rest of Asia-Pacific
- 6.1. Market Analysis, Insights and Forecast - by Process Type
- 7. China Asia-Pacific Carbon Black Market Analysis, Insights and Forecast, 2021-2033
- 7.1. Market Analysis, Insights and Forecast - by Process Type
- 7.1.1. Furnace Black
- 7.1.2. Gas Black
- 7.1.3. Lamp Black
- 7.1.4. Thermal Black
- 7.2. Market Analysis, Insights and Forecast - by Application
- 7.2.1. Tires and Industrial Rubber Products
- 7.2.2. Plastics
- 7.2.3. Toners and Printing Inks
- 7.2.4. Coatings
- 7.2.5. Textile Fibers
- 7.2.6. Other Ap
- 7.3. Market Analysis, Insights and Forecast - by Geography
- 7.3.1. China
- 7.3.2. India
- 7.3.3. Japan
- 7.3.4. South Korea
- 7.3.5. ASEAN Countries
- 7.3.6. Rest of Asia-Pacific
- 7.1. Market Analysis, Insights and Forecast - by Process Type
- 8. India Asia-Pacific Carbon Black Market Analysis, Insights and Forecast, 2021-2033
- 8.1. Market Analysis, Insights and Forecast - by Process Type
- 8.1.1. Furnace Black
- 8.1.2. Gas Black
- 8.1.3. Lamp Black
- 8.1.4. Thermal Black
- 8.2. Market Analysis, Insights and Forecast - by Application
- 8.2.1. Tires and Industrial Rubber Products
- 8.2.2. Plastics
- 8.2.3. Toners and Printing Inks
- 8.2.4. Coatings
- 8.2.5. Textile Fibers
- 8.2.6. Other Ap
- 8.3. Market Analysis, Insights and Forecast - by Geography
- 8.3.1. China
- 8.3.2. India
- 8.3.3. Japan
- 8.3.4. South Korea
- 8.3.5. ASEAN Countries
- 8.3.6. Rest of Asia-Pacific
- 8.1. Market Analysis, Insights and Forecast - by Process Type
- 9. Japan Asia-Pacific Carbon Black Market Analysis, Insights and Forecast, 2021-2033
- 9.1. Market Analysis, Insights and Forecast - by Process Type
- 9.1.1. Furnace Black
- 9.1.2. Gas Black
- 9.1.3. Lamp Black
- 9.1.4. Thermal Black
- 9.2. Market Analysis, Insights and Forecast - by Application
- 9.2.1. Tires and Industrial Rubber Products
- 9.2.2. Plastics
- 9.2.3. Toners and Printing Inks
- 9.2.4. Coatings
- 9.2.5. Textile Fibers
- 9.2.6. Other Ap
- 9.3. Market Analysis, Insights and Forecast - by Geography
- 9.3.1. China
- 9.3.2. India
- 9.3.3. Japan
- 9.3.4. South Korea
- 9.3.5. ASEAN Countries
- 9.3.6. Rest of Asia-Pacific
- 9.1. Market Analysis, Insights and Forecast - by Process Type
- 10. South Korea Asia-Pacific Carbon Black Market Analysis, Insights and Forecast, 2021-2033
- 10.1. Market Analysis, Insights and Forecast - by Process Type
- 10.1.1. Furnace Black
- 10.1.2. Gas Black
- 10.1.3. Lamp Black
- 10.1.4. Thermal Black
- 10.2. Market Analysis, Insights and Forecast - by Application
- 10.2.1. Tires and Industrial Rubber Products
- 10.2.2. Plastics
- 10.2.3. Toners and Printing Inks
- 10.2.4. Coatings
- 10.2.5. Textile Fibers
- 10.2.6. Other Ap
- 10.3. Market Analysis, Insights and Forecast - by Geography
- 10.3.1. China
- 10.3.2. India
- 10.3.3. Japan
- 10.3.4. South Korea
- 10.3.5. ASEAN Countries
- 10.3.6. Rest of Asia-Pacific
- 10.1. Market Analysis, Insights and Forecast - by Process Type
- 11. ASEAN Countries Asia-Pacific Carbon Black Market Analysis, Insights and Forecast, 2021-2033
- 11.1. Market Analysis, Insights and Forecast - by Process Type
- 11.1.1. Furnace Black
- 11.1.2. Gas Black
- 11.1.3. Lamp Black
- 11.1.4. Thermal Black
- 11.2. Market Analysis, Insights and Forecast - by Application
- 11.2.1. Tires and Industrial Rubber Products
- 11.2.2. Plastics
- 11.2.3. Toners and Printing Inks
- 11.2.4. Coatings
- 11.2.5. Textile Fibers
- 11.2.6. Other Ap
- 11.3. Market Analysis, Insights and Forecast - by Geography
- 11.3.1. China
- 11.3.2. India
- 11.3.3. Japan
- 11.3.4. South Korea
- 11.3.5. ASEAN Countries
- 11.3.6. Rest of Asia-Pacific
- 11.1. Market Analysis, Insights and Forecast - by Process Type
- 12. Rest of Asia Pacific Asia-Pacific Carbon Black Market Analysis, Insights and Forecast, 2021-2033
- 12.1. Market Analysis, Insights and Forecast - by Process Type
- 12.1.1. Furnace Black
- 12.1.2. Gas Black
- 12.1.3. Lamp Black
- 12.1.4. Thermal Black
- 12.2. Market Analysis, Insights and Forecast - by Application
- 12.2.1. Tires and Industrial Rubber Products
- 12.2.2. Plastics
- 12.2.3. Toners and Printing Inks
- 12.2.4. Coatings
- 12.2.5. Textile Fibers
- 12.2.6. Other Ap
- 12.3. Market Analysis, Insights and Forecast - by Geography
- 12.3.1. China
- 12.3.2. India
- 12.3.3. Japan
- 12.3.4. South Korea
- 12.3.5. ASEAN Countries
- 12.3.6. Rest of Asia-Pacific
- 12.1. Market Analysis, Insights and Forecast - by Process Type
- 13. Competitive Analysis
- 13.1. Company Profiles
- 13.1.1 Birla Carbon
- 13.1.1.1. Company Overview
- 13.1.1.2. Products
- 13.1.1.3. Company Financials
- 13.1.1.4. SWOT Analysis
- 13.1.2 Bridgestone Corporation
- 13.1.2.1. Company Overview
- 13.1.2.2. Products
- 13.1.2.3. Company Financials
- 13.1.2.4. SWOT Analysis
- 13.1.3 Cabot Corporation
- 13.1.3.1. Company Overview
- 13.1.3.2. Products
- 13.1.3.3. Company Financials
- 13.1.3.4. SWOT Analysis
- 13.1.4 Cancarb Limited
- 13.1.4.1. Company Overview
- 13.1.4.2. Products
- 13.1.4.3. Company Financials
- 13.1.4.4. SWOT Analysis
- 13.1.5 Continental Carbon Company
- 13.1.5.1. Company Overview
- 13.1.5.2. Products
- 13.1.5.3. Company Financials
- 13.1.5.4. SWOT Analysis
- 13.1.6 Epsilon Carbon Private Limited
- 13.1.6.1. Company Overview
- 13.1.6.2. Products
- 13.1.6.3. Company Financials
- 13.1.6.4. SWOT Analysis
- 13.1.7 Himadri Specialty Chemical Ltd
- 13.1.7.1. Company Overview
- 13.1.7.2. Products
- 13.1.7.3. Company Financials
- 13.1.7.4. SWOT Analysis
- 13.1.8 Imerys
- 13.1.8.1. Company Overview
- 13.1.8.2. Products
- 13.1.8.3. Company Financials
- 13.1.8.4. SWOT Analysis
- 13.1.9 Longxing Chemical Stock Co Ltd
- 13.1.9.1. Company Overview
- 13.1.9.2. Products
- 13.1.9.3. Company Financials
- 13.1.9.4. SWOT Analysis
- 13.1.10 Mitsubishi Chemical Group Corporation
- 13.1.10.1. Company Overview
- 13.1.10.2. Products
- 13.1.10.3. Company Financials
- 13.1.10.4. SWOT Analysis
- 13.1.11 OCI COMPANY Ltd
- 13.1.11.1. Company Overview
- 13.1.11.2. Products
- 13.1.11.3. Company Financials
- 13.1.11.4. SWOT Analysis
- 13.1.12 Orion Engineered Carbons
- 13.1.12.1. Company Overview
- 13.1.12.2. Products
- 13.1.12.3. Company Financials
- 13.1.12.4. SWOT Analysis
- 13.1.13 PCBL (Phillips Carbon Black Limited)
- 13.1.13.1. Company Overview
- 13.1.13.2. Products
- 13.1.13.3. Company Financials
- 13.1.13.4. SWOT Analysis
- 13.1.14 Shandong Huadong Rubber Materials Co Ltd
- 13.1.14.1. Company Overview
- 13.1.14.2. Products
- 13.1.14.3. Company Financials
- 13.1.14.4. SWOT Analysis
- 13.1.15 Tokai Carbon Co Ltd*List Not Exhaustive
- 13.1.15.1. Company Overview
- 13.1.15.2. Products
- 13.1.15.3. Company Financials
- 13.1.15.4. SWOT Analysis
- 13.1.1 Birla Carbon
- 13.2. Market Entropy
- 13.2.1 Company's Key Areas Served
- 13.2.2 Recent Developments
- 13.3. Company Market Share Analysis 2025
- 13.3.1 Top 5 Companies Market Share Analysis
- 13.3.2 Top 3 Companies Market Share Analysis
- 13.4. List of Potential Customers
- 14. Research Methodology
List of Figures
- Figure 1: Global Asia-Pacific Carbon Black Market Revenue Breakdown (million, %) by Region 2025 & 2033
- Figure 2: China Asia-Pacific Carbon Black Market Revenue (million), by Process Type 2025 & 2033
- Figure 3: China Asia-Pacific Carbon Black Market Revenue Share (%), by Process Type 2025 & 2033
- Figure 4: China Asia-Pacific Carbon Black Market Revenue (million), by Application 2025 & 2033
- Figure 5: China Asia-Pacific Carbon Black Market Revenue Share (%), by Application 2025 & 2033
- Figure 6: China Asia-Pacific Carbon Black Market Revenue (million), by Geography 2025 & 2033
- Figure 7: China Asia-Pacific Carbon Black Market Revenue Share (%), by Geography 2025 & 2033
- Figure 8: China Asia-Pacific Carbon Black Market Revenue (million), by Country 2025 & 2033
- Figure 9: China Asia-Pacific Carbon Black Market Revenue Share (%), by Country 2025 & 2033
- Figure 10: India Asia-Pacific Carbon Black Market Revenue (million), by Process Type 2025 & 2033
- Figure 11: India Asia-Pacific Carbon Black Market Revenue Share (%), by Process Type 2025 & 2033
- Figure 12: India Asia-Pacific Carbon Black Market Revenue (million), by Application 2025 & 2033
- Figure 13: India Asia-Pacific Carbon Black Market Revenue Share (%), by Application 2025 & 2033
- Figure 14: India Asia-Pacific Carbon Black Market Revenue (million), by Geography 2025 & 2033
- Figure 15: India Asia-Pacific Carbon Black Market Revenue Share (%), by Geography 2025 & 2033
- Figure 16: India Asia-Pacific Carbon Black Market Revenue (million), by Country 2025 & 2033
- Figure 17: India Asia-Pacific Carbon Black Market Revenue Share (%), by Country 2025 & 2033
- Figure 18: Japan Asia-Pacific Carbon Black Market Revenue (million), by Process Type 2025 & 2033
- Figure 19: Japan Asia-Pacific Carbon Black Market Revenue Share (%), by Process Type 2025 & 2033
- Figure 20: Japan Asia-Pacific Carbon Black Market Revenue (million), by Application 2025 & 2033
- Figure 21: Japan Asia-Pacific Carbon Black Market Revenue Share (%), by Application 2025 & 2033
- Figure 22: Japan Asia-Pacific Carbon Black Market Revenue (million), by Geography 2025 & 2033
- Figure 23: Japan Asia-Pacific Carbon Black Market Revenue Share (%), by Geography 2025 & 2033
- Figure 24: Japan Asia-Pacific Carbon Black Market Revenue (million), by Country 2025 & 2033
- Figure 25: Japan Asia-Pacific Carbon Black Market Revenue Share (%), by Country 2025 & 2033
- Figure 26: South Korea Asia-Pacific Carbon Black Market Revenue (million), by Process Type 2025 & 2033
- Figure 27: South Korea Asia-Pacific Carbon Black Market Revenue Share (%), by Process Type 2025 & 2033
- Figure 28: South Korea Asia-Pacific Carbon Black Market Revenue (million), by Application 2025 & 2033
- Figure 29: South Korea Asia-Pacific Carbon Black Market Revenue Share (%), by Application 2025 & 2033
- Figure 30: South Korea Asia-Pacific Carbon Black Market Revenue (million), by Geography 2025 & 2033
- Figure 31: South Korea Asia-Pacific Carbon Black Market Revenue Share (%), by Geography 2025 & 2033
- Figure 32: South Korea Asia-Pacific Carbon Black Market Revenue (million), by Country 2025 & 2033
- Figure 33: South Korea Asia-Pacific Carbon Black Market Revenue Share (%), by Country 2025 & 2033
- Figure 34: ASEAN Countries Asia-Pacific Carbon Black Market Revenue (million), by Process Type 2025 & 2033
- Figure 35: ASEAN Countries Asia-Pacific Carbon Black Market Revenue Share (%), by Process Type 2025 & 2033
- Figure 36: ASEAN Countries Asia-Pacific Carbon Black Market Revenue (million), by Application 2025 & 2033
- Figure 37: ASEAN Countries Asia-Pacific Carbon Black Market Revenue Share (%), by Application 2025 & 2033
- Figure 38: ASEAN Countries Asia-Pacific Carbon Black Market Revenue (million), by Geography 2025 & 2033
- Figure 39: ASEAN Countries Asia-Pacific Carbon Black Market Revenue Share (%), by Geography 2025 & 2033
- Figure 40: ASEAN Countries Asia-Pacific Carbon Black Market Revenue (million), by Country 2025 & 2033
- Figure 41: ASEAN Countries Asia-Pacific Carbon Black Market Revenue Share (%), by Country 2025 & 2033
- Figure 42: Rest of Asia Pacific Asia-Pacific Carbon Black Market Revenue (million), by Process Type 2025 & 2033
- Figure 43: Rest of Asia Pacific Asia-Pacific Carbon Black Market Revenue Share (%), by Process Type 2025 & 2033
- Figure 44: Rest of Asia Pacific Asia-Pacific Carbon Black Market Revenue (million), by Application 2025 & 2033
- Figure 45: Rest of Asia Pacific Asia-Pacific Carbon Black Market Revenue Share (%), by Application 2025 & 2033
- Figure 46: Rest of Asia Pacific Asia-Pacific Carbon Black Market Revenue (million), by Geography 2025 & 2033
- Figure 47: Rest of Asia Pacific Asia-Pacific Carbon Black Market Revenue Share (%), by Geography 2025 & 2033
- Figure 48: Rest of Asia Pacific Asia-Pacific Carbon Black Market Revenue (million), by Country 2025 & 2033
- Figure 49: Rest of Asia Pacific Asia-Pacific Carbon Black Market Revenue Share (%), by Country 2025 & 2033
List of Tables
- Table 1: Global Asia-Pacific Carbon Black Market Revenue million Forecast, by Process Type 2020 & 2033
- Table 2: Global Asia-Pacific Carbon Black Market Revenue million Forecast, by Application 2020 & 2033
- Table 3: Global Asia-Pacific Carbon Black Market Revenue million Forecast, by Geography 2020 & 2033
- Table 4: Global Asia-Pacific Carbon Black Market Revenue million Forecast, by Region 2020 & 2033
- Table 5: Global Asia-Pacific Carbon Black Market Revenue million Forecast, by Process Type 2020 & 2033
- Table 6: Global Asia-Pacific Carbon Black Market Revenue million Forecast, by Application 2020 & 2033
- Table 7: Global Asia-Pacific Carbon Black Market Revenue million Forecast, by Geography 2020 & 2033
- Table 8: Global Asia-Pacific Carbon Black Market Revenue million Forecast, by Country 2020 & 2033
- Table 9: Global Asia-Pacific Carbon Black Market Revenue million Forecast, by Process Type 2020 & 2033
- Table 10: Global Asia-Pacific Carbon Black Market Revenue million Forecast, by Application 2020 & 2033
- Table 11: Global Asia-Pacific Carbon Black Market Revenue million Forecast, by Geography 2020 & 2033
- Table 12: Global Asia-Pacific Carbon Black Market Revenue million Forecast, by Country 2020 & 2033
- Table 13: Global Asia-Pacific Carbon Black Market Revenue million Forecast, by Process Type 2020 & 2033
- Table 14: Global Asia-Pacific Carbon Black Market Revenue million Forecast, by Application 2020 & 2033
- Table 15: Global Asia-Pacific Carbon Black Market Revenue million Forecast, by Geography 2020 & 2033
- Table 16: Global Asia-Pacific Carbon Black Market Revenue million Forecast, by Country 2020 & 2033
- Table 17: Global Asia-Pacific Carbon Black Market Revenue million Forecast, by Process Type 2020 & 2033
- Table 18: Global Asia-Pacific Carbon Black Market Revenue million Forecast, by Application 2020 & 2033
- Table 19: Global Asia-Pacific Carbon Black Market Revenue million Forecast, by Geography 2020 & 2033
- Table 20: Global Asia-Pacific Carbon Black Market Revenue million Forecast, by Country 2020 & 2033
- Table 21: Global Asia-Pacific Carbon Black Market Revenue million Forecast, by Process Type 2020 & 2033
- Table 22: Global Asia-Pacific Carbon Black Market Revenue million Forecast, by Application 2020 & 2033
- Table 23: Global Asia-Pacific Carbon Black Market Revenue million Forecast, by Geography 2020 & 2033
- Table 24: Global Asia-Pacific Carbon Black Market Revenue million Forecast, by Country 2020 & 2033
- Table 25: Global Asia-Pacific Carbon Black Market Revenue million Forecast, by Process Type 2020 & 2033
- Table 26: Global Asia-Pacific Carbon Black Market Revenue million Forecast, by Application 2020 & 2033
- Table 27: Global Asia-Pacific Carbon Black Market Revenue million Forecast, by Geography 2020 & 2033
- Table 28: Global Asia-Pacific Carbon Black Market Revenue million Forecast, by Country 2020 & 2033
Frequently Asked Questions
1. What is the projected Compound Annual Growth Rate (CAGR) of the Asia-Pacific Carbon Black Market?
The projected CAGR is approximately 3.4%.
2. Which companies are prominent players in the Asia-Pacific Carbon Black Market?
Key companies in the market include Birla Carbon, Bridgestone Corporation, Cabot Corporation, Cancarb Limited, Continental Carbon Company, Epsilon Carbon Private Limited, Himadri Specialty Chemical Ltd, Imerys, Longxing Chemical Stock Co Ltd, Mitsubishi Chemical Group Corporation, OCI COMPANY Ltd, Orion Engineered Carbons, PCBL (Phillips Carbon Black Limited), Shandong Huadong Rubber Materials Co Ltd, Tokai Carbon Co Ltd*List Not Exhaustive.
3. What are the main segments of the Asia-Pacific Carbon Black Market?
The market segments include Process Type, Application, Geography.
4. Can you provide details about the market size?
The market size is estimated to be USD 9.73 million as of 2022.
5. What are some drivers contributing to market growth?
Growing Application in Fiber and Textile Industries; Increasing Market Penetration of Specialty Black; Surge in Demand from Tire Industry.
6. What are the notable trends driving market growth?
Increasing Demand for Tires and Industrial Rubber Products.
7. Are there any restraints impacting market growth?
Growing Application in Fiber and Textile Industries; Increasing Market Penetration of Specialty Black; Surge in Demand from Tire Industry.
8. Can you provide examples of recent developments in the market?
April 2023: Phillips Carbon Black - a part of RP-Sanjiv Goenka Group, opened a new production facility in Tamil Nadu, India, to start the commercial production of carbon black. The company is expected to reach a production level of 147 kilotons annually in 2023.
9. What pricing options are available for accessing the report?
Pricing options include single-user, multi-user, and enterprise licenses priced at USD 4750, USD 5250, and USD 8750 respectively.
10. Is the market size provided in terms of value or volume?
The market size is provided in terms of value, measured in million.
11. Are there any specific market keywords associated with the report?
Yes, the market keyword associated with the report is "Asia-Pacific Carbon Black Market," which aids in identifying and referencing the specific market segment covered.
12. How do I determine which pricing option suits my needs best?
The pricing options vary based on user requirements and access needs. Individual users may opt for single-user licenses, while businesses requiring broader access may choose multi-user or enterprise licenses for cost-effective access to the report.
13. Are there any additional resources or data provided in the Asia-Pacific Carbon Black Market report?
While the report offers comprehensive insights, it's advisable to review the specific contents or supplementary materials provided to ascertain if additional resources or data are available.
14. How can I stay updated on further developments or reports in the Asia-Pacific Carbon Black Market?
To stay informed about further developments, trends, and reports in the Asia-Pacific Carbon Black Market, consider subscribing to industry newsletters, following relevant companies and organizations, or regularly checking reputable industry news sources and publications.
Methodology
Step 1 - Identification of Relevant Samples Size from Population Database


Step 2 - Approaches for Defining Global Market Size (Value, Volume* & Price*)

Note*: In applicable scenarios
Step 3 - Data Sources
Primary Research
- Web Analytics
- Survey Reports
- Research Institute
- Latest Research Reports
- Opinion Leaders
Secondary Research
- Annual Reports
- White Paper
- Latest Press Release
- Industry Association
- Paid Database
- Investor Presentations

Step 4 - Data Triangulation
Involves using different sources of information in order to increase the validity of a study
These sources are likely to be stakeholders in a program - participants, other researchers, program staff, other community members, and so on.
Then we put all data in single framework & apply various statistical tools to find out the dynamic on the market.
During the analysis stage, feedback from the stakeholder groups would be compared to determine areas of agreement as well as areas of divergence