

Key Insights
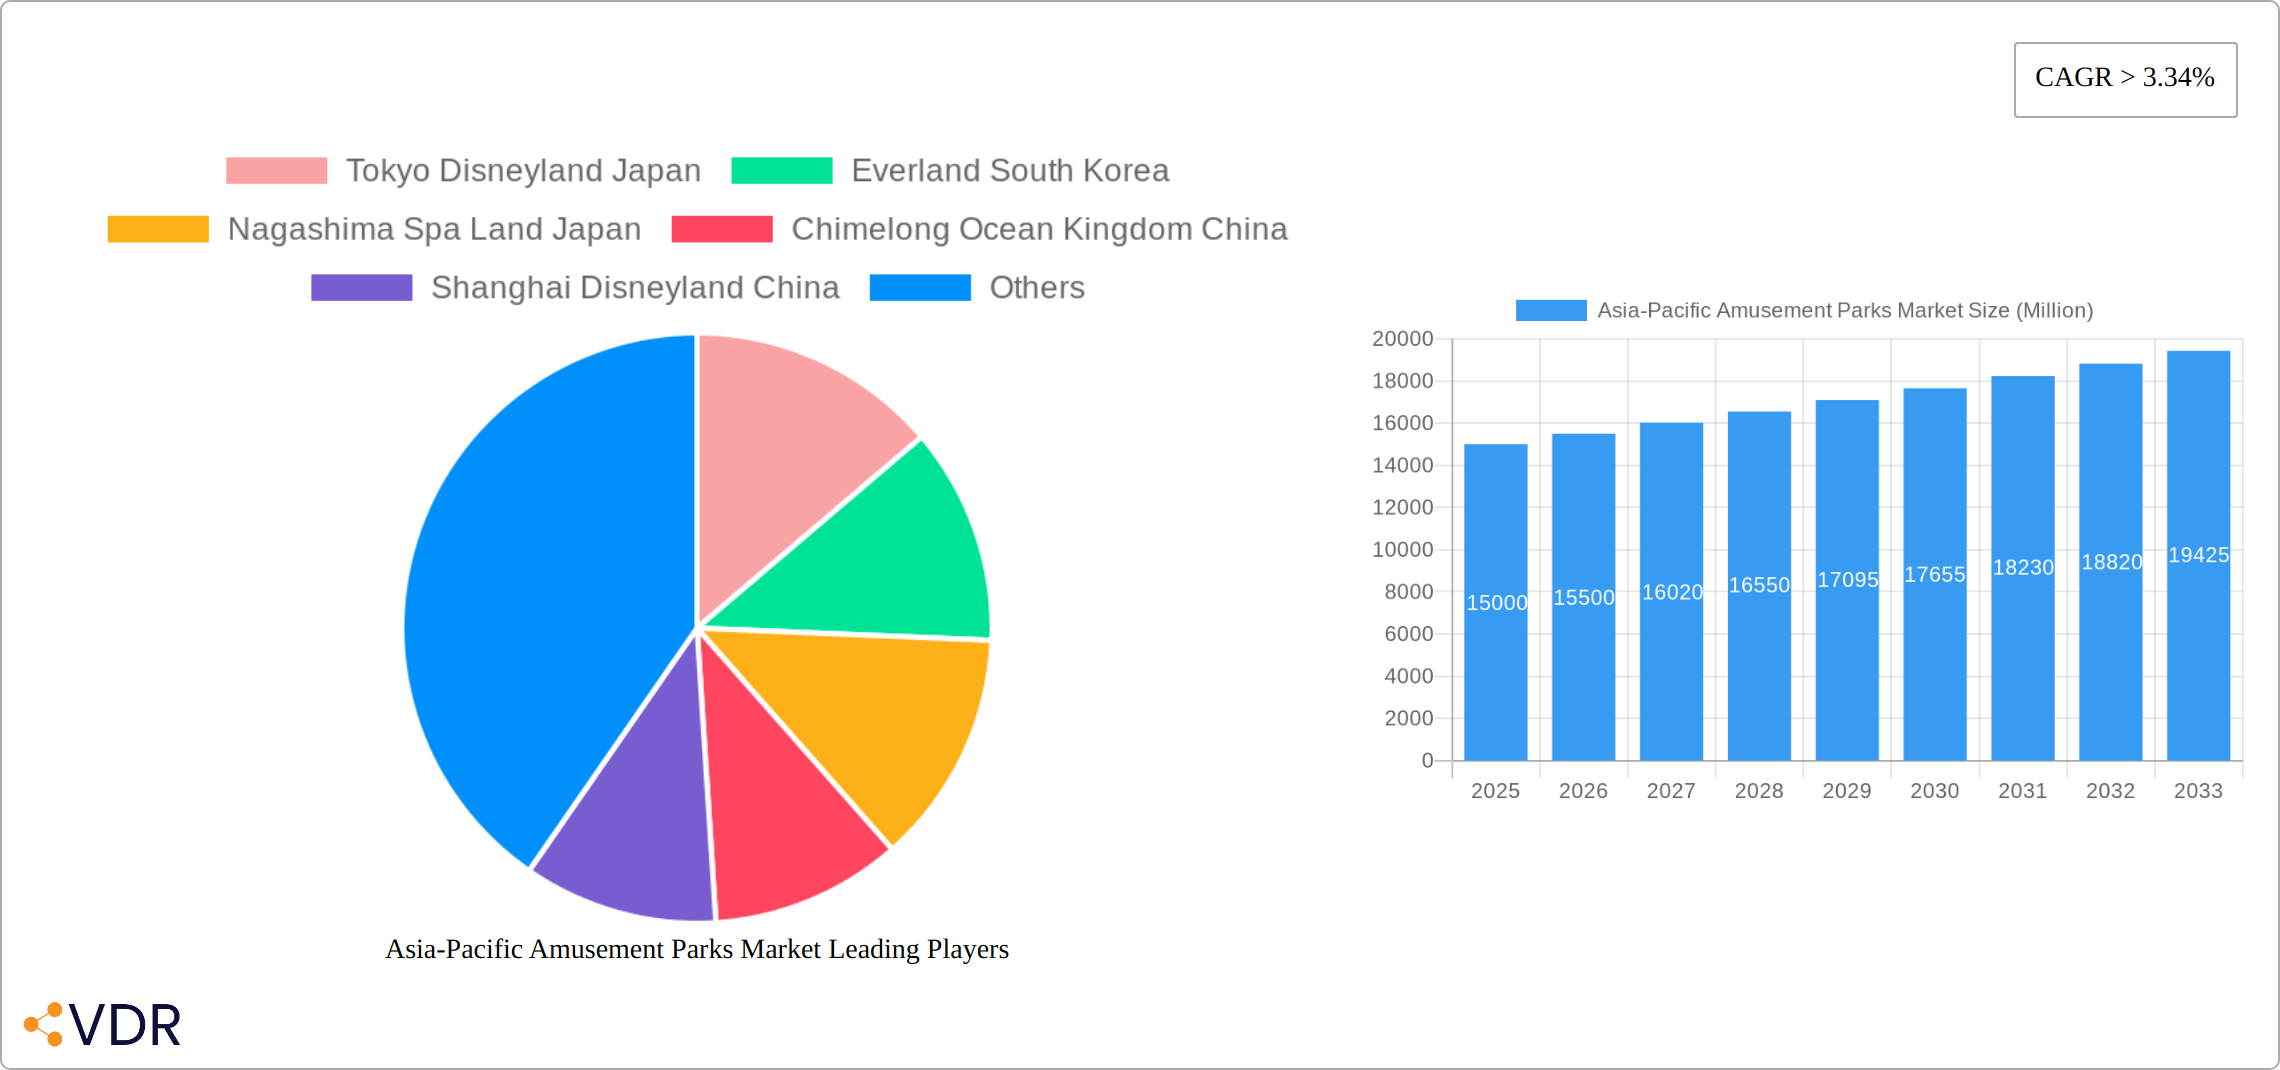
The Asia-Pacific amusement park market is poised for significant expansion, projected to achieve a Compound Annual Growth Rate (CAGR) of 8.8%. In the base year 2024, the market size was valued at 40687.9 million. This growth is propelled by rising disposable incomes and an expanding middle class across the region, particularly in developing economies. Enhanced visitor experiences are driven by innovative ride technologies, themed attractions, and strategic park investments. The market is segmented by country (Japan, India, China, Rest of Asia-Pacific), ride type (mechanical, water, others), age group, and revenue stream (tickets, F&B, merchandise, hospitality). Key players include Tokyo Disneyland, Everland, and OCT Happy Valley, capitalizing on strong brand recognition and established infrastructure.
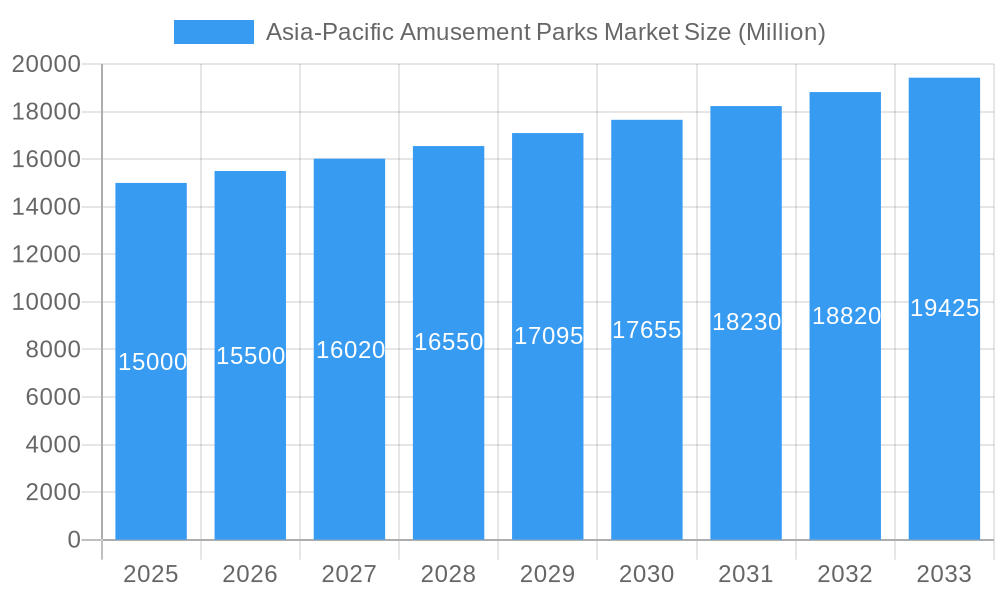
Asia-Pacific Amusement Parks Market Market Size (In Billion)
Challenges include economic volatility, geopolitical instability, and intense competition, requiring continuous innovation and strategic marketing. Emerging sustainability concerns also necessitate environmentally responsible practices. To address these, amusement parks are integrating technology, offering immersive experiences, and prioritizing guest satisfaction for sustained profitability. Future success depends on adapting to evolving consumer preferences, effective marketing, and sustainable operations. A diversified revenue model, encompassing food & beverages, merchandise, and hospitality, is essential for financial resilience.
Asia-Pacific Amusement Parks Market Company Market Share
Asia-Pacific Amusement Parks Market: A Comprehensive Market Report (2019-2033)
This comprehensive report provides an in-depth analysis of the Asia-Pacific amusement parks market, encompassing market dynamics, growth trends, dominant segments, and key players. With a study period spanning 2019-2033, a base year of 2025, and a forecast period of 2025-2033, this report offers invaluable insights for industry professionals, investors, and strategists. The market is segmented by country (Japan, India, China, Rest of Asia-Pacific), ride type (Mechanical Rides, Water Rides, Other Rides), age group (Upto 18 years, 19 to 35 years, 36 to 50 years, 51 to 65 years, More than 65 years), and revenue source (Tickets, Food & Beverages, Merchandise, Hotels/Resorts, Others). The total market value in 2025 is estimated at xx Million.
Asia-Pacific Amusement Parks Market Dynamics & Structure
The Asia-Pacific amusement park market is characterized by a dynamic interplay of factors influencing its structure and growth. Market concentration is relatively high, with a few major players dominating, particularly in Japan and China. Technological innovation, including advanced ride technologies and immersive experiences, is a key driver, while regulatory frameworks concerning safety and environmental standards play a significant role. Competitive product substitutes, such as virtual reality gaming and other entertainment options, pose a challenge. The end-user demographic is diverse, ranging from families with young children to young adults and senior citizens. Furthermore, M&A activity has been notable, reflecting consolidation trends within the industry.
- Market Concentration: Highly concentrated, with a few major players holding significant market share. (Specific market share data for top 3 players will be provided in the full report).
- Technological Innovation: Significant investments in new ride technologies, virtual reality, and augmented reality experiences are driving growth.
- Regulatory Landscape: Stringent safety regulations and environmental standards impact operational costs and expansion plans.
- Competitive Substitutes: The rise of alternative entertainment options influences consumer choices and market dynamics.
- End-User Demographics: A diverse demographic profile, with varying preferences influencing park design and offerings.
- M&A Activity: Several significant mergers and acquisitions have occurred recently, indicating industry consolidation. (The full report will detail specific M&A deals and their impact).
Asia-Pacific Amusement Parks Market Growth Trends & Insights
The Asia-Pacific amusement parks market is experiencing robust growth, driven by increasing disposable incomes, rising tourism, and the growing popularity of themed entertainment. The market size has exhibited a [CAGR]% growth from 2019 to 2024 and is projected to maintain a [CAGR]% growth from 2025 to 2033. Technological advancements such as interactive rides, virtual reality experiences, and personalized entertainment options are fueling adoption rates. Consumer behavior is evolving towards seeking unique and immersive experiences, driving demand for innovative park designs and offerings. Market penetration varies significantly across countries, with mature markets like Japan and China exhibiting higher penetration levels compared to emerging markets.
Dominant Regions, Countries, or Segments in Asia-Pacific Amusement Parks Market
Japan and China are the dominant markets in the Asia-Pacific amusement park sector, accounting for the largest market share. Within these countries, major cities with established tourism infrastructure and high population densities drive the most significant growth. The Mechanical Rides segment constitutes a significant portion of the overall market, driven by continuous innovation in ride technology. The 19-35 age group represents a substantial customer base, driven by their disposable income and demand for entertainment. Ticket sales remain the dominant revenue source, although Food & Beverages and Merchandise sales are also important.
- Key Drivers in Japan: Strong tourism sector, high disposable incomes, and established theme park infrastructure.
- Key Drivers in China: Rapid economic growth, increasing urbanization, and a growing middle class with higher disposable incomes.
- Mechanical Rides Dominance: Constant innovation in ride design and technology attracts visitors.
- 19-35 Year Old Segment: This demographic represents a major consumer base for amusement parks.
- Ticket Sales Revenue: Despite growth in other revenue sources, ticket sales remain the most substantial income stream.
Asia-Pacific Amusement Parks Market Product Landscape
The Asia-Pacific amusement park landscape is experiencing dynamic evolution, driven by a relentless pursuit of enhanced visitor experiences. Innovation is at the forefront, with a focus on cutting-edge ride technologies, interactive and immersive shows, compelling storytelling, and thematically rich lands. Parks are increasingly leveraging technological advancements such as virtual reality (VR) and augmented reality (AR) to create unique and memorable experiences. Beyond attractions, a significant emphasis is placed on optimizing operational efficiency, personalizing guest services through data analytics, and developing customized guest journeys to maximize revenue generation and customer loyalty.
Key Drivers, Barriers & Challenges in Asia-Pacific Amusement Parks Market
Key Drivers: Rising disposable incomes, growing tourism, technological advancements, government support for tourism infrastructure, and increasing demand for leisure activities are key market drivers.
Key Challenges: Intense competition among park operators, fluctuating tourism patterns, high operational costs, and maintaining stringent safety standards are major challenges. Supply chain disruptions have also impacted operations and costs. Regulatory hurdles and varying levels of economic development across the region contribute to uneven growth.
Emerging Opportunities in Asia-Pacific Amusement Parks Market
Significant untapped potential exists within the Asia-Pacific region, particularly in rapidly developing Southeast Asian markets. Creating unique themed experiences that resonate with the diverse cultural landscapes and demographics of the region presents a substantial opportunity. This includes developing personalized experiences through innovative technology, exploring the potential of smaller-scale, niche amusement parks, and creating integrated resort experiences that offer a wider range of entertainment and hospitality options. Furthermore, strategic collaborations with local communities and businesses can foster stronger ties and enhance the authenticity of the park's offerings.
Growth Accelerators in the Asia-Pacific Amusement Parks Market Industry
Strategic partnerships and collaborations are vital catalysts for growth within the industry. The synergy between technological advancements and sophisticated data analytics allows operators to personalize guest experiences, optimize operational efficiency, and anticipate future trends. Expansion into new, underserved markets and diversification of revenue streams—such as incorporating retail, dining, and event spaces—contribute significantly to overall market expansion. Crucially, supportive government policies and investments in tourism infrastructure are essential for fostering sustainable long-term growth and attracting both domestic and international visitors.
Key Players Shaping the Asia-Pacific Amusement Parks Market Market
- Tokyo Disneyland (Japan)
- Everland (South Korea)
- Nagashima Spa Land (Japan)
- Chimelong Ocean Kingdom (China)
- Shanghai Disneyland (China)
- OCT Happy Valley (Beijing, China)
- Chimelong Paradise (China)
- OCT Happy Valley (Shenzhen, China)
- Universal Studios Japan (Japan)
- Tokyo DisneySea (Japan)
- Ocean Park Hong Kong (Hong Kong)
- Gardens by the Bay (Singapore)
Notable Milestones in Asia-Pacific Amusement Parks Market Sector
- Nov 2022: The Walt Disney Company Asia Pacific expanded its collaboration with Kodansha to include Japanese anime, signaling a strategic move to leverage popular culture for increased market appeal.
- Aug 2022: Hong Kong-headquartered PAG acquired a Japanese theme park for USD 720 million, indicating investor confidence and post-pandemic recovery within the industry.
In-Depth Asia-Pacific Amusement Parks Market Market Outlook
The Asia-Pacific amusement parks market is poised for substantial growth in the coming years, fueled by the converging forces of a burgeoning middle class, improving regional infrastructure, and the continuous advancement of technology. These factors create a fertile ground for expansion and innovation within the sector. Sustained success will hinge on the ability of operators to forge strategic partnerships, diversify revenue streams, and prioritize the creation of exceptional, immersive guest experiences that cater to the diverse preferences of the region's population. A keen focus on sustainability and responsible tourism practices will also be increasingly important for long-term market leadership.
Asia-Pacific Amusement Parks Market Segmentation
-
1. Rides
- 1.1. Mechanical Rides
- 1.2. Water Rides
- 1.3. Other Rides
-
2. Age
- 2.1. Upto 18 years
- 2.2. 19 to 35 years
- 2.3. 36 to 50 years
- 2.4. 51 to 65 years
- 2.5. More than 65 years
-
3. Revenue Source
- 3.1. Tickets
- 3.2. Food & Beverages
- 3.3. Merchandise
- 3.4. Hotels/Resorts
- 3.5. Others
Asia-Pacific Amusement Parks Market Segmentation By Geography
-
1. Asia Pacific
- 1.1. China
- 1.2. Japan
- 1.3. South Korea
- 1.4. India
- 1.5. Australia
- 1.6. New Zealand
- 1.7. Indonesia
- 1.8. Malaysia
- 1.9. Singapore
- 1.10. Thailand
- 1.11. Vietnam
- 1.12. Philippines
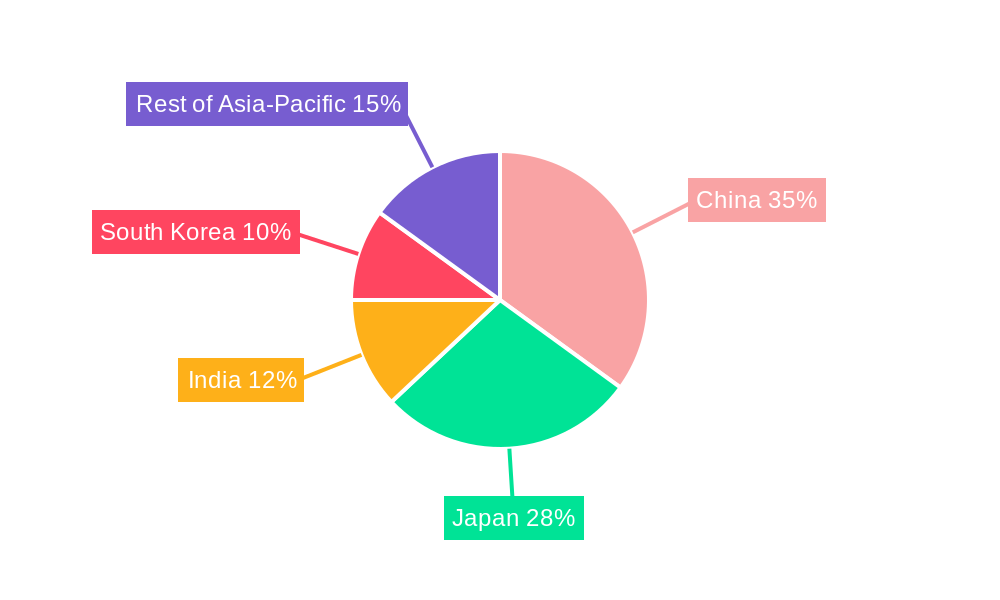
Asia-Pacific Amusement Parks Market Regional Market Share
Geographic Coverage of Asia-Pacific Amusement Parks Market
Asia-Pacific Amusement Parks Market REPORT HIGHLIGHTS
| Aspects | Details |
|---|---|
| Study Period | 2020-2034 |
| Base Year | 2025 |
| Estimated Year | 2026 |
| Forecast Period | 2026-2034 |
| Historical Period | 2020-2025 |
| Growth Rate | CAGR of 8.8% from 2020-2034 |
| Segmentation |
|
Table of Contents
- 1. Introduction
- 1.1. Research Scope
- 1.2. Market Segmentation
- 1.3. Research Objective
- 1.4. Definitions and Assumptions
- 2. Executive Summary
- 2.1. Market Snapshot
- 3. Market Dynamics
- 3.1. Market Drivers
- 3.2. Market Restrains
- 3.3. Market Trends
- 3.4. Market Opportunities
- 4. Market Factor Analysis
- 4.1. Porters Five Forces
- 4.1.1. Bargaining Power of Suppliers
- 4.1.2. Bargaining Power of Buyers
- 4.1.3. Threat of New Entrants
- 4.1.4. Threat of Substitutes
- 4.1.5. Competitive Rivalry
- 4.2. PESTEL analysis
- 4.3. BCG Analysis
- 4.3.1. Stars (High Growth, High Market Share)
- 4.3.2. Cash Cows (Low Growth, High Market Share)
- 4.3.3. Question Mark (High Growth, Low Market Share)
- 4.3.4. Dogs (Low Growth, Low Market Share)
- 4.4. Ansoff Matrix Analysis
- 4.5. Supply Chain Analysis
- 4.6. Regulatory Landscape
- 4.7. Current Market Potential and Opportunity Assessment (TAM–SAM–SOM Framework)
- 4.8. VDR Analyst Note
- 4.1. Porters Five Forces
- 5. Market Analysis, Insights and Forecast 2021-2033
- 5.1. Market Analysis, Insights and Forecast - by Rides
- 5.1.1. Mechanical Rides
- 5.1.2. Water Rides
- 5.1.3. Other Rides
- 5.2. Market Analysis, Insights and Forecast - by Age
- 5.2.1. Upto 18 years
- 5.2.2. 19 to 35 years
- 5.2.3. 36 to 50 years
- 5.2.4. 51 to 65 years
- 5.2.5. More than 65 years
- 5.3. Market Analysis, Insights and Forecast - by Revenue Source
- 5.3.1. Tickets
- 5.3.2. Food & Beverages
- 5.3.3. Merchandise
- 5.3.4. Hotels/Resorts
- 5.3.5. Others
- 5.4. Market Analysis, Insights and Forecast - by Region
- 5.4.1. Asia Pacific
- 5.1. Market Analysis, Insights and Forecast - by Rides
- 6. Asia-Pacific Amusement Parks Market Analysis, Insights and Forecast, 2021-2033
- 6.1. Market Analysis, Insights and Forecast - by Rides
- 6.1.1. Mechanical Rides
- 6.1.2. Water Rides
- 6.1.3. Other Rides
- 6.2. Market Analysis, Insights and Forecast - by Age
- 6.2.1. Upto 18 years
- 6.2.2. 19 to 35 years
- 6.2.3. 36 to 50 years
- 6.2.4. 51 to 65 years
- 6.2.5. More than 65 years
- 6.3. Market Analysis, Insights and Forecast - by Revenue Source
- 6.3.1. Tickets
- 6.3.2. Food & Beverages
- 6.3.3. Merchandise
- 6.3.4. Hotels/Resorts
- 6.3.5. Others
- 6.1. Market Analysis, Insights and Forecast - by Rides
- 7. Competitive Analysis
- 7.1. Company Profiles
- 7.1.1 Tokyo Disneyland Japan
- 7.1.1.1. Company Overview
- 7.1.1.2. Products
- 7.1.1.3. Company Financials
- 7.1.1.4. SWOT Analysis
- 7.1.2 Everland South Korea
- 7.1.2.1. Company Overview
- 7.1.2.2. Products
- 7.1.2.3. Company Financials
- 7.1.2.4. SWOT Analysis
- 7.1.3 Nagashima Spa Land Japan
- 7.1.3.1. Company Overview
- 7.1.3.2. Products
- 7.1.3.3. Company Financials
- 7.1.3.4. SWOT Analysis
- 7.1.4 Chimelong Ocean Kingdom China
- 7.1.4.1. Company Overview
- 7.1.4.2. Products
- 7.1.4.3. Company Financials
- 7.1.4.4. SWOT Analysis
- 7.1.5 Shanghai Disneyland China
- 7.1.5.1. Company Overview
- 7.1.5.2. Products
- 7.1.5.3. Company Financials
- 7.1.5.4. SWOT Analysis
- 7.1.6 OCT Happy Valley Beijing China
- 7.1.6.1. Company Overview
- 7.1.6.2. Products
- 7.1.6.3. Company Financials
- 7.1.6.4. SWOT Analysis
- 7.1.7 Chimelong Paradise China
- 7.1.7.1. Company Overview
- 7.1.7.2. Products
- 7.1.7.3. Company Financials
- 7.1.7.4. SWOT Analysis
- 7.1.8 OCT Happy Valley Shenzhen China**List Not Exhaustive
- 7.1.8.1. Company Overview
- 7.1.8.2. Products
- 7.1.8.3. Company Financials
- 7.1.8.4. SWOT Analysis
- 7.1.9 Universal Studios Japan
- 7.1.9.1. Company Overview
- 7.1.9.2. Products
- 7.1.9.3. Company Financials
- 7.1.9.4. SWOT Analysis
- 7.1.10 Tokyo Disneysea Japan
- 7.1.10.1. Company Overview
- 7.1.10.2. Products
- 7.1.10.3. Company Financials
- 7.1.10.4. SWOT Analysis
- 7.1.1 Tokyo Disneyland Japan
- 7.2. Market Entropy
- 7.2.1 Company's Key Areas Served
- 7.2.2 Recent Developments
- 7.3. Company Market Share Analysis 2025
- 7.3.1 Top 5 Companies Market Share Analysis
- 7.3.2 Top 3 Companies Market Share Analysis
- 7.4. List of Potential Customers
- 8. Research Methodology
List of Figures
- Figure 1: Asia-Pacific Amusement Parks Market Revenue Breakdown (million, %) by Product 2025 & 2033
- Figure 2: Asia-Pacific Amusement Parks Market Share (%) by Company 2025
List of Tables
- Table 1: Asia-Pacific Amusement Parks Market Revenue million Forecast, by Rides 2020 & 2033
- Table 2: Asia-Pacific Amusement Parks Market Revenue million Forecast, by Age 2020 & 2033
- Table 3: Asia-Pacific Amusement Parks Market Revenue million Forecast, by Revenue Source 2020 & 2033
- Table 4: Asia-Pacific Amusement Parks Market Revenue million Forecast, by Region 2020 & 2033
- Table 5: Asia-Pacific Amusement Parks Market Revenue million Forecast, by Rides 2020 & 2033
- Table 6: Asia-Pacific Amusement Parks Market Revenue million Forecast, by Age 2020 & 2033
- Table 7: Asia-Pacific Amusement Parks Market Revenue million Forecast, by Revenue Source 2020 & 2033
- Table 8: Asia-Pacific Amusement Parks Market Revenue million Forecast, by Country 2020 & 2033
- Table 9: China Asia-Pacific Amusement Parks Market Revenue (million) Forecast, by Application 2020 & 2033
- Table 10: Japan Asia-Pacific Amusement Parks Market Revenue (million) Forecast, by Application 2020 & 2033
- Table 11: South Korea Asia-Pacific Amusement Parks Market Revenue (million) Forecast, by Application 2020 & 2033
- Table 12: India Asia-Pacific Amusement Parks Market Revenue (million) Forecast, by Application 2020 & 2033
- Table 13: Australia Asia-Pacific Amusement Parks Market Revenue (million) Forecast, by Application 2020 & 2033
- Table 14: New Zealand Asia-Pacific Amusement Parks Market Revenue (million) Forecast, by Application 2020 & 2033
- Table 15: Indonesia Asia-Pacific Amusement Parks Market Revenue (million) Forecast, by Application 2020 & 2033
- Table 16: Malaysia Asia-Pacific Amusement Parks Market Revenue (million) Forecast, by Application 2020 & 2033
- Table 17: Singapore Asia-Pacific Amusement Parks Market Revenue (million) Forecast, by Application 2020 & 2033
- Table 18: Thailand Asia-Pacific Amusement Parks Market Revenue (million) Forecast, by Application 2020 & 2033
- Table 19: Vietnam Asia-Pacific Amusement Parks Market Revenue (million) Forecast, by Application 2020 & 2033
- Table 20: Philippines Asia-Pacific Amusement Parks Market Revenue (million) Forecast, by Application 2020 & 2033
Frequently Asked Questions
1. What is the projected Compound Annual Growth Rate (CAGR) of the Asia-Pacific Amusement Parks Market?
The projected CAGR is approximately 8.8%.
2. Which companies are prominent players in the Asia-Pacific Amusement Parks Market?
Key companies in the market include Tokyo Disneyland Japan, Everland South Korea, Nagashima Spa Land Japan, Chimelong Ocean Kingdom China, Shanghai Disneyland China, OCT Happy Valley Beijing China, Chimelong Paradise China, OCT Happy Valley Shenzhen China**List Not Exhaustive, Universal Studios Japan, Tokyo Disneysea Japan.
3. What are the main segments of the Asia-Pacific Amusement Parks Market?
The market segments include Rides, Age, Revenue Source.
4. Can you provide details about the market size?
The market size is estimated to be USD 40687.9 million as of 2022.
5. What are some drivers contributing to market growth?
Internet Penetration is Driving the Market.
6. What are the notable trends driving market growth?
Rising Water Parks and Rides.
7. Are there any restraints impacting market growth?
Government Regulations are Restraining the Market.
8. Can you provide examples of recent developments in the market?
Nov 2022: The Walt Disney Company Asia Pacific revealed an expansion of its 70-year collaboration with publishing house Kodansha to include Japanese anime. Disney and Kodansha worked together in the publishing space and will now venture into the world of anime.
9. What pricing options are available for accessing the report?
Pricing options include single-user, multi-user, and enterprise licenses priced at USD 4750, USD 4950, and USD 6800 respectively.
10. Is the market size provided in terms of value or volume?
The market size is provided in terms of value, measured in million.
11. Are there any specific market keywords associated with the report?
Yes, the market keyword associated with the report is "Asia-Pacific Amusement Parks Market," which aids in identifying and referencing the specific market segment covered.
12. How do I determine which pricing option suits my needs best?
The pricing options vary based on user requirements and access needs. Individual users may opt for single-user licenses, while businesses requiring broader access may choose multi-user or enterprise licenses for cost-effective access to the report.
13. Are there any additional resources or data provided in the Asia-Pacific Amusement Parks Market report?
While the report offers comprehensive insights, it's advisable to review the specific contents or supplementary materials provided to ascertain if additional resources or data are available.
14. How can I stay updated on further developments or reports in the Asia-Pacific Amusement Parks Market?
To stay informed about further developments, trends, and reports in the Asia-Pacific Amusement Parks Market, consider subscribing to industry newsletters, following relevant companies and organizations, or regularly checking reputable industry news sources and publications.
Methodology
Step 1 - Identification of Relevant Samples Size from Population Database


Step 2 - Approaches for Defining Global Market Size (Value, Volume* & Price*)

Note*: In applicable scenarios
Step 3 - Data Sources
Primary Research
- Web Analytics
- Survey Reports
- Research Institute
- Latest Research Reports
- Opinion Leaders
Secondary Research
- Annual Reports
- White Paper
- Latest Press Release
- Industry Association
- Paid Database
- Investor Presentations

Step 4 - Data Triangulation
Involves using different sources of information in order to increase the validity of a study
These sources are likely to be stakeholders in a program - participants, other researchers, program staff, other community members, and so on.
Then we put all data in single framework & apply various statistical tools to find out the dynamic on the market.
During the analysis stage, feedback from the stakeholder groups would be compared to determine areas of agreement as well as areas of divergence