

Key Insights
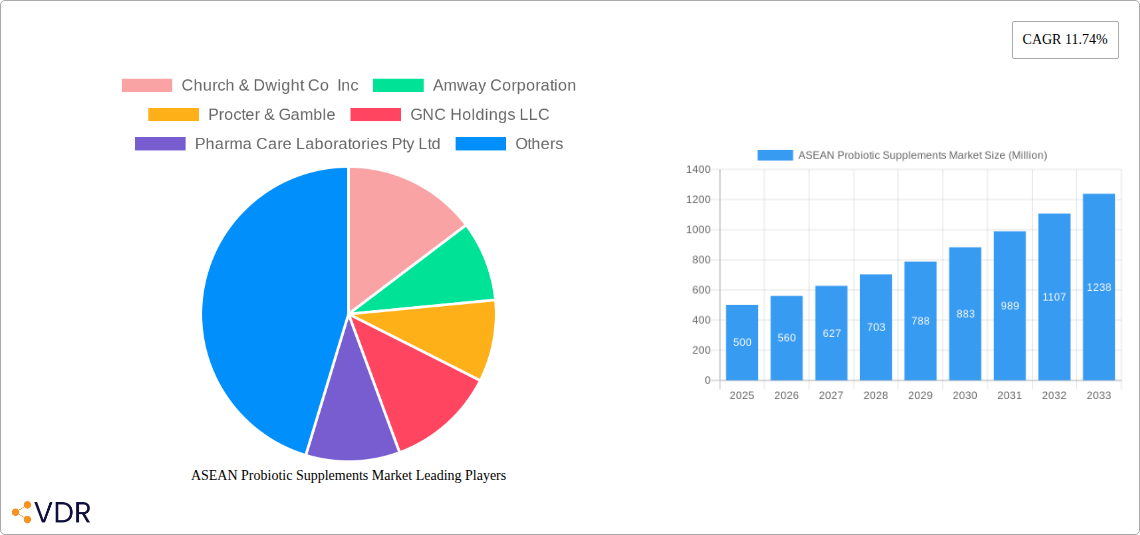
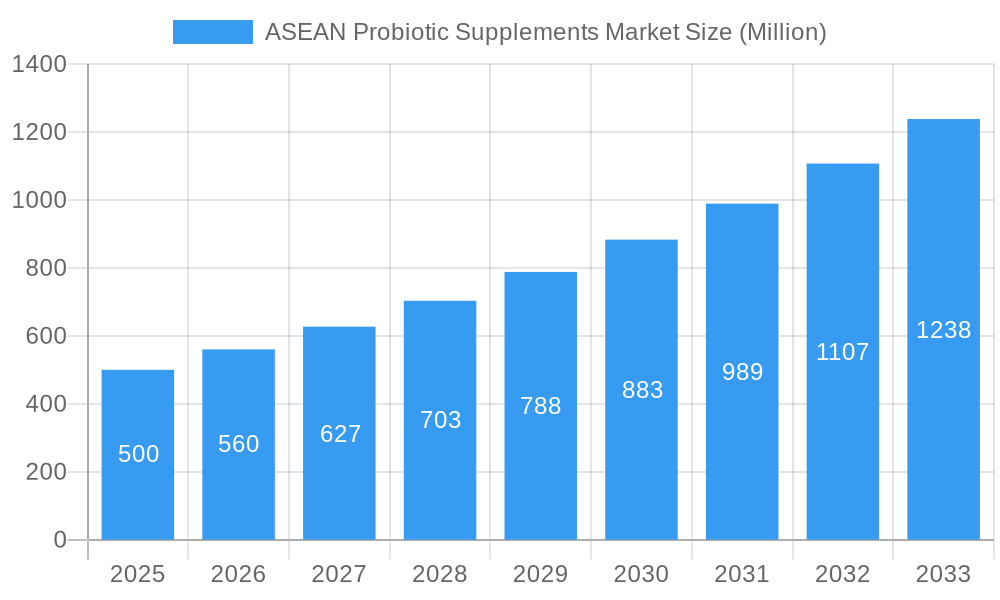
The ASEAN probiotic supplements market is experiencing robust growth, driven by increasing health consciousness, rising disposable incomes, and a growing awareness of the gut-microbiome's impact on overall well-being. The market's expansion is fueled by diverse product forms, including tablets/capsules, powders, and liquids, catering to varied consumer preferences. Supermarkets/hypermarkets and pharmacies/drug stores constitute major distribution channels, although online sales are witnessing significant expansion, reflecting the region's increasing digital penetration. While the exact market size for ASEAN in 2025 is unavailable, considering the global CAGR of 11.74% and the strong growth trajectory of health and wellness products in the region, a reasonable estimate places the ASEAN market value at approximately $500 million USD for 2025. This is a conservative estimation, considering that other mature markets have far higher penetration rates for such products. Further growth is anticipated due to increasing demand for functional foods and beverages incorporating probiotics and innovative product formulations aiming to improve efficacy and palatability.
ASEAN Probiotic Supplements Market Market Size (In Million)
However, challenges remain. Regulatory inconsistencies across different ASEAN nations may hinder market standardization and expansion. Furthermore, price sensitivity and varying levels of consumer awareness regarding probiotic benefits across different socioeconomic groups present hurdles to widespread adoption. The competitive landscape is dynamic, with both multinational corporations (e.g., Nestle, Reckitt Benckiser) and regional players vying for market share. Future growth depends on addressing regulatory issues, enhancing consumer education, and promoting product innovation to meet evolving consumer needs and preferences. This includes addressing concerns over product quality and efficacy with better regulation and increased transparency. The market shows significant promise, poised for substantial growth in the coming years based on current trends and the underlying market drivers.
ASEAN Probiotic Supplements Market Company Market Share
ASEAN Probiotic Supplements Market: A Comprehensive Market Report (2019-2033)
This in-depth report provides a comprehensive analysis of the ASEAN probiotic supplements market, encompassing market dynamics, growth trends, regional dominance, product landscape, key players, and future outlook. The study period covers 2019-2033, with 2025 as the base and estimated year. The report is invaluable for industry professionals, investors, and anyone seeking a detailed understanding of this rapidly evolving market. Market values are presented in million units.
ASEAN Probiotic Supplements Market Dynamics & Structure
The ASEAN probiotic supplements market is characterized by a moderately concentrated landscape with key players like Church & Dwight Co Inc, Amway Corporation, Procter & Gamble, GNC Holdings LLC, Pharma Care Laboratories Pty Ltd, Reckitt Benckiser LLC, Nature's Way Products LLC, Nestle SA, Blackmores Probiotics, and Bio Gaia holding significant market share. However, the market also features numerous smaller players and emerging brands, driving competition.
- Market Concentration: The top 5 players hold an estimated xx% market share in 2025, indicating a moderately consolidated market.
- Technological Innovation: Advancements in probiotic strain identification, formulation technologies (e.g., encapsulation for improved stability), and personalized nutrition are key drivers. However, challenges remain in ensuring consistent efficacy and addressing consumer concerns regarding product authenticity and quality.
- Regulatory Framework: Varying regulations across ASEAN countries create complexities for market entry and product standardization. Harmonization efforts are ongoing, but inconsistencies remain.
- Competitive Product Substitutes: Other dietary supplements, functional foods, and traditional remedies compete for consumer attention and market share.
- End-User Demographics: Growing health consciousness, rising disposable incomes, and increased awareness of gut health are boosting demand, particularly among health-conscious millennials and older adults.
- M&A Trends: The market has witnessed a moderate level of M&A activity in recent years, with xx major deals recorded between 2019 and 2024. These acquisitions primarily aim to expand market reach, strengthen product portfolios, and access new technologies.
ASEAN Probiotic Supplements Market Growth Trends & Insights
The ASEAN probiotic supplements market is experiencing robust growth, driven by increasing health awareness, rising disposable incomes, and favorable demographics. The market size expanded from xx million units in 2019 to xx million units in 2024, exhibiting a CAGR of xx%. This growth trajectory is projected to continue, with the market expected to reach xx million units by 2033, indicating a CAGR of xx% during the forecast period (2025-2033). Market penetration remains relatively low, offering significant potential for future expansion. The adoption of online channels is also accelerating, creating new avenues for market access. Technological advancements in probiotic strains and delivery systems are influencing product innovation and consumer preference shifts towards targeted probiotic solutions for specific health concerns.
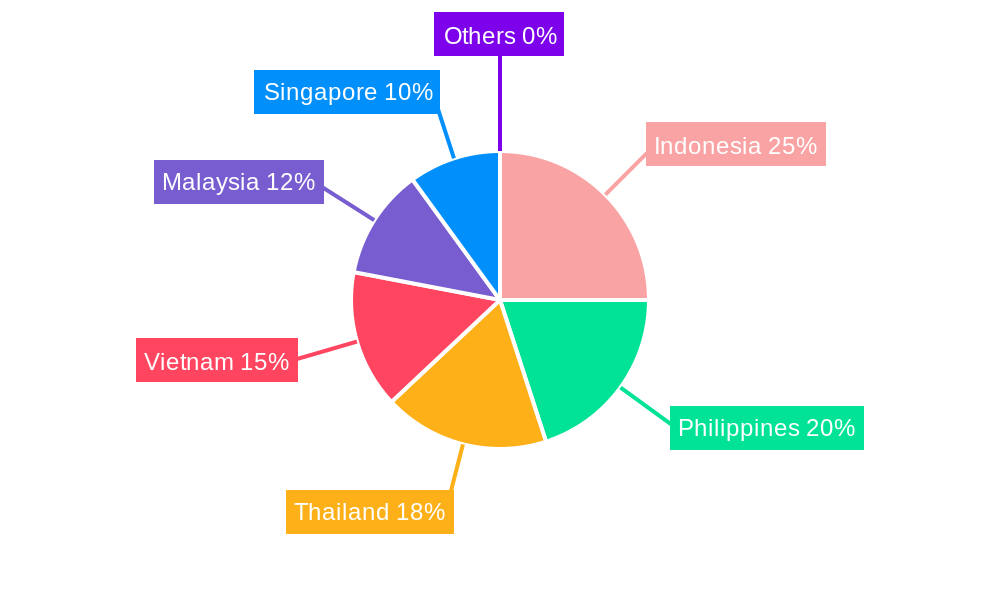
Dominant Regions, Countries, or Segments in ASEAN Probiotic Supplements Market
Within the ASEAN region, Indonesia, Thailand, Vietnam, and Singapore are the leading markets for probiotic supplements. The growth is propelled by factors such as:
- Indonesia: High population, rising health consciousness, and increasing disposable incomes.
- Thailand: Strong healthcare infrastructure and growing awareness of preventive healthcare.
- Vietnam: Rapid economic growth and increasing adoption of Westernized lifestyles.
- Singapore: High per capita income and advanced healthcare system.
Distribution Channel Dominance: Pharmacies & drug stores currently hold the largest market share (xx%), followed by supermarkets/hypermarkets (xx%). Online stores are experiencing rapid growth, projected to reach xx% market share by 2033.
Product Form Dominance: Tablets/capsules remain the most popular product form (xx%), followed by powders (xx%). However, liquids and other innovative formats are gaining traction, driven by consumer preference for convenience and improved palatability.
ASEAN Probiotic Supplements Market Product Landscape
The ASEAN probiotic supplements market showcases a diverse product range, including tablets/capsules, powders, liquids, and other specialized formulations. Innovations focus on enhancing efficacy, stability, and delivery methods. Products are increasingly targeting specific health needs (e.g., gut health, immune support, oral health), with customized formulations and blends gaining popularity. Unique selling propositions often highlight patented probiotic strains, clinically proven benefits, and natural ingredients.
Key Drivers, Barriers & Challenges in ASEAN Probiotic Supplements Market
Key Drivers:
- Rising health consciousness among consumers.
- Increasing disposable incomes, especially in emerging economies.
- Growing awareness of the gut-brain axis and the role of probiotics in overall health.
- Technological innovations leading to improved product efficacy and delivery systems.
Key Challenges:
- Regulatory inconsistencies across ASEAN countries hinder standardization and market access.
- Concerns regarding product quality and authenticity remain a barrier to consumer adoption.
- Competition from other dietary supplements and traditional remedies.
- Supply chain complexities and potential for disruptions impact product availability and pricing.
Emerging Opportunities in ASEAN Probiotic Supplements Market
- Untapped markets: Rural areas and lower-income segments present significant growth potential with targeted marketing and affordability initiatives.
- Innovative applications: Probiotic-infused foods and beverages, personalized probiotic blends, and advanced delivery systems represent exciting new avenues.
- Evolving consumer preferences: Demand for clean label products, organic options, and sustainable packaging practices will shape future product development.
Growth Accelerators in the ASEAN Probiotic Supplements Market Industry
Technological breakthroughs in strain development and formulation, strategic partnerships to expand market reach and distribution channels, and successful marketing campaigns highlighting the benefits of probiotics are driving long-term growth. The expansion of e-commerce platforms also facilitates market access and provides new growth opportunities.
Key Players Shaping the ASEAN Probiotic Supplements Market Market
- Church & Dwight Co Inc
- Amway Corporation
- Procter & Gamble
- GNC Holdings LLC
- Pharma Care Laboratories Pty Ltd
- Reckitt Benckiser LLC
- Nature's Way Products LLC
- Nestle SA
- Blackmores Probiotics
- Bio Gaia
Notable Milestones in ASEAN Probiotic Supplements Market Sector
- October 2022: BioGaia AB launched BioGaia Prodentis lozenges in Indonesia, expanding its product portfolio and market presence.
- September 2022: NutiFood's acquisition of Cawells strengthens its position in the Vietnamese market and broadens its international reach.
- September 2021: BioGaia's partnership with Abbott expands its distribution network and access to medical professionals in Singapore.
In-Depth ASEAN Probiotic Supplements Market Market Outlook
The ASEAN probiotic supplements market is poised for continued strong growth, driven by increasing health awareness, expanding distribution channels, and ongoing product innovation. Strategic partnerships, expansion into untapped markets, and the development of personalized probiotic solutions will shape the future of this dynamic market, presenting significant opportunities for both established players and emerging brands.
ASEAN Probiotic Supplements Market Segmentation
-
1. Product Form
- 1.1. Tablets/Capsules
- 1.2. Powders
- 1.3. Liquids
- 1.4. Other Products
-
2. Distribution Channel
- 2.1. Supermarkets/Hypermarkets
- 2.2. Pharmacies and Drug Stores
- 2.3. Specialty Stores
- 2.4. Online Stores
- 2.5. Other Distribution Channels
-
3. Geography
- 3.1. Indonesia
- 3.2. Malaysia
- 3.3. Thailand
- 3.4. Vietnam
- 3.5. Singapore
- 3.6. Philippines
- 3.7. Rest of ASEAN
ASEAN Probiotic Supplements Market Segmentation By Geography
- 1. Indonesia
- 2. Malaysia
- 3. Thailand
- 4. Vietnam
- 5. Singapore
- 6. Philippines
- 7. Rest of ASEAN
ASEAN Probiotic Supplements Market Regional Market Share
Geographic Coverage of ASEAN Probiotic Supplements Market
ASEAN Probiotic Supplements Market REPORT HIGHLIGHTS
| Aspects | Details |
|---|---|
| Study Period | 2020-2034 |
| Base Year | 2025 |
| Estimated Year | 2026 |
| Forecast Period | 2026-2034 |
| Historical Period | 2020-2025 |
| Growth Rate | CAGR of 13.7% from 2020-2034 |
| Segmentation |
|
Table of Contents
- 1. Introduction
- 1.1. Research Scope
- 1.2. Market Segmentation
- 1.3. Research Objective
- 1.4. Definitions and Assumptions
- 2. Executive Summary
- 2.1. Market Snapshot
- 3. Market Dynamics
- 3.1. Market Drivers
- 3.2. Market Restrains
- 3.3. Market Trends
- 3.4. Market Opportunities
- 4. Market Factor Analysis
- 4.1. Porters Five Forces
- 4.1.1. Bargaining Power of Suppliers
- 4.1.2. Bargaining Power of Buyers
- 4.1.3. Threat of New Entrants
- 4.1.4. Threat of Substitutes
- 4.1.5. Competitive Rivalry
- 4.2. PESTEL analysis
- 4.3. BCG Analysis
- 4.3.1. Stars (High Growth, High Market Share)
- 4.3.2. Cash Cows (Low Growth, High Market Share)
- 4.3.3. Question Mark (High Growth, Low Market Share)
- 4.3.4. Dogs (Low Growth, Low Market Share)
- 4.4. Ansoff Matrix Analysis
- 4.5. Supply Chain Analysis
- 4.6. Regulatory Landscape
- 4.7. Current Market Potential and Opportunity Assessment (TAM–SAM–SOM Framework)
- 4.8. VDR Analyst Note
- 4.1. Porters Five Forces
- 5. Market Analysis, Insights and Forecast 2021-2033
- 5.1. Market Analysis, Insights and Forecast - by Product Form
- 5.1.1. Tablets/Capsules
- 5.1.2. Powders
- 5.1.3. Liquids
- 5.1.4. Other Products
- 5.2. Market Analysis, Insights and Forecast - by Distribution Channel
- 5.2.1. Supermarkets/Hypermarkets
- 5.2.2. Pharmacies and Drug Stores
- 5.2.3. Specialty Stores
- 5.2.4. Online Stores
- 5.2.5. Other Distribution Channels
- 5.3. Market Analysis, Insights and Forecast - by Geography
- 5.3.1. Indonesia
- 5.3.2. Malaysia
- 5.3.3. Thailand
- 5.3.4. Vietnam
- 5.3.5. Singapore
- 5.3.6. Philippines
- 5.3.7. Rest of ASEAN
- 5.4. Market Analysis, Insights and Forecast - by Region
- 5.4.1. Indonesia
- 5.4.2. Malaysia
- 5.4.3. Thailand
- 5.4.4. Vietnam
- 5.4.5. Singapore
- 5.4.6. Philippines
- 5.4.7. Rest of ASEAN
- 5.1. Market Analysis, Insights and Forecast - by Product Form
- 6. Global ASEAN Probiotic Supplements Market Analysis, Insights and Forecast, 2021-2033
- 6.1. Market Analysis, Insights and Forecast - by Product Form
- 6.1.1. Tablets/Capsules
- 6.1.2. Powders
- 6.1.3. Liquids
- 6.1.4. Other Products
- 6.2. Market Analysis, Insights and Forecast - by Distribution Channel
- 6.2.1. Supermarkets/Hypermarkets
- 6.2.2. Pharmacies and Drug Stores
- 6.2.3. Specialty Stores
- 6.2.4. Online Stores
- 6.2.5. Other Distribution Channels
- 6.3. Market Analysis, Insights and Forecast - by Geography
- 6.3.1. Indonesia
- 6.3.2. Malaysia
- 6.3.3. Thailand
- 6.3.4. Vietnam
- 6.3.5. Singapore
- 6.3.6. Philippines
- 6.3.7. Rest of ASEAN
- 6.1. Market Analysis, Insights and Forecast - by Product Form
- 7. Indonesia ASEAN Probiotic Supplements Market Analysis, Insights and Forecast, 2021-2033
- 7.1. Market Analysis, Insights and Forecast - by Product Form
- 7.1.1. Tablets/Capsules
- 7.1.2. Powders
- 7.1.3. Liquids
- 7.1.4. Other Products
- 7.2. Market Analysis, Insights and Forecast - by Distribution Channel
- 7.2.1. Supermarkets/Hypermarkets
- 7.2.2. Pharmacies and Drug Stores
- 7.2.3. Specialty Stores
- 7.2.4. Online Stores
- 7.2.5. Other Distribution Channels
- 7.3. Market Analysis, Insights and Forecast - by Geography
- 7.3.1. Indonesia
- 7.3.2. Malaysia
- 7.3.3. Thailand
- 7.3.4. Vietnam
- 7.3.5. Singapore
- 7.3.6. Philippines
- 7.3.7. Rest of ASEAN
- 7.1. Market Analysis, Insights and Forecast - by Product Form
- 8. Malaysia ASEAN Probiotic Supplements Market Analysis, Insights and Forecast, 2021-2033
- 8.1. Market Analysis, Insights and Forecast - by Product Form
- 8.1.1. Tablets/Capsules
- 8.1.2. Powders
- 8.1.3. Liquids
- 8.1.4. Other Products
- 8.2. Market Analysis, Insights and Forecast - by Distribution Channel
- 8.2.1. Supermarkets/Hypermarkets
- 8.2.2. Pharmacies and Drug Stores
- 8.2.3. Specialty Stores
- 8.2.4. Online Stores
- 8.2.5. Other Distribution Channels
- 8.3. Market Analysis, Insights and Forecast - by Geography
- 8.3.1. Indonesia
- 8.3.2. Malaysia
- 8.3.3. Thailand
- 8.3.4. Vietnam
- 8.3.5. Singapore
- 8.3.6. Philippines
- 8.3.7. Rest of ASEAN
- 8.1. Market Analysis, Insights and Forecast - by Product Form
- 9. Thailand ASEAN Probiotic Supplements Market Analysis, Insights and Forecast, 2021-2033
- 9.1. Market Analysis, Insights and Forecast - by Product Form
- 9.1.1. Tablets/Capsules
- 9.1.2. Powders
- 9.1.3. Liquids
- 9.1.4. Other Products
- 9.2. Market Analysis, Insights and Forecast - by Distribution Channel
- 9.2.1. Supermarkets/Hypermarkets
- 9.2.2. Pharmacies and Drug Stores
- 9.2.3. Specialty Stores
- 9.2.4. Online Stores
- 9.2.5. Other Distribution Channels
- 9.3. Market Analysis, Insights and Forecast - by Geography
- 9.3.1. Indonesia
- 9.3.2. Malaysia
- 9.3.3. Thailand
- 9.3.4. Vietnam
- 9.3.5. Singapore
- 9.3.6. Philippines
- 9.3.7. Rest of ASEAN
- 9.1. Market Analysis, Insights and Forecast - by Product Form
- 10. Vietnam ASEAN Probiotic Supplements Market Analysis, Insights and Forecast, 2021-2033
- 10.1. Market Analysis, Insights and Forecast - by Product Form
- 10.1.1. Tablets/Capsules
- 10.1.2. Powders
- 10.1.3. Liquids
- 10.1.4. Other Products
- 10.2. Market Analysis, Insights and Forecast - by Distribution Channel
- 10.2.1. Supermarkets/Hypermarkets
- 10.2.2. Pharmacies and Drug Stores
- 10.2.3. Specialty Stores
- 10.2.4. Online Stores
- 10.2.5. Other Distribution Channels
- 10.3. Market Analysis, Insights and Forecast - by Geography
- 10.3.1. Indonesia
- 10.3.2. Malaysia
- 10.3.3. Thailand
- 10.3.4. Vietnam
- 10.3.5. Singapore
- 10.3.6. Philippines
- 10.3.7. Rest of ASEAN
- 10.1. Market Analysis, Insights and Forecast - by Product Form
- 11. Singapore ASEAN Probiotic Supplements Market Analysis, Insights and Forecast, 2021-2033
- 11.1. Market Analysis, Insights and Forecast - by Product Form
- 11.1.1. Tablets/Capsules
- 11.1.2. Powders
- 11.1.3. Liquids
- 11.1.4. Other Products
- 11.2. Market Analysis, Insights and Forecast - by Distribution Channel
- 11.2.1. Supermarkets/Hypermarkets
- 11.2.2. Pharmacies and Drug Stores
- 11.2.3. Specialty Stores
- 11.2.4. Online Stores
- 11.2.5. Other Distribution Channels
- 11.3. Market Analysis, Insights and Forecast - by Geography
- 11.3.1. Indonesia
- 11.3.2. Malaysia
- 11.3.3. Thailand
- 11.3.4. Vietnam
- 11.3.5. Singapore
- 11.3.6. Philippines
- 11.3.7. Rest of ASEAN
- 11.1. Market Analysis, Insights and Forecast - by Product Form
- 12. Philippines ASEAN Probiotic Supplements Market Analysis, Insights and Forecast, 2021-2033
- 12.1. Market Analysis, Insights and Forecast - by Product Form
- 12.1.1. Tablets/Capsules
- 12.1.2. Powders
- 12.1.3. Liquids
- 12.1.4. Other Products
- 12.2. Market Analysis, Insights and Forecast - by Distribution Channel
- 12.2.1. Supermarkets/Hypermarkets
- 12.2.2. Pharmacies and Drug Stores
- 12.2.3. Specialty Stores
- 12.2.4. Online Stores
- 12.2.5. Other Distribution Channels
- 12.3. Market Analysis, Insights and Forecast - by Geography
- 12.3.1. Indonesia
- 12.3.2. Malaysia
- 12.3.3. Thailand
- 12.3.4. Vietnam
- 12.3.5. Singapore
- 12.3.6. Philippines
- 12.3.7. Rest of ASEAN
- 12.1. Market Analysis, Insights and Forecast - by Product Form
- 13. Rest of ASEAN ASEAN Probiotic Supplements Market Analysis, Insights and Forecast, 2021-2033
- 13.1. Market Analysis, Insights and Forecast - by Product Form
- 13.1.1. Tablets/Capsules
- 13.1.2. Powders
- 13.1.3. Liquids
- 13.1.4. Other Products
- 13.2. Market Analysis, Insights and Forecast - by Distribution Channel
- 13.2.1. Supermarkets/Hypermarkets
- 13.2.2. Pharmacies and Drug Stores
- 13.2.3. Specialty Stores
- 13.2.4. Online Stores
- 13.2.5. Other Distribution Channels
- 13.3. Market Analysis, Insights and Forecast - by Geography
- 13.3.1. Indonesia
- 13.3.2. Malaysia
- 13.3.3. Thailand
- 13.3.4. Vietnam
- 13.3.5. Singapore
- 13.3.6. Philippines
- 13.3.7. Rest of ASEAN
- 13.1. Market Analysis, Insights and Forecast - by Product Form
- 14. Competitive Analysis
- 14.1. Company Profiles
- 14.1.1 Church & Dwight Co Inc
- 14.1.1.1. Company Overview
- 14.1.1.2. Products
- 14.1.1.3. Company Financials
- 14.1.1.4. SWOT Analysis
- 14.1.2 Amway Corporation
- 14.1.2.1. Company Overview
- 14.1.2.2. Products
- 14.1.2.3. Company Financials
- 14.1.2.4. SWOT Analysis
- 14.1.3 Procter & Gamble
- 14.1.3.1. Company Overview
- 14.1.3.2. Products
- 14.1.3.3. Company Financials
- 14.1.3.4. SWOT Analysis
- 14.1.4 GNC Holdings LLC
- 14.1.4.1. Company Overview
- 14.1.4.2. Products
- 14.1.4.3. Company Financials
- 14.1.4.4. SWOT Analysis
- 14.1.5 Pharma Care Laboratories Pty Ltd
- 14.1.5.1. Company Overview
- 14.1.5.2. Products
- 14.1.5.3. Company Financials
- 14.1.5.4. SWOT Analysis
- 14.1.6 Reckitt Benckiser LLC
- 14.1.6.1. Company Overview
- 14.1.6.2. Products
- 14.1.6.3. Company Financials
- 14.1.6.4. SWOT Analysis
- 14.1.7 Nature's Way Products LLC
- 14.1.7.1. Company Overview
- 14.1.7.2. Products
- 14.1.7.3. Company Financials
- 14.1.7.4. SWOT Analysis
- 14.1.8 Nestle SA*List Not Exhaustive
- 14.1.8.1. Company Overview
- 14.1.8.2. Products
- 14.1.8.3. Company Financials
- 14.1.8.4. SWOT Analysis
- 14.1.9 Blackmores Probiotics
- 14.1.9.1. Company Overview
- 14.1.9.2. Products
- 14.1.9.3. Company Financials
- 14.1.9.4. SWOT Analysis
- 14.1.10 Bio Gaia
- 14.1.10.1. Company Overview
- 14.1.10.2. Products
- 14.1.10.3. Company Financials
- 14.1.10.4. SWOT Analysis
- 14.1.1 Church & Dwight Co Inc
- 14.2. Market Entropy
- 14.2.1 Company's Key Areas Served
- 14.2.2 Recent Developments
- 14.3. Company Market Share Analysis 2025
- 14.3.1 Top 5 Companies Market Share Analysis
- 14.3.2 Top 3 Companies Market Share Analysis
- 14.4. List of Potential Customers
- 15. Research Methodology
List of Figures
- Figure 1: Global ASEAN Probiotic Supplements Market Revenue Breakdown (million, %) by Region 2025 & 2033
- Figure 2: Indonesia ASEAN Probiotic Supplements Market Revenue (million), by Product Form 2025 & 2033
- Figure 3: Indonesia ASEAN Probiotic Supplements Market Revenue Share (%), by Product Form 2025 & 2033
- Figure 4: Indonesia ASEAN Probiotic Supplements Market Revenue (million), by Distribution Channel 2025 & 2033
- Figure 5: Indonesia ASEAN Probiotic Supplements Market Revenue Share (%), by Distribution Channel 2025 & 2033
- Figure 6: Indonesia ASEAN Probiotic Supplements Market Revenue (million), by Geography 2025 & 2033
- Figure 7: Indonesia ASEAN Probiotic Supplements Market Revenue Share (%), by Geography 2025 & 2033
- Figure 8: Indonesia ASEAN Probiotic Supplements Market Revenue (million), by Country 2025 & 2033
- Figure 9: Indonesia ASEAN Probiotic Supplements Market Revenue Share (%), by Country 2025 & 2033
- Figure 10: Malaysia ASEAN Probiotic Supplements Market Revenue (million), by Product Form 2025 & 2033
- Figure 11: Malaysia ASEAN Probiotic Supplements Market Revenue Share (%), by Product Form 2025 & 2033
- Figure 12: Malaysia ASEAN Probiotic Supplements Market Revenue (million), by Distribution Channel 2025 & 2033
- Figure 13: Malaysia ASEAN Probiotic Supplements Market Revenue Share (%), by Distribution Channel 2025 & 2033
- Figure 14: Malaysia ASEAN Probiotic Supplements Market Revenue (million), by Geography 2025 & 2033
- Figure 15: Malaysia ASEAN Probiotic Supplements Market Revenue Share (%), by Geography 2025 & 2033
- Figure 16: Malaysia ASEAN Probiotic Supplements Market Revenue (million), by Country 2025 & 2033
- Figure 17: Malaysia ASEAN Probiotic Supplements Market Revenue Share (%), by Country 2025 & 2033
- Figure 18: Thailand ASEAN Probiotic Supplements Market Revenue (million), by Product Form 2025 & 2033
- Figure 19: Thailand ASEAN Probiotic Supplements Market Revenue Share (%), by Product Form 2025 & 2033
- Figure 20: Thailand ASEAN Probiotic Supplements Market Revenue (million), by Distribution Channel 2025 & 2033
- Figure 21: Thailand ASEAN Probiotic Supplements Market Revenue Share (%), by Distribution Channel 2025 & 2033
- Figure 22: Thailand ASEAN Probiotic Supplements Market Revenue (million), by Geography 2025 & 2033
- Figure 23: Thailand ASEAN Probiotic Supplements Market Revenue Share (%), by Geography 2025 & 2033
- Figure 24: Thailand ASEAN Probiotic Supplements Market Revenue (million), by Country 2025 & 2033
- Figure 25: Thailand ASEAN Probiotic Supplements Market Revenue Share (%), by Country 2025 & 2033
- Figure 26: Vietnam ASEAN Probiotic Supplements Market Revenue (million), by Product Form 2025 & 2033
- Figure 27: Vietnam ASEAN Probiotic Supplements Market Revenue Share (%), by Product Form 2025 & 2033
- Figure 28: Vietnam ASEAN Probiotic Supplements Market Revenue (million), by Distribution Channel 2025 & 2033
- Figure 29: Vietnam ASEAN Probiotic Supplements Market Revenue Share (%), by Distribution Channel 2025 & 2033
- Figure 30: Vietnam ASEAN Probiotic Supplements Market Revenue (million), by Geography 2025 & 2033
- Figure 31: Vietnam ASEAN Probiotic Supplements Market Revenue Share (%), by Geography 2025 & 2033
- Figure 32: Vietnam ASEAN Probiotic Supplements Market Revenue (million), by Country 2025 & 2033
- Figure 33: Vietnam ASEAN Probiotic Supplements Market Revenue Share (%), by Country 2025 & 2033
- Figure 34: Singapore ASEAN Probiotic Supplements Market Revenue (million), by Product Form 2025 & 2033
- Figure 35: Singapore ASEAN Probiotic Supplements Market Revenue Share (%), by Product Form 2025 & 2033
- Figure 36: Singapore ASEAN Probiotic Supplements Market Revenue (million), by Distribution Channel 2025 & 2033
- Figure 37: Singapore ASEAN Probiotic Supplements Market Revenue Share (%), by Distribution Channel 2025 & 2033
- Figure 38: Singapore ASEAN Probiotic Supplements Market Revenue (million), by Geography 2025 & 2033
- Figure 39: Singapore ASEAN Probiotic Supplements Market Revenue Share (%), by Geography 2025 & 2033
- Figure 40: Singapore ASEAN Probiotic Supplements Market Revenue (million), by Country 2025 & 2033
- Figure 41: Singapore ASEAN Probiotic Supplements Market Revenue Share (%), by Country 2025 & 2033
- Figure 42: Philippines ASEAN Probiotic Supplements Market Revenue (million), by Product Form 2025 & 2033
- Figure 43: Philippines ASEAN Probiotic Supplements Market Revenue Share (%), by Product Form 2025 & 2033
- Figure 44: Philippines ASEAN Probiotic Supplements Market Revenue (million), by Distribution Channel 2025 & 2033
- Figure 45: Philippines ASEAN Probiotic Supplements Market Revenue Share (%), by Distribution Channel 2025 & 2033
- Figure 46: Philippines ASEAN Probiotic Supplements Market Revenue (million), by Geography 2025 & 2033
- Figure 47: Philippines ASEAN Probiotic Supplements Market Revenue Share (%), by Geography 2025 & 2033
- Figure 48: Philippines ASEAN Probiotic Supplements Market Revenue (million), by Country 2025 & 2033
- Figure 49: Philippines ASEAN Probiotic Supplements Market Revenue Share (%), by Country 2025 & 2033
- Figure 50: Rest of ASEAN ASEAN Probiotic Supplements Market Revenue (million), by Product Form 2025 & 2033
- Figure 51: Rest of ASEAN ASEAN Probiotic Supplements Market Revenue Share (%), by Product Form 2025 & 2033
- Figure 52: Rest of ASEAN ASEAN Probiotic Supplements Market Revenue (million), by Distribution Channel 2025 & 2033
- Figure 53: Rest of ASEAN ASEAN Probiotic Supplements Market Revenue Share (%), by Distribution Channel 2025 & 2033
- Figure 54: Rest of ASEAN ASEAN Probiotic Supplements Market Revenue (million), by Geography 2025 & 2033
- Figure 55: Rest of ASEAN ASEAN Probiotic Supplements Market Revenue Share (%), by Geography 2025 & 2033
- Figure 56: Rest of ASEAN ASEAN Probiotic Supplements Market Revenue (million), by Country 2025 & 2033
- Figure 57: Rest of ASEAN ASEAN Probiotic Supplements Market Revenue Share (%), by Country 2025 & 2033
List of Tables
- Table 1: Global ASEAN Probiotic Supplements Market Revenue million Forecast, by Product Form 2020 & 2033
- Table 2: Global ASEAN Probiotic Supplements Market Revenue million Forecast, by Distribution Channel 2020 & 2033
- Table 3: Global ASEAN Probiotic Supplements Market Revenue million Forecast, by Geography 2020 & 2033
- Table 4: Global ASEAN Probiotic Supplements Market Revenue million Forecast, by Region 2020 & 2033
- Table 5: Global ASEAN Probiotic Supplements Market Revenue million Forecast, by Product Form 2020 & 2033
- Table 6: Global ASEAN Probiotic Supplements Market Revenue million Forecast, by Distribution Channel 2020 & 2033
- Table 7: Global ASEAN Probiotic Supplements Market Revenue million Forecast, by Geography 2020 & 2033
- Table 8: Global ASEAN Probiotic Supplements Market Revenue million Forecast, by Country 2020 & 2033
- Table 9: Global ASEAN Probiotic Supplements Market Revenue million Forecast, by Product Form 2020 & 2033
- Table 10: Global ASEAN Probiotic Supplements Market Revenue million Forecast, by Distribution Channel 2020 & 2033
- Table 11: Global ASEAN Probiotic Supplements Market Revenue million Forecast, by Geography 2020 & 2033
- Table 12: Global ASEAN Probiotic Supplements Market Revenue million Forecast, by Country 2020 & 2033
- Table 13: Global ASEAN Probiotic Supplements Market Revenue million Forecast, by Product Form 2020 & 2033
- Table 14: Global ASEAN Probiotic Supplements Market Revenue million Forecast, by Distribution Channel 2020 & 2033
- Table 15: Global ASEAN Probiotic Supplements Market Revenue million Forecast, by Geography 2020 & 2033
- Table 16: Global ASEAN Probiotic Supplements Market Revenue million Forecast, by Country 2020 & 2033
- Table 17: Global ASEAN Probiotic Supplements Market Revenue million Forecast, by Product Form 2020 & 2033
- Table 18: Global ASEAN Probiotic Supplements Market Revenue million Forecast, by Distribution Channel 2020 & 2033
- Table 19: Global ASEAN Probiotic Supplements Market Revenue million Forecast, by Geography 2020 & 2033
- Table 20: Global ASEAN Probiotic Supplements Market Revenue million Forecast, by Country 2020 & 2033
- Table 21: Global ASEAN Probiotic Supplements Market Revenue million Forecast, by Product Form 2020 & 2033
- Table 22: Global ASEAN Probiotic Supplements Market Revenue million Forecast, by Distribution Channel 2020 & 2033
- Table 23: Global ASEAN Probiotic Supplements Market Revenue million Forecast, by Geography 2020 & 2033
- Table 24: Global ASEAN Probiotic Supplements Market Revenue million Forecast, by Country 2020 & 2033
- Table 25: Global ASEAN Probiotic Supplements Market Revenue million Forecast, by Product Form 2020 & 2033
- Table 26: Global ASEAN Probiotic Supplements Market Revenue million Forecast, by Distribution Channel 2020 & 2033
- Table 27: Global ASEAN Probiotic Supplements Market Revenue million Forecast, by Geography 2020 & 2033
- Table 28: Global ASEAN Probiotic Supplements Market Revenue million Forecast, by Country 2020 & 2033
- Table 29: Global ASEAN Probiotic Supplements Market Revenue million Forecast, by Product Form 2020 & 2033
- Table 30: Global ASEAN Probiotic Supplements Market Revenue million Forecast, by Distribution Channel 2020 & 2033
- Table 31: Global ASEAN Probiotic Supplements Market Revenue million Forecast, by Geography 2020 & 2033
- Table 32: Global ASEAN Probiotic Supplements Market Revenue million Forecast, by Country 2020 & 2033
Frequently Asked Questions
1. What is the projected Compound Annual Growth Rate (CAGR) of the ASEAN Probiotic Supplements Market?
The projected CAGR is approximately 13.7%.
2. Which companies are prominent players in the ASEAN Probiotic Supplements Market?
Key companies in the market include Church & Dwight Co Inc, Amway Corporation, Procter & Gamble, GNC Holdings LLC, Pharma Care Laboratories Pty Ltd, Reckitt Benckiser LLC, Nature's Way Products LLC, Nestle SA*List Not Exhaustive, Blackmores Probiotics, Bio Gaia.
3. What are the main segments of the ASEAN Probiotic Supplements Market?
The market segments include Product Form, Distribution Channel, Geography.
4. Can you provide details about the market size?
The market size is estimated to be USD 44562.3 million as of 2022.
5. What are some drivers contributing to market growth?
Rising Trend of Ingestible Beauty Products; Growing demand for Nutrient-Enriched Cosmetic Products.
6. What are the notable trends driving market growth?
Significance of Health Consciousness among Millennials.
7. Are there any restraints impacting market growth?
Availability of Counterfeit Beauty Supplements Products.
8. Can you provide examples of recent developments in the market?
October 2022: BioGaia AB company launched its new product BioGaia Prodentis Iozenges with a new apple flavor in Indonesia. The product is claimed to be distributed through PT Interbatcompany. As per the company claim, BioGaia Prodentis lozenges is a food supplement for oral health containing the patented lactic acid bacterium Limosilactobacillus reuteri (formerly known as Lactobacillus reuteri) Prodentis (a strain combination of L. reuteri DSM 17938 and L. reuteri ATCC PTA 5289) that helps the good microorganisms keep a natural balance in the mouth.
9. What pricing options are available for accessing the report?
Pricing options include single-user, multi-user, and enterprise licenses priced at USD 4750, USD 5250, and USD 8750 respectively.
10. Is the market size provided in terms of value or volume?
The market size is provided in terms of value, measured in million.
11. Are there any specific market keywords associated with the report?
Yes, the market keyword associated with the report is "ASEAN Probiotic Supplements Market," which aids in identifying and referencing the specific market segment covered.
12. How do I determine which pricing option suits my needs best?
The pricing options vary based on user requirements and access needs. Individual users may opt for single-user licenses, while businesses requiring broader access may choose multi-user or enterprise licenses for cost-effective access to the report.
13. Are there any additional resources or data provided in the ASEAN Probiotic Supplements Market report?
While the report offers comprehensive insights, it's advisable to review the specific contents or supplementary materials provided to ascertain if additional resources or data are available.
14. How can I stay updated on further developments or reports in the ASEAN Probiotic Supplements Market?
To stay informed about further developments, trends, and reports in the ASEAN Probiotic Supplements Market, consider subscribing to industry newsletters, following relevant companies and organizations, or regularly checking reputable industry news sources and publications.
Methodology
Step 1 - Identification of Relevant Samples Size from Population Database


Step 2 - Approaches for Defining Global Market Size (Value, Volume* & Price*)

Note*: In applicable scenarios
Step 3 - Data Sources
Primary Research
- Web Analytics
- Survey Reports
- Research Institute
- Latest Research Reports
- Opinion Leaders
Secondary Research
- Annual Reports
- White Paper
- Latest Press Release
- Industry Association
- Paid Database
- Investor Presentations

Step 4 - Data Triangulation
Involves using different sources of information in order to increase the validity of a study
These sources are likely to be stakeholders in a program - participants, other researchers, program staff, other community members, and so on.
Then we put all data in single framework & apply various statistical tools to find out the dynamic on the market.
During the analysis stage, feedback from the stakeholder groups would be compared to determine areas of agreement as well as areas of divergence