

Key Insights
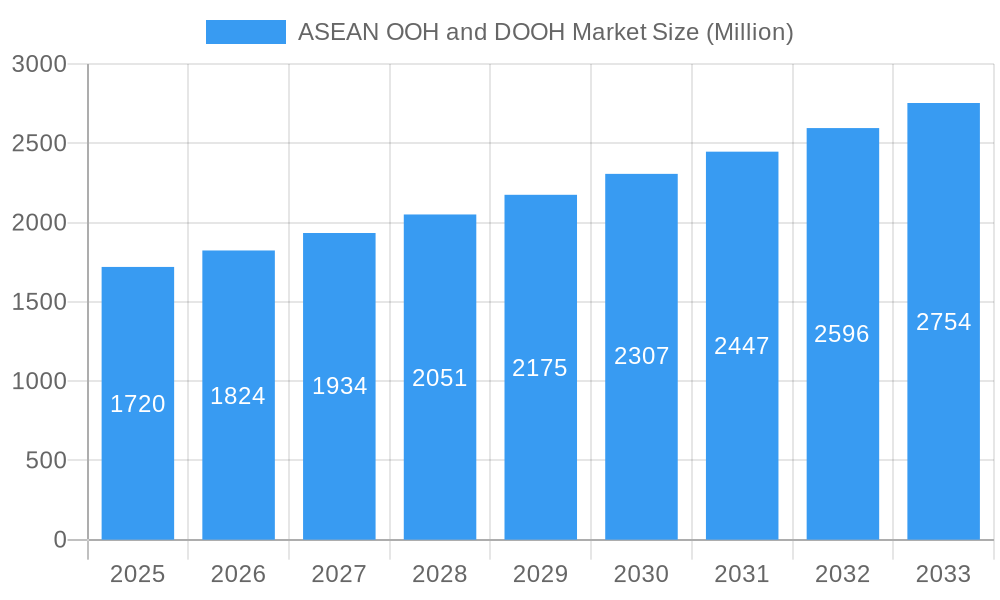
The ASEAN Out-of-Home (OOH) and Digital Out-of-Home (DOOH) advertising market presents a significant growth opportunity, projected to reach a market size of $1.72 billion in 2025, expanding at a Compound Annual Growth Rate (CAGR) of 5.90% from 2025 to 2033. This robust growth is fueled by several key factors. Firstly, increasing urbanization and rising disposable incomes across the ASEAN region are driving higher consumer spending and ad expenditure. Secondly, the adoption of DOOH technologies is rapidly transforming the OOH landscape, offering advertisers more targeted and measurable campaigns compared to traditional billboards. This digital shift allows for dynamic content updates, real-time audience engagement, and sophisticated data analytics, making it an attractive alternative for brands seeking impactful marketing strategies. Furthermore, the rise of innovative OOH formats, such as interactive billboards and mobile advertising, are enhancing the overall appeal and effectiveness of OOH advertising within the region. Competition among established players like JCDecaux SE, Mooving Walls, and Vistar Media, alongside smaller regional players, is fostering innovation and driving down costs, making OOH more accessible to businesses of all sizes.
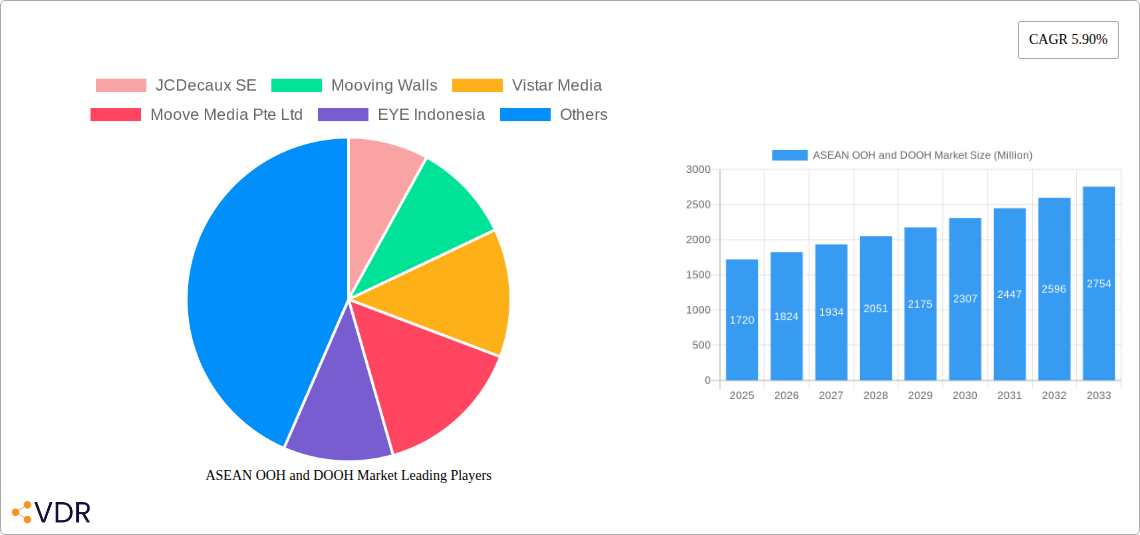
ASEAN OOH and DOOH Market Market Size (In Billion)
However, several challenges remain. The market faces regulatory hurdles in some ASEAN countries regarding billboard placement and advertising standards. Moreover, the success of DOOH relies heavily on reliable internet infrastructure and technological advancements, which may vary across the diverse ASEAN landscape. Finally, effective measurement and attribution of OOH campaign performance are crucial factors that need further development to ensure sustained advertiser investment. Despite these hurdles, the long-term growth trajectory remains positive, driven by the increasing adoption of digital technologies and a burgeoning middle class eager to engage with visually impactful advertising. The market is segmented geographically across the diverse ASEAN nations, with significant variations in growth rates depending upon economic development and infrastructure in specific countries. Over the next decade, the focus will shift towards integrating data analytics and enhancing the measurability of DOOH campaigns to maintain its strong growth trajectory.
ASEAN OOH and DOOH Market Company Market Share
ASEAN OOH and DOOH Market Report: 2019-2033
This comprehensive report provides a deep dive into the dynamic ASEAN Out-of-Home (OOH) and Digital Out-of-Home (DOOH) advertising market, offering invaluable insights for industry professionals, investors, and strategic planners. With a focus on market size, growth trends, key players, and future opportunities, this report covers the period 2019-2033, with a base year of 2025. The report analyzes the parent market (OOH) and its rapidly expanding child market (DOOH), providing granular data and expert analysis to help you navigate this evolving landscape.
Study Period: 2019–2033; Base Year: 2025; Estimated Year: 2025; Forecast Period: 2025–2033; Historical Period: 2019–2024
ASEAN OOH and DOOH Market Dynamics & Structure
This section analyzes the ASEAN OOH and DOOH market's competitive landscape, technological advancements, regulatory environment, and market trends. The market is characterized by a mix of large multinational players and local agencies. Market concentration is moderate, with a few dominant players and a significant number of smaller firms competing for market share. Technological innovation, particularly in DOOH, is a key driver of market growth, enabling more targeted, interactive, and data-driven advertising campaigns.
- Market Concentration: Moderate, with a few major players holding significant market share (xx%).
- Technological Innovation: Rapid advancements in digital display technology, programmatic advertising, and data analytics are driving DOOH growth.
- Regulatory Frameworks: Vary across ASEAN countries, impacting advertising standards and licensing requirements.
- Competitive Product Substitutes: Digital advertising channels (e.g., social media, online video) pose a competitive threat.
- End-User Demographics: The market is driven by diverse consumer segments, with increasing engagement from younger demographics.
- M&A Trends: Moderate M&A activity observed in recent years (xx deals in the last 5 years), driven by consolidation and expansion strategies. This activity is expected to continue, especially among smaller players aiming to gain scale and technological capabilities. Innovation barriers include high initial investment costs for DOOH infrastructure and the need for skilled workforce for development and maintenance.
ASEAN OOH and DOOH Market Growth Trends & Insights
The ASEAN OOH and DOOH market experienced significant growth during the historical period (2019-2024), driven by increasing advertising expenditure, urbanization, and technological advancements. The market size is expected to reach xx Million units in 2025 and to continue its growth trajectory throughout the forecast period (2025-2033). The compound annual growth rate (CAGR) is projected at xx% during the forecast period. The adoption rate of DOOH is accelerating as advertisers recognize the benefits of targeted advertising and data-driven campaign optimization. Shifting consumer behavior, with increased exposure to digital media, presents both opportunities and challenges for OOH and DOOH. Consumer preference towards interactive and engaging campaigns has contributed to the growth.
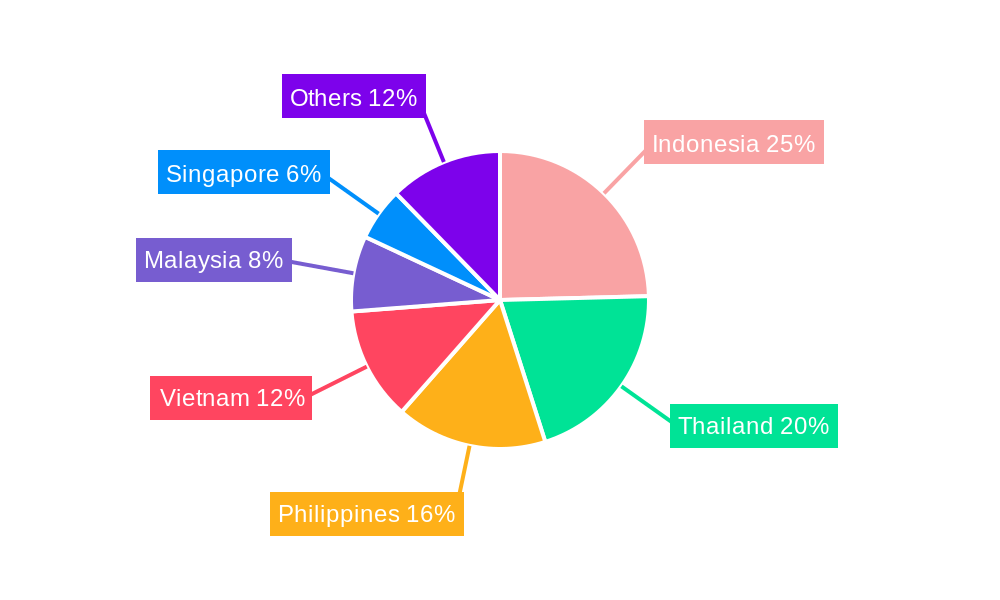
Dominant Regions, Countries, or Segments in ASEAN OOH and DOOH Market
Singapore, Thailand, and Indonesia are currently the leading markets within the ASEAN region, representing the largest market share. Their dominance is attributable to factors such as higher advertising spending, well-developed infrastructure, and a receptive consumer base.
- Key Drivers:
- Strong Economic Growth: Rapid economic expansion in key markets fuels advertising spending.
- Urbanization: High population density in urban areas creates a significant audience for OOH and DOOH advertising.
- Favorable Government Policies: Supportive regulations and infrastructure investments are facilitating market expansion.
- Dominance Factors:
- High Advertising Expenditure: These countries have significantly higher advertising spending compared to other ASEAN nations.
- Advanced Infrastructure: Well-developed transportation networks and public spaces provide ample opportunities for OOH and DOOH deployments.
- High Consumer Engagement: Consumers in these markets exhibit high engagement with OOH and DOOH advertising formats.
ASEAN OOH and DOOH Market Product Landscape
The ASEAN OOH and DOOH market features a diverse range of products, including traditional billboards, digital screens, interactive displays, and mobile advertising. Recent innovations focus on enhanced digital capabilities, such as programmatic buying, data analytics integration, and immersive augmented reality (AR) experiences. These advancements enable precise targeting and better measurement of campaign effectiveness, enhancing the value proposition for advertisers.
Key Drivers, Barriers & Challenges in ASEAN OOH and DOOH Market
Key Drivers: Increasing advertising expenditure, rapid urbanization, technological advancements, and supportive government policies are major drivers of market growth. The rise of programmatic advertising enables efficient campaign management and precise targeting.
Key Challenges: Competition from other advertising channels, regulatory hurdles in some countries, and infrastructure limitations in certain areas can impact market growth. Supply chain disruptions, particularly in sourcing digital display equipment, can cause delays and increase costs. Competition from digital channels has resulted in a xx% reduction in OOH market share in some segments.
Emerging Opportunities in ASEAN OOH and DOOH Market
Untapped markets in smaller cities and rural areas present significant growth potential. The integration of emerging technologies, such as AI, AR/VR, and IoT, offers opportunities for creating more immersive and interactive advertising campaigns. Evolving consumer preferences for experiential marketing and personalized advertising necessitate innovative approaches in campaign creation.
Growth Accelerators in the ASEAN OOH and DOOH Market Industry
Technological breakthroughs in display technology and data analytics are accelerating market growth. Strategic partnerships between OOH operators and technology providers are fostering innovation and creating new advertising opportunities. Expanding into untapped markets and exploring new applications (e.g., smart city integrations) are key expansion strategies for existing and new players.
Key Players Shaping the ASEAN OOH and DOOH Market Market
- JCDecaux SE
- Mooving Walls
- Vistar Media
- Moove Media Pte Ltd
- EYE Indonesia
- Clear Channel Singapore Pte Ltd
- Plan B Media Public Company Limited
- Goldsun Media Group
- Unique Media Group
- On Digitals Company Limited *List Not Exhaustive
Notable Milestones in ASEAN OOH and DOOH Market Sector
- March 2024: Adeffi expands OOH services to India, Nepal, Thailand, and Vietnam, boosting regional brand promotion capabilities.
- March 2024: Singapore Tourism Board launches a global 3D DOOH campaign showcasing Singapore's attractions, driving tourism.
In-Depth ASEAN OOH and DOOH Market Market Outlook
The ASEAN OOH and DOOH market is poised for sustained growth, driven by technological advancements, increasing advertising expenditure, and favorable market conditions. Strategic partnerships, expansion into new markets, and the adoption of innovative advertising formats will further fuel market expansion and create new opportunities for players in this dynamic industry. The market is projected to reach xx Million units by 2033, signifying robust future potential.
ASEAN OOH and DOOH Market Segmentation
-
1. Type
- 1.1. Static (Traditional) OOH
-
1.2. Digital OOH (LED Screens)
- 1.2.1. Programmatic OOH
- 1.2.2. Other Digital OOH Tools
-
2. Application
- 2.1. Billboard
-
2.2. Transportation (Transit)
- 2.2.1. Airports
- 2.2.2. Other Transportation Applications (Buses, etc.)
- 2.3. Street Furniture
- 2.4. Other Place-based Media
-
3. End-user Industry
- 3.1. Automotive
- 3.2. Retail and Consumer Goods
- 3.3. Healthcare
- 3.4. BFSI
- 3.5. Other End-user Industries
ASEAN OOH and DOOH Market Segmentation By Geography
-
1. North America
- 1.1. United States
- 1.2. Canada
- 1.3. Mexico
-
2. South America
- 2.1. Brazil
- 2.2. Argentina
- 2.3. Rest of South America
-
3. Europe
- 3.1. United Kingdom
- 3.2. Germany
- 3.3. France
- 3.4. Italy
- 3.5. Spain
- 3.6. Russia
- 3.7. Benelux
- 3.8. Nordics
- 3.9. Rest of Europe
-
4. Middle East & Africa
- 4.1. Turkey
- 4.2. Israel
- 4.3. GCC
- 4.4. North Africa
- 4.5. South Africa
- 4.6. Rest of Middle East & Africa
-
5. Asia Pacific
- 5.1. China
- 5.2. India
- 5.3. Japan
- 5.4. South Korea
- 5.5. ASEAN
- 5.6. Oceania
- 5.7. Rest of Asia Pacific
ASEAN OOH and DOOH Market Regional Market Share
Geographic Coverage of ASEAN OOH and DOOH Market
ASEAN OOH and DOOH Market REPORT HIGHLIGHTS
| Aspects | Details |
|---|---|
| Study Period | 2020-2034 |
| Base Year | 2025 |
| Estimated Year | 2026 |
| Forecast Period | 2026-2034 |
| Historical Period | 2020-2025 |
| Growth Rate | CAGR of 5.90% from 2020-2034 |
| Segmentation |
|
Table of Contents
- 1. Introduction
- 1.1. Research Scope
- 1.2. Market Segmentation
- 1.3. Research Objective
- 1.4. Definitions and Assumptions
- 2. Executive Summary
- 2.1. Market Snapshot
- 3. Market Dynamics
- 3.1. Market Drivers
- 3.2. Market Restrains
- 3.3. Market Trends
- 3.4. Market Opportunities
- 4. Market Factor Analysis
- 4.1. Porters Five Forces
- 4.1.1. Bargaining Power of Suppliers
- 4.1.2. Bargaining Power of Buyers
- 4.1.3. Threat of New Entrants
- 4.1.4. Threat of Substitutes
- 4.1.5. Competitive Rivalry
- 4.2. PESTEL analysis
- 4.3. BCG Analysis
- 4.3.1. Stars (High Growth, High Market Share)
- 4.3.2. Cash Cows (Low Growth, High Market Share)
- 4.3.3. Question Mark (High Growth, Low Market Share)
- 4.3.4. Dogs (Low Growth, Low Market Share)
- 4.4. Ansoff Matrix Analysis
- 4.5. Supply Chain Analysis
- 4.6. Regulatory Landscape
- 4.7. Current Market Potential and Opportunity Assessment (TAM–SAM–SOM Framework)
- 4.8. VDR Analyst Note
- 4.1. Porters Five Forces
- 5. Market Analysis, Insights and Forecast 2021-2033
- 5.1. Market Analysis, Insights and Forecast - by Type
- 5.1.1. Static (Traditional) OOH
- 5.1.2. Digital OOH (LED Screens)
- 5.1.2.1. Programmatic OOH
- 5.1.2.2. Other Digital OOH Tools
- 5.2. Market Analysis, Insights and Forecast - by Application
- 5.2.1. Billboard
- 5.2.2. Transportation (Transit)
- 5.2.2.1. Airports
- 5.2.2.2. Other Transportation Applications (Buses, etc.)
- 5.2.3. Street Furniture
- 5.2.4. Other Place-based Media
- 5.3. Market Analysis, Insights and Forecast - by End-user Industry
- 5.3.1. Automotive
- 5.3.2. Retail and Consumer Goods
- 5.3.3. Healthcare
- 5.3.4. BFSI
- 5.3.5. Other End-user Industries
- 5.4. Market Analysis, Insights and Forecast - by Region
- 5.4.1. North America
- 5.4.2. South America
- 5.4.3. Europe
- 5.4.4. Middle East & Africa
- 5.4.5. Asia Pacific
- 5.1. Market Analysis, Insights and Forecast - by Type
- 6. Global ASEAN OOH and DOOH Market Analysis, Insights and Forecast, 2021-2033
- 6.1. Market Analysis, Insights and Forecast - by Type
- 6.1.1. Static (Traditional) OOH
- 6.1.2. Digital OOH (LED Screens)
- 6.1.2.1. Programmatic OOH
- 6.1.2.2. Other Digital OOH Tools
- 6.2. Market Analysis, Insights and Forecast - by Application
- 6.2.1. Billboard
- 6.2.2. Transportation (Transit)
- 6.2.2.1. Airports
- 6.2.2.2. Other Transportation Applications (Buses, etc.)
- 6.2.3. Street Furniture
- 6.2.4. Other Place-based Media
- 6.3. Market Analysis, Insights and Forecast - by End-user Industry
- 6.3.1. Automotive
- 6.3.2. Retail and Consumer Goods
- 6.3.3. Healthcare
- 6.3.4. BFSI
- 6.3.5. Other End-user Industries
- 6.1. Market Analysis, Insights and Forecast - by Type
- 7. North America ASEAN OOH and DOOH Market Analysis, Insights and Forecast, 2021-2033
- 7.1. Market Analysis, Insights and Forecast - by Type
- 7.1.1. Static (Traditional) OOH
- 7.1.2. Digital OOH (LED Screens)
- 7.1.2.1. Programmatic OOH
- 7.1.2.2. Other Digital OOH Tools
- 7.2. Market Analysis, Insights and Forecast - by Application
- 7.2.1. Billboard
- 7.2.2. Transportation (Transit)
- 7.2.2.1. Airports
- 7.2.2.2. Other Transportation Applications (Buses, etc.)
- 7.2.3. Street Furniture
- 7.2.4. Other Place-based Media
- 7.3. Market Analysis, Insights and Forecast - by End-user Industry
- 7.3.1. Automotive
- 7.3.2. Retail and Consumer Goods
- 7.3.3. Healthcare
- 7.3.4. BFSI
- 7.3.5. Other End-user Industries
- 7.1. Market Analysis, Insights and Forecast - by Type
- 8. South America ASEAN OOH and DOOH Market Analysis, Insights and Forecast, 2021-2033
- 8.1. Market Analysis, Insights and Forecast - by Type
- 8.1.1. Static (Traditional) OOH
- 8.1.2. Digital OOH (LED Screens)
- 8.1.2.1. Programmatic OOH
- 8.1.2.2. Other Digital OOH Tools
- 8.2. Market Analysis, Insights and Forecast - by Application
- 8.2.1. Billboard
- 8.2.2. Transportation (Transit)
- 8.2.2.1. Airports
- 8.2.2.2. Other Transportation Applications (Buses, etc.)
- 8.2.3. Street Furniture
- 8.2.4. Other Place-based Media
- 8.3. Market Analysis, Insights and Forecast - by End-user Industry
- 8.3.1. Automotive
- 8.3.2. Retail and Consumer Goods
- 8.3.3. Healthcare
- 8.3.4. BFSI
- 8.3.5. Other End-user Industries
- 8.1. Market Analysis, Insights and Forecast - by Type
- 9. Europe ASEAN OOH and DOOH Market Analysis, Insights and Forecast, 2021-2033
- 9.1. Market Analysis, Insights and Forecast - by Type
- 9.1.1. Static (Traditional) OOH
- 9.1.2. Digital OOH (LED Screens)
- 9.1.2.1. Programmatic OOH
- 9.1.2.2. Other Digital OOH Tools
- 9.2. Market Analysis, Insights and Forecast - by Application
- 9.2.1. Billboard
- 9.2.2. Transportation (Transit)
- 9.2.2.1. Airports
- 9.2.2.2. Other Transportation Applications (Buses, etc.)
- 9.2.3. Street Furniture
- 9.2.4. Other Place-based Media
- 9.3. Market Analysis, Insights and Forecast - by End-user Industry
- 9.3.1. Automotive
- 9.3.2. Retail and Consumer Goods
- 9.3.3. Healthcare
- 9.3.4. BFSI
- 9.3.5. Other End-user Industries
- 9.1. Market Analysis, Insights and Forecast - by Type
- 10. Middle East & Africa ASEAN OOH and DOOH Market Analysis, Insights and Forecast, 2021-2033
- 10.1. Market Analysis, Insights and Forecast - by Type
- 10.1.1. Static (Traditional) OOH
- 10.1.2. Digital OOH (LED Screens)
- 10.1.2.1. Programmatic OOH
- 10.1.2.2. Other Digital OOH Tools
- 10.2. Market Analysis, Insights and Forecast - by Application
- 10.2.1. Billboard
- 10.2.2. Transportation (Transit)
- 10.2.2.1. Airports
- 10.2.2.2. Other Transportation Applications (Buses, etc.)
- 10.2.3. Street Furniture
- 10.2.4. Other Place-based Media
- 10.3. Market Analysis, Insights and Forecast - by End-user Industry
- 10.3.1. Automotive
- 10.3.2. Retail and Consumer Goods
- 10.3.3. Healthcare
- 10.3.4. BFSI
- 10.3.5. Other End-user Industries
- 10.1. Market Analysis, Insights and Forecast - by Type
- 11. Asia Pacific ASEAN OOH and DOOH Market Analysis, Insights and Forecast, 2021-2033
- 11.1. Market Analysis, Insights and Forecast - by Type
- 11.1.1. Static (Traditional) OOH
- 11.1.2. Digital OOH (LED Screens)
- 11.1.2.1. Programmatic OOH
- 11.1.2.2. Other Digital OOH Tools
- 11.2. Market Analysis, Insights and Forecast - by Application
- 11.2.1. Billboard
- 11.2.2. Transportation (Transit)
- 11.2.2.1. Airports
- 11.2.2.2. Other Transportation Applications (Buses, etc.)
- 11.2.3. Street Furniture
- 11.2.4. Other Place-based Media
- 11.3. Market Analysis, Insights and Forecast - by End-user Industry
- 11.3.1. Automotive
- 11.3.2. Retail and Consumer Goods
- 11.3.3. Healthcare
- 11.3.4. BFSI
- 11.3.5. Other End-user Industries
- 11.1. Market Analysis, Insights and Forecast - by Type
- 12. Competitive Analysis
- 12.1. Company Profiles
- 12.1.1 JCDecaux SE
- 12.1.1.1. Company Overview
- 12.1.1.2. Products
- 12.1.1.3. Company Financials
- 12.1.1.4. SWOT Analysis
- 12.1.2 Mooving Walls
- 12.1.2.1. Company Overview
- 12.1.2.2. Products
- 12.1.2.3. Company Financials
- 12.1.2.4. SWOT Analysis
- 12.1.3 Vistar Media
- 12.1.3.1. Company Overview
- 12.1.3.2. Products
- 12.1.3.3. Company Financials
- 12.1.3.4. SWOT Analysis
- 12.1.4 Moove Media Pte Ltd
- 12.1.4.1. Company Overview
- 12.1.4.2. Products
- 12.1.4.3. Company Financials
- 12.1.4.4. SWOT Analysis
- 12.1.5 EYE Indonesia
- 12.1.5.1. Company Overview
- 12.1.5.2. Products
- 12.1.5.3. Company Financials
- 12.1.5.4. SWOT Analysis
- 12.1.6 Clear Channel Singapore Pte Ltd
- 12.1.6.1. Company Overview
- 12.1.6.2. Products
- 12.1.6.3. Company Financials
- 12.1.6.4. SWOT Analysis
- 12.1.7 Plan B Media Public Company Limited
- 12.1.7.1. Company Overview
- 12.1.7.2. Products
- 12.1.7.3. Company Financials
- 12.1.7.4. SWOT Analysis
- 12.1.8 Goldsun Media Group
- 12.1.8.1. Company Overview
- 12.1.8.2. Products
- 12.1.8.3. Company Financials
- 12.1.8.4. SWOT Analysis
- 12.1.9 Unique Media Group
- 12.1.9.1. Company Overview
- 12.1.9.2. Products
- 12.1.9.3. Company Financials
- 12.1.9.4. SWOT Analysis
- 12.1.10 On Digitals Company Limited*List Not Exhaustive
- 12.1.10.1. Company Overview
- 12.1.10.2. Products
- 12.1.10.3. Company Financials
- 12.1.10.4. SWOT Analysis
- 12.1.1 JCDecaux SE
- 12.2. Market Entropy
- 12.2.1 Company's Key Areas Served
- 12.2.2 Recent Developments
- 12.3. Company Market Share Analysis 2025
- 12.3.1 Top 5 Companies Market Share Analysis
- 12.3.2 Top 3 Companies Market Share Analysis
- 12.4. List of Potential Customers
- 13. Research Methodology
List of Figures
- Figure 1: Global ASEAN OOH and DOOH Market Revenue Breakdown (Million, %) by Region 2025 & 2033
- Figure 2: Global ASEAN OOH and DOOH Market Volume Breakdown (Billion, %) by Region 2025 & 2033
- Figure 3: North America ASEAN OOH and DOOH Market Revenue (Million), by Type 2025 & 2033
- Figure 4: North America ASEAN OOH and DOOH Market Volume (Billion), by Type 2025 & 2033
- Figure 5: North America ASEAN OOH and DOOH Market Revenue Share (%), by Type 2025 & 2033
- Figure 6: North America ASEAN OOH and DOOH Market Volume Share (%), by Type 2025 & 2033
- Figure 7: North America ASEAN OOH and DOOH Market Revenue (Million), by Application 2025 & 2033
- Figure 8: North America ASEAN OOH and DOOH Market Volume (Billion), by Application 2025 & 2033
- Figure 9: North America ASEAN OOH and DOOH Market Revenue Share (%), by Application 2025 & 2033
- Figure 10: North America ASEAN OOH and DOOH Market Volume Share (%), by Application 2025 & 2033
- Figure 11: North America ASEAN OOH and DOOH Market Revenue (Million), by End-user Industry 2025 & 2033
- Figure 12: North America ASEAN OOH and DOOH Market Volume (Billion), by End-user Industry 2025 & 2033
- Figure 13: North America ASEAN OOH and DOOH Market Revenue Share (%), by End-user Industry 2025 & 2033
- Figure 14: North America ASEAN OOH and DOOH Market Volume Share (%), by End-user Industry 2025 & 2033
- Figure 15: North America ASEAN OOH and DOOH Market Revenue (Million), by Country 2025 & 2033
- Figure 16: North America ASEAN OOH and DOOH Market Volume (Billion), by Country 2025 & 2033
- Figure 17: North America ASEAN OOH and DOOH Market Revenue Share (%), by Country 2025 & 2033
- Figure 18: North America ASEAN OOH and DOOH Market Volume Share (%), by Country 2025 & 2033
- Figure 19: South America ASEAN OOH and DOOH Market Revenue (Million), by Type 2025 & 2033
- Figure 20: South America ASEAN OOH and DOOH Market Volume (Billion), by Type 2025 & 2033
- Figure 21: South America ASEAN OOH and DOOH Market Revenue Share (%), by Type 2025 & 2033
- Figure 22: South America ASEAN OOH and DOOH Market Volume Share (%), by Type 2025 & 2033
- Figure 23: South America ASEAN OOH and DOOH Market Revenue (Million), by Application 2025 & 2033
- Figure 24: South America ASEAN OOH and DOOH Market Volume (Billion), by Application 2025 & 2033
- Figure 25: South America ASEAN OOH and DOOH Market Revenue Share (%), by Application 2025 & 2033
- Figure 26: South America ASEAN OOH and DOOH Market Volume Share (%), by Application 2025 & 2033
- Figure 27: South America ASEAN OOH and DOOH Market Revenue (Million), by End-user Industry 2025 & 2033
- Figure 28: South America ASEAN OOH and DOOH Market Volume (Billion), by End-user Industry 2025 & 2033
- Figure 29: South America ASEAN OOH and DOOH Market Revenue Share (%), by End-user Industry 2025 & 2033
- Figure 30: South America ASEAN OOH and DOOH Market Volume Share (%), by End-user Industry 2025 & 2033
- Figure 31: South America ASEAN OOH and DOOH Market Revenue (Million), by Country 2025 & 2033
- Figure 32: South America ASEAN OOH and DOOH Market Volume (Billion), by Country 2025 & 2033
- Figure 33: South America ASEAN OOH and DOOH Market Revenue Share (%), by Country 2025 & 2033
- Figure 34: South America ASEAN OOH and DOOH Market Volume Share (%), by Country 2025 & 2033
- Figure 35: Europe ASEAN OOH and DOOH Market Revenue (Million), by Type 2025 & 2033
- Figure 36: Europe ASEAN OOH and DOOH Market Volume (Billion), by Type 2025 & 2033
- Figure 37: Europe ASEAN OOH and DOOH Market Revenue Share (%), by Type 2025 & 2033
- Figure 38: Europe ASEAN OOH and DOOH Market Volume Share (%), by Type 2025 & 2033
- Figure 39: Europe ASEAN OOH and DOOH Market Revenue (Million), by Application 2025 & 2033
- Figure 40: Europe ASEAN OOH and DOOH Market Volume (Billion), by Application 2025 & 2033
- Figure 41: Europe ASEAN OOH and DOOH Market Revenue Share (%), by Application 2025 & 2033
- Figure 42: Europe ASEAN OOH and DOOH Market Volume Share (%), by Application 2025 & 2033
- Figure 43: Europe ASEAN OOH and DOOH Market Revenue (Million), by End-user Industry 2025 & 2033
- Figure 44: Europe ASEAN OOH and DOOH Market Volume (Billion), by End-user Industry 2025 & 2033
- Figure 45: Europe ASEAN OOH and DOOH Market Revenue Share (%), by End-user Industry 2025 & 2033
- Figure 46: Europe ASEAN OOH and DOOH Market Volume Share (%), by End-user Industry 2025 & 2033
- Figure 47: Europe ASEAN OOH and DOOH Market Revenue (Million), by Country 2025 & 2033
- Figure 48: Europe ASEAN OOH and DOOH Market Volume (Billion), by Country 2025 & 2033
- Figure 49: Europe ASEAN OOH and DOOH Market Revenue Share (%), by Country 2025 & 2033
- Figure 50: Europe ASEAN OOH and DOOH Market Volume Share (%), by Country 2025 & 2033
- Figure 51: Middle East & Africa ASEAN OOH and DOOH Market Revenue (Million), by Type 2025 & 2033
- Figure 52: Middle East & Africa ASEAN OOH and DOOH Market Volume (Billion), by Type 2025 & 2033
- Figure 53: Middle East & Africa ASEAN OOH and DOOH Market Revenue Share (%), by Type 2025 & 2033
- Figure 54: Middle East & Africa ASEAN OOH and DOOH Market Volume Share (%), by Type 2025 & 2033
- Figure 55: Middle East & Africa ASEAN OOH and DOOH Market Revenue (Million), by Application 2025 & 2033
- Figure 56: Middle East & Africa ASEAN OOH and DOOH Market Volume (Billion), by Application 2025 & 2033
- Figure 57: Middle East & Africa ASEAN OOH and DOOH Market Revenue Share (%), by Application 2025 & 2033
- Figure 58: Middle East & Africa ASEAN OOH and DOOH Market Volume Share (%), by Application 2025 & 2033
- Figure 59: Middle East & Africa ASEAN OOH and DOOH Market Revenue (Million), by End-user Industry 2025 & 2033
- Figure 60: Middle East & Africa ASEAN OOH and DOOH Market Volume (Billion), by End-user Industry 2025 & 2033
- Figure 61: Middle East & Africa ASEAN OOH and DOOH Market Revenue Share (%), by End-user Industry 2025 & 2033
- Figure 62: Middle East & Africa ASEAN OOH and DOOH Market Volume Share (%), by End-user Industry 2025 & 2033
- Figure 63: Middle East & Africa ASEAN OOH and DOOH Market Revenue (Million), by Country 2025 & 2033
- Figure 64: Middle East & Africa ASEAN OOH and DOOH Market Volume (Billion), by Country 2025 & 2033
- Figure 65: Middle East & Africa ASEAN OOH and DOOH Market Revenue Share (%), by Country 2025 & 2033
- Figure 66: Middle East & Africa ASEAN OOH and DOOH Market Volume Share (%), by Country 2025 & 2033
- Figure 67: Asia Pacific ASEAN OOH and DOOH Market Revenue (Million), by Type 2025 & 2033
- Figure 68: Asia Pacific ASEAN OOH and DOOH Market Volume (Billion), by Type 2025 & 2033
- Figure 69: Asia Pacific ASEAN OOH and DOOH Market Revenue Share (%), by Type 2025 & 2033
- Figure 70: Asia Pacific ASEAN OOH and DOOH Market Volume Share (%), by Type 2025 & 2033
- Figure 71: Asia Pacific ASEAN OOH and DOOH Market Revenue (Million), by Application 2025 & 2033
- Figure 72: Asia Pacific ASEAN OOH and DOOH Market Volume (Billion), by Application 2025 & 2033
- Figure 73: Asia Pacific ASEAN OOH and DOOH Market Revenue Share (%), by Application 2025 & 2033
- Figure 74: Asia Pacific ASEAN OOH and DOOH Market Volume Share (%), by Application 2025 & 2033
- Figure 75: Asia Pacific ASEAN OOH and DOOH Market Revenue (Million), by End-user Industry 2025 & 2033
- Figure 76: Asia Pacific ASEAN OOH and DOOH Market Volume (Billion), by End-user Industry 2025 & 2033
- Figure 77: Asia Pacific ASEAN OOH and DOOH Market Revenue Share (%), by End-user Industry 2025 & 2033
- Figure 78: Asia Pacific ASEAN OOH and DOOH Market Volume Share (%), by End-user Industry 2025 & 2033
- Figure 79: Asia Pacific ASEAN OOH and DOOH Market Revenue (Million), by Country 2025 & 2033
- Figure 80: Asia Pacific ASEAN OOH and DOOH Market Volume (Billion), by Country 2025 & 2033
- Figure 81: Asia Pacific ASEAN OOH and DOOH Market Revenue Share (%), by Country 2025 & 2033
- Figure 82: Asia Pacific ASEAN OOH and DOOH Market Volume Share (%), by Country 2025 & 2033
List of Tables
- Table 1: Global ASEAN OOH and DOOH Market Revenue Million Forecast, by Type 2020 & 2033
- Table 2: Global ASEAN OOH and DOOH Market Volume Billion Forecast, by Type 2020 & 2033
- Table 3: Global ASEAN OOH and DOOH Market Revenue Million Forecast, by Application 2020 & 2033
- Table 4: Global ASEAN OOH and DOOH Market Volume Billion Forecast, by Application 2020 & 2033
- Table 5: Global ASEAN OOH and DOOH Market Revenue Million Forecast, by End-user Industry 2020 & 2033
- Table 6: Global ASEAN OOH and DOOH Market Volume Billion Forecast, by End-user Industry 2020 & 2033
- Table 7: Global ASEAN OOH and DOOH Market Revenue Million Forecast, by Region 2020 & 2033
- Table 8: Global ASEAN OOH and DOOH Market Volume Billion Forecast, by Region 2020 & 2033
- Table 9: Global ASEAN OOH and DOOH Market Revenue Million Forecast, by Type 2020 & 2033
- Table 10: Global ASEAN OOH and DOOH Market Volume Billion Forecast, by Type 2020 & 2033
- Table 11: Global ASEAN OOH and DOOH Market Revenue Million Forecast, by Application 2020 & 2033
- Table 12: Global ASEAN OOH and DOOH Market Volume Billion Forecast, by Application 2020 & 2033
- Table 13: Global ASEAN OOH and DOOH Market Revenue Million Forecast, by End-user Industry 2020 & 2033
- Table 14: Global ASEAN OOH and DOOH Market Volume Billion Forecast, by End-user Industry 2020 & 2033
- Table 15: Global ASEAN OOH and DOOH Market Revenue Million Forecast, by Country 2020 & 2033
- Table 16: Global ASEAN OOH and DOOH Market Volume Billion Forecast, by Country 2020 & 2033
- Table 17: United States ASEAN OOH and DOOH Market Revenue (Million) Forecast, by Application 2020 & 2033
- Table 18: United States ASEAN OOH and DOOH Market Volume (Billion) Forecast, by Application 2020 & 2033
- Table 19: Canada ASEAN OOH and DOOH Market Revenue (Million) Forecast, by Application 2020 & 2033
- Table 20: Canada ASEAN OOH and DOOH Market Volume (Billion) Forecast, by Application 2020 & 2033
- Table 21: Mexico ASEAN OOH and DOOH Market Revenue (Million) Forecast, by Application 2020 & 2033
- Table 22: Mexico ASEAN OOH and DOOH Market Volume (Billion) Forecast, by Application 2020 & 2033
- Table 23: Global ASEAN OOH and DOOH Market Revenue Million Forecast, by Type 2020 & 2033
- Table 24: Global ASEAN OOH and DOOH Market Volume Billion Forecast, by Type 2020 & 2033
- Table 25: Global ASEAN OOH and DOOH Market Revenue Million Forecast, by Application 2020 & 2033
- Table 26: Global ASEAN OOH and DOOH Market Volume Billion Forecast, by Application 2020 & 2033
- Table 27: Global ASEAN OOH and DOOH Market Revenue Million Forecast, by End-user Industry 2020 & 2033
- Table 28: Global ASEAN OOH and DOOH Market Volume Billion Forecast, by End-user Industry 2020 & 2033
- Table 29: Global ASEAN OOH and DOOH Market Revenue Million Forecast, by Country 2020 & 2033
- Table 30: Global ASEAN OOH and DOOH Market Volume Billion Forecast, by Country 2020 & 2033
- Table 31: Brazil ASEAN OOH and DOOH Market Revenue (Million) Forecast, by Application 2020 & 2033
- Table 32: Brazil ASEAN OOH and DOOH Market Volume (Billion) Forecast, by Application 2020 & 2033
- Table 33: Argentina ASEAN OOH and DOOH Market Revenue (Million) Forecast, by Application 2020 & 2033
- Table 34: Argentina ASEAN OOH and DOOH Market Volume (Billion) Forecast, by Application 2020 & 2033
- Table 35: Rest of South America ASEAN OOH and DOOH Market Revenue (Million) Forecast, by Application 2020 & 2033
- Table 36: Rest of South America ASEAN OOH and DOOH Market Volume (Billion) Forecast, by Application 2020 & 2033
- Table 37: Global ASEAN OOH and DOOH Market Revenue Million Forecast, by Type 2020 & 2033
- Table 38: Global ASEAN OOH and DOOH Market Volume Billion Forecast, by Type 2020 & 2033
- Table 39: Global ASEAN OOH and DOOH Market Revenue Million Forecast, by Application 2020 & 2033
- Table 40: Global ASEAN OOH and DOOH Market Volume Billion Forecast, by Application 2020 & 2033
- Table 41: Global ASEAN OOH and DOOH Market Revenue Million Forecast, by End-user Industry 2020 & 2033
- Table 42: Global ASEAN OOH and DOOH Market Volume Billion Forecast, by End-user Industry 2020 & 2033
- Table 43: Global ASEAN OOH and DOOH Market Revenue Million Forecast, by Country 2020 & 2033
- Table 44: Global ASEAN OOH and DOOH Market Volume Billion Forecast, by Country 2020 & 2033
- Table 45: United Kingdom ASEAN OOH and DOOH Market Revenue (Million) Forecast, by Application 2020 & 2033
- Table 46: United Kingdom ASEAN OOH and DOOH Market Volume (Billion) Forecast, by Application 2020 & 2033
- Table 47: Germany ASEAN OOH and DOOH Market Revenue (Million) Forecast, by Application 2020 & 2033
- Table 48: Germany ASEAN OOH and DOOH Market Volume (Billion) Forecast, by Application 2020 & 2033
- Table 49: France ASEAN OOH and DOOH Market Revenue (Million) Forecast, by Application 2020 & 2033
- Table 50: France ASEAN OOH and DOOH Market Volume (Billion) Forecast, by Application 2020 & 2033
- Table 51: Italy ASEAN OOH and DOOH Market Revenue (Million) Forecast, by Application 2020 & 2033
- Table 52: Italy ASEAN OOH and DOOH Market Volume (Billion) Forecast, by Application 2020 & 2033
- Table 53: Spain ASEAN OOH and DOOH Market Revenue (Million) Forecast, by Application 2020 & 2033
- Table 54: Spain ASEAN OOH and DOOH Market Volume (Billion) Forecast, by Application 2020 & 2033
- Table 55: Russia ASEAN OOH and DOOH Market Revenue (Million) Forecast, by Application 2020 & 2033
- Table 56: Russia ASEAN OOH and DOOH Market Volume (Billion) Forecast, by Application 2020 & 2033
- Table 57: Benelux ASEAN OOH and DOOH Market Revenue (Million) Forecast, by Application 2020 & 2033
- Table 58: Benelux ASEAN OOH and DOOH Market Volume (Billion) Forecast, by Application 2020 & 2033
- Table 59: Nordics ASEAN OOH and DOOH Market Revenue (Million) Forecast, by Application 2020 & 2033
- Table 60: Nordics ASEAN OOH and DOOH Market Volume (Billion) Forecast, by Application 2020 & 2033
- Table 61: Rest of Europe ASEAN OOH and DOOH Market Revenue (Million) Forecast, by Application 2020 & 2033
- Table 62: Rest of Europe ASEAN OOH and DOOH Market Volume (Billion) Forecast, by Application 2020 & 2033
- Table 63: Global ASEAN OOH and DOOH Market Revenue Million Forecast, by Type 2020 & 2033
- Table 64: Global ASEAN OOH and DOOH Market Volume Billion Forecast, by Type 2020 & 2033
- Table 65: Global ASEAN OOH and DOOH Market Revenue Million Forecast, by Application 2020 & 2033
- Table 66: Global ASEAN OOH and DOOH Market Volume Billion Forecast, by Application 2020 & 2033
- Table 67: Global ASEAN OOH and DOOH Market Revenue Million Forecast, by End-user Industry 2020 & 2033
- Table 68: Global ASEAN OOH and DOOH Market Volume Billion Forecast, by End-user Industry 2020 & 2033
- Table 69: Global ASEAN OOH and DOOH Market Revenue Million Forecast, by Country 2020 & 2033
- Table 70: Global ASEAN OOH and DOOH Market Volume Billion Forecast, by Country 2020 & 2033
- Table 71: Turkey ASEAN OOH and DOOH Market Revenue (Million) Forecast, by Application 2020 & 2033
- Table 72: Turkey ASEAN OOH and DOOH Market Volume (Billion) Forecast, by Application 2020 & 2033
- Table 73: Israel ASEAN OOH and DOOH Market Revenue (Million) Forecast, by Application 2020 & 2033
- Table 74: Israel ASEAN OOH and DOOH Market Volume (Billion) Forecast, by Application 2020 & 2033
- Table 75: GCC ASEAN OOH and DOOH Market Revenue (Million) Forecast, by Application 2020 & 2033
- Table 76: GCC ASEAN OOH and DOOH Market Volume (Billion) Forecast, by Application 2020 & 2033
- Table 77: North Africa ASEAN OOH and DOOH Market Revenue (Million) Forecast, by Application 2020 & 2033
- Table 78: North Africa ASEAN OOH and DOOH Market Volume (Billion) Forecast, by Application 2020 & 2033
- Table 79: South Africa ASEAN OOH and DOOH Market Revenue (Million) Forecast, by Application 2020 & 2033
- Table 80: South Africa ASEAN OOH and DOOH Market Volume (Billion) Forecast, by Application 2020 & 2033
- Table 81: Rest of Middle East & Africa ASEAN OOH and DOOH Market Revenue (Million) Forecast, by Application 2020 & 2033
- Table 82: Rest of Middle East & Africa ASEAN OOH and DOOH Market Volume (Billion) Forecast, by Application 2020 & 2033
- Table 83: Global ASEAN OOH and DOOH Market Revenue Million Forecast, by Type 2020 & 2033
- Table 84: Global ASEAN OOH and DOOH Market Volume Billion Forecast, by Type 2020 & 2033
- Table 85: Global ASEAN OOH and DOOH Market Revenue Million Forecast, by Application 2020 & 2033
- Table 86: Global ASEAN OOH and DOOH Market Volume Billion Forecast, by Application 2020 & 2033
- Table 87: Global ASEAN OOH and DOOH Market Revenue Million Forecast, by End-user Industry 2020 & 2033
- Table 88: Global ASEAN OOH and DOOH Market Volume Billion Forecast, by End-user Industry 2020 & 2033
- Table 89: Global ASEAN OOH and DOOH Market Revenue Million Forecast, by Country 2020 & 2033
- Table 90: Global ASEAN OOH and DOOH Market Volume Billion Forecast, by Country 2020 & 2033
- Table 91: China ASEAN OOH and DOOH Market Revenue (Million) Forecast, by Application 2020 & 2033
- Table 92: China ASEAN OOH and DOOH Market Volume (Billion) Forecast, by Application 2020 & 2033
- Table 93: India ASEAN OOH and DOOH Market Revenue (Million) Forecast, by Application 2020 & 2033
- Table 94: India ASEAN OOH and DOOH Market Volume (Billion) Forecast, by Application 2020 & 2033
- Table 95: Japan ASEAN OOH and DOOH Market Revenue (Million) Forecast, by Application 2020 & 2033
- Table 96: Japan ASEAN OOH and DOOH Market Volume (Billion) Forecast, by Application 2020 & 2033
- Table 97: South Korea ASEAN OOH and DOOH Market Revenue (Million) Forecast, by Application 2020 & 2033
- Table 98: South Korea ASEAN OOH and DOOH Market Volume (Billion) Forecast, by Application 2020 & 2033
- Table 99: ASEAN ASEAN OOH and DOOH Market Revenue (Million) Forecast, by Application 2020 & 2033
- Table 100: ASEAN ASEAN OOH and DOOH Market Volume (Billion) Forecast, by Application 2020 & 2033
- Table 101: Oceania ASEAN OOH and DOOH Market Revenue (Million) Forecast, by Application 2020 & 2033
- Table 102: Oceania ASEAN OOH and DOOH Market Volume (Billion) Forecast, by Application 2020 & 2033
- Table 103: Rest of Asia Pacific ASEAN OOH and DOOH Market Revenue (Million) Forecast, by Application 2020 & 2033
- Table 104: Rest of Asia Pacific ASEAN OOH and DOOH Market Volume (Billion) Forecast, by Application 2020 & 2033
Frequently Asked Questions
1. What is the projected Compound Annual Growth Rate (CAGR) of the ASEAN OOH and DOOH Market?
The projected CAGR is approximately 5.90%.
2. Which companies are prominent players in the ASEAN OOH and DOOH Market?
Key companies in the market include JCDecaux SE, Mooving Walls, Vistar Media, Moove Media Pte Ltd, EYE Indonesia, Clear Channel Singapore Pte Ltd, Plan B Media Public Company Limited, Goldsun Media Group, Unique Media Group, On Digitals Company Limited*List Not Exhaustive.
3. What are the main segments of the ASEAN OOH and DOOH Market?
The market segments include Type, Application , End-user Industry .
4. Can you provide details about the market size?
The market size is estimated to be USD 1.72 Million as of 2022.
5. What are some drivers contributing to market growth?
Ongoing Shift Toward Digital Advertising Aided by Increased Spending on Smart City Projects; Increase in Air Traffic Owing to Growth in Tourism Industry has Aided Spending on Airport Advertisements in ASEAN.
6. What are the notable trends driving market growth?
Ongoing Shift Toward Digital Advertising Aided by Increased Spending on Smart City Projects.
7. Are there any restraints impacting market growth?
Ongoing Shift Toward Digital Advertising Aided by Increased Spending on Smart City Projects; Increase in Air Traffic Owing to Growth in Tourism Industry has Aided Spending on Airport Advertisements in ASEAN.
8. Can you provide examples of recent developments in the market?
March 2024: Adeffi, an out-of-home (OOH) advertising company based in Bangladesh, announced a major expansion of its services into India, Nepal, Thailand, and Vietnam. This strategic move aims to transform how companies in these five countries approach OOH advertising, offering them a robust platform to promote their brands regionally.
9. What pricing options are available for accessing the report?
Pricing options include single-user, multi-user, and enterprise licenses priced at USD 3800, USD 4500, and USD 5800 respectively.
10. Is the market size provided in terms of value or volume?
The market size is provided in terms of value, measured in Million and volume, measured in Billion.
11. Are there any specific market keywords associated with the report?
Yes, the market keyword associated with the report is "ASEAN OOH and DOOH Market," which aids in identifying and referencing the specific market segment covered.
12. How do I determine which pricing option suits my needs best?
The pricing options vary based on user requirements and access needs. Individual users may opt for single-user licenses, while businesses requiring broader access may choose multi-user or enterprise licenses for cost-effective access to the report.
13. Are there any additional resources or data provided in the ASEAN OOH and DOOH Market report?
While the report offers comprehensive insights, it's advisable to review the specific contents or supplementary materials provided to ascertain if additional resources or data are available.
14. How can I stay updated on further developments or reports in the ASEAN OOH and DOOH Market?
To stay informed about further developments, trends, and reports in the ASEAN OOH and DOOH Market, consider subscribing to industry newsletters, following relevant companies and organizations, or regularly checking reputable industry news sources and publications.
Methodology
Step 1 - Identification of Relevant Samples Size from Population Database


Step 2 - Approaches for Defining Global Market Size (Value, Volume* & Price*)

Note*: In applicable scenarios
Step 3 - Data Sources
Primary Research
- Web Analytics
- Survey Reports
- Research Institute
- Latest Research Reports
- Opinion Leaders
Secondary Research
- Annual Reports
- White Paper
- Latest Press Release
- Industry Association
- Paid Database
- Investor Presentations

Step 4 - Data Triangulation
Involves using different sources of information in order to increase the validity of a study
These sources are likely to be stakeholders in a program - participants, other researchers, program staff, other community members, and so on.
Then we put all data in single framework & apply various statistical tools to find out the dynamic on the market.
During the analysis stage, feedback from the stakeholder groups would be compared to determine areas of agreement as well as areas of divergence