

Key Insights
The ASEAN chemical logistics market is projected for significant expansion, expected to reach approximately $47.53 billion by 2025, with a projected Compound Annual Growth Rate (CAGR) of 9.53% through 2033. This growth is driven by the expanding pharmaceutical, specialty chemical, and oil & gas industries, which require sophisticated supply chain solutions. Demand for advanced transportation, warehousing, and green logistics services will further propel market adoption. Key growth factors include the region's robust manufacturing growth, increased foreign direct investment in the chemical sector, and a heightened focus on supply chain resilience and efficiency. The integration of digital technologies, such as IoT and AI, is a critical trend enhancing safety, compliance, and operational efficiency.
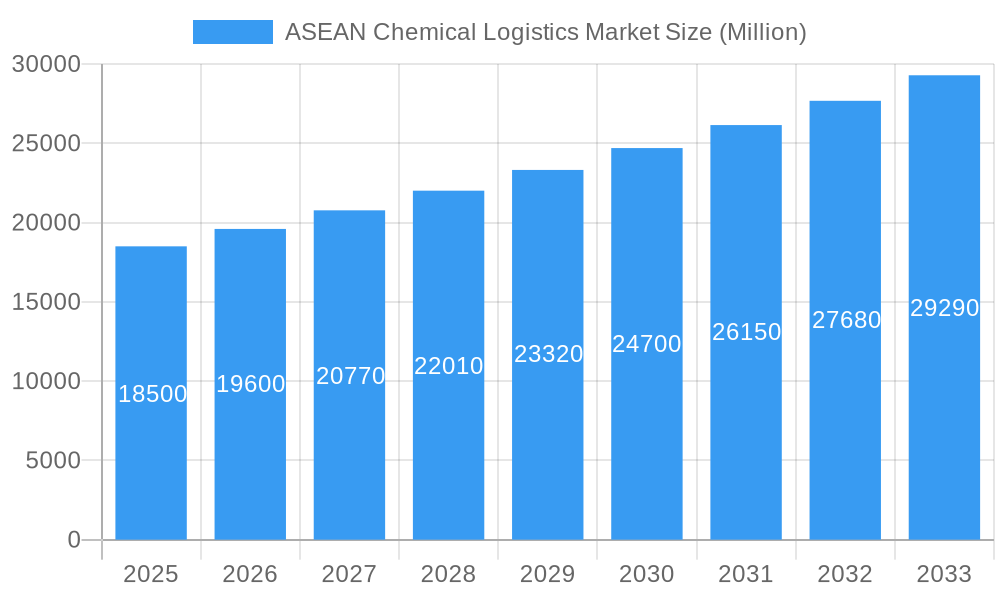
ASEAN Chemical Logistics Market Market Size (In Billion)
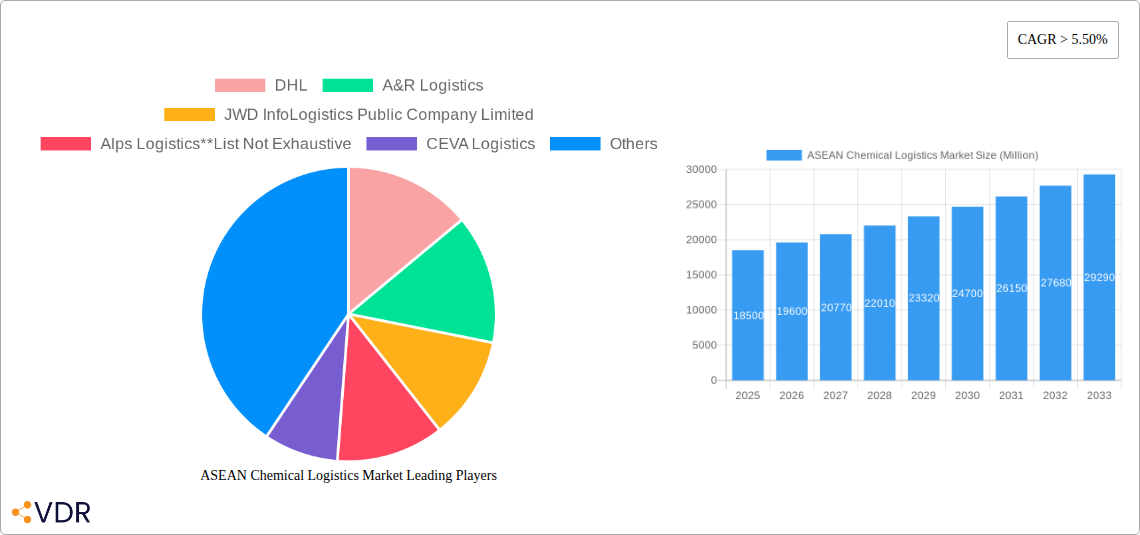
Market challenges include stringent regulatory frameworks for chemical handling, substantial capital investment for specialized infrastructure, and potential supply chain disruptions from geopolitical events or natural disasters. The competitive environment features global leaders like DHL, CEVA Logistics, and Agility Logistics, alongside regional players such as JWD InfoLogistics Public Company Limited and Tiong Nam Logistics Holdings Bhd. These companies are actively investing in service expansion, technology adoption, and strategic partnerships to meet the evolving demands of the chemical industry across transportation, warehousing, and consulting. The "Rest of ASEAN" is anticipated to experience rapid development, supported by emerging industrial centers and increasing logistical investments.
ASEAN Chemical Logistics Market Company Market Share
ASEAN Chemical Logistics Market Report: Navigating Growth & Innovation in a Dynamic Region (2019-2033)
This comprehensive report offers an in-depth analysis of the ASEAN Chemical Logistics Market, a crucial and rapidly expanding sector supporting the region's robust industrial growth. Covering the period from 2019 to 2033, with a Base Year of 2025, this report delves into market dynamics, growth trends, regional dominance, product landscape, challenges, opportunities, and key players shaping the Southeast Asian chemical supply chain. Discover critical insights for chemical manufacturers, logistics providers, investors, and policymakers navigating this complex and high-stakes market.
ASEAN Chemical Logistics Market Market Dynamics & Structure
The ASEAN chemical logistics market is characterized by a moderate to high market concentration, with a mix of global giants and strong regional players. Technological innovation is a significant driver, with increasing adoption of digitalization, automation, and data analytics to enhance efficiency and safety in chemical handling. Regulatory frameworks, particularly concerning hazardous materials transport and storage, are evolving and becoming more stringent across the region, influencing operational strategies. Competitive product substitutes are limited within specialized chemical logistics due to the inherent risks and requirements, but service quality and efficiency act as key differentiators. End-user demographics are shifting, with a growing demand from the pharmaceutical and specialty chemical industries, while the oil and gas sector remains a significant, albeit fluctuating, consumer. Mergers and acquisitions (M&A) are increasingly prevalent as companies seek to expand their geographical reach, service offerings, and technological capabilities. For instance, strategic partnerships and acquisitions are seen as key to consolidating market share and achieving economies of scale.
- Market Concentration: Dominated by a few key international providers, but with growing influence of specialized regional logistics firms.
- Technological Innovation: Focus on IoT for real-time tracking, AI for route optimization, and advanced warehouse management systems (WMS).
- Regulatory Frameworks: Emphasis on compliance with international and local safety standards for dangerous goods.
- End-User Demographics: Rising demand from life sciences and advanced materials sectors.
- M&A Trends: Driven by the need for broader service portfolios and enhanced operational footprints across ASEAN.
ASEAN Chemical Logistics Market Growth Trends & Insights
The ASEAN Chemical Logistics Market is poised for substantial growth, driven by the region's burgeoning manufacturing sector and increasing global trade. The market size is projected to witness a Compound Annual Growth Rate (CAGR) of approximately XX% during the forecast period (2025–2033). Adoption rates for advanced logistics solutions, including specialized warehousing and temperature-controlled transportation, are on an upward trajectory. Technological disruptions, such as the integration of blockchain for supply chain transparency and the use of autonomous vehicles in controlled environments, are beginning to influence operational strategies. Shifts in consumer behavior, particularly the increasing demand for sustainable products and ethical supply chains, are pushing chemical logistics providers to adopt greener practices. The global chemical industry's significant presence in ASEAN further bolsters this growth, with countries actively investing in infrastructure and favorable trade policies to attract chemical manufacturing and related logistics services. The growth in downstream industries such as petrochemicals, pharmaceuticals, and specialty chemicals directly translates into higher demand for specialized logistics solutions, from raw material import to finished product export.
- Market Size Evolution: Expected to grow from an estimated $XX billion in 2025 to over $XX billion by 2033.
- Adoption Rates: Increasing adoption of integrated logistics solutions, including multimodal transportation and end-to-end supply chain management.
- Technological Disruptions: Impact of digitalization, automation, and AI on operational efficiency and safety.
- Consumer Behavior Shifts: Growing emphasis on sustainability and ethical sourcing influencing logistics practices.
- Market Penetration: Increasing penetration of specialized chemical logistics services catering to niche industry needs.
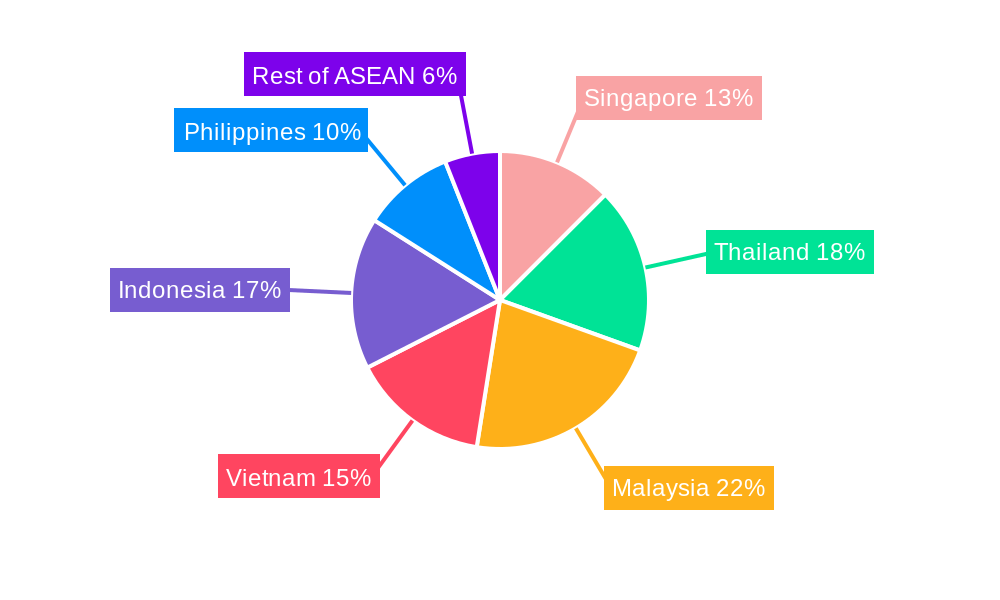
Dominant Regions, Countries, or Segments in ASEAN Chemical Logistics Market
Singapore stands out as a dominant region in the ASEAN Chemical Logistics Market, driven by its strategic location, world-class port infrastructure, and robust economic policies that foster a conducive environment for trade and investment. Its status as a global financial hub also attracts major chemical manufacturers and logistics providers.
- Geography Dominance: Singapore, due to its advanced infrastructure, free trade agreements, and streamlined customs procedures, serves as a critical hub for chemical logistics.
- Key Drivers in Singapore:
- World-class Port Facilities: Facilitating efficient import and export of chemical goods.
- Pro-Business Environment: Attracting foreign direct investment in chemical manufacturing and logistics.
- Advanced Infrastructure: Superior road, rail, and air connectivity for multimodal transport.
- Skilled Workforce: Availability of trained professionals in chemical handling and logistics management.
- Market Share in Singapore: The country holds a significant share in specialized chemical warehousing and transportation services.
- Growth Potential: Continued growth driven by expansion in the pharmaceutical, specialty chemicals, and petrochemical sectors.
While Singapore leads, Malaysia is rapidly emerging as a significant player, particularly with its expanding industrial parks and strategic investments in chemical warehousing. Thailand, with its strong manufacturing base and developing infrastructure, also presents substantial growth opportunities.
- Emerging Leader - Malaysia: Significant investments in chemical warehousing and infrastructure development, especially around key ports like Port Klang.
- Thailand's Potential: Growing demand from petrochemical and automotive sectors, coupled with government initiatives for logistics enhancement.
In terms of Service, Transportation and Warehousing are the dominant segments, reflecting the fundamental needs of the chemical industry. However, Consulting & Management Services is gaining traction as companies seek expert guidance for complex supply chains.
- Dominant Service Segment: Transportation and Warehousing are primary pillars, accounting for a substantial portion of market revenue.
- Growth in Consulting: Increasing demand for specialized consulting services in regulatory compliance, risk management, and supply chain optimization.
For Mode of Transportation, Waterways and Roadways are crucial due to the region's extensive coastlines and developing road networks, facilitating bulk and last-mile deliveries respectively.
- Key Transportation Modes: Waterways for bulk transport and Roadways for regional distribution are paramount.
- Infrastructure Investment: Ongoing development of ports and highways supporting these modes.
The End User landscape is heavily influenced by the Pharmaceutical Industry and Specialty Chemical Industry, both demanding stringent safety and temperature-controlled logistics. The Oil and Gas Industry remains a significant, albeit more cyclical, consumer of chemical logistics services.
- Leading End Users: Pharmaceutical and Specialty Chemical industries drive demand for high-value, specialized logistics.
- Oil and Gas Impact: Significant, but subject to global commodity price fluctuations.
ASEAN Chemical Logistics Market Product Landscape
The ASEAN chemical logistics market is witnessing continuous product innovation focused on enhanced safety, efficiency, and sustainability. This includes the development of advanced temperature-controlled warehousing solutions with precise humidity and environmental controls, essential for sensitive pharmaceutical and specialty chemicals. Specialized bulk liquid transportation services are evolving with state-of-the-art tank containers and dedicated fleet management. Furthermore, the integration of digital platforms for real-time tracking, inventory management, and predictive analytics is becoming a standard offering. Unique selling propositions revolve around the ability to handle a wide range of hazardous and non-hazardous chemicals, adherence to stringent international and local regulations, and the provision of end-to-end supply chain solutions. Technological advancements are enabling better segregation of chemical classes, minimizing risks, and ensuring compliance throughout the logistics chain, thereby improving overall product integrity and customer confidence.
Key Drivers, Barriers & Challenges in ASEAN Chemical Logistics Market
The ASEAN Chemical Logistics Market is propelled by several key drivers, including the rapid industrialization and manufacturing growth across Southeast Asia, increasing demand from burgeoning sectors like pharmaceuticals and specialty chemicals, and favorable government policies aimed at enhancing trade and investment. Technological advancements in supply chain management, such as digitalization and automation, also play a crucial role.
- Key Drivers:
- Industrial Growth: Expanding manufacturing base and increasing chemical production.
- End-User Demand: Rising needs from pharmaceutical, specialty chemical, and consumer goods sectors.
- Government Support: Favorable trade policies and infrastructure development initiatives.
- Technological Adoption: Digitalization and automation for enhanced efficiency and safety.
However, the market faces significant barriers and challenges. These include the complex and evolving regulatory landscape for hazardous materials, which can vary significantly between countries. Infrastructure limitations, particularly in less developed areas, can hinder efficient multimodal transportation. Supply chain disruptions, exacerbated by geopolitical events and natural disasters, pose a constant threat. Furthermore, the high cost of specialized equipment and skilled labor required for safe chemical handling presents a barrier to entry for smaller players and increases operational expenses. Intense competition among logistics providers also pressures profit margins.
- Key Barriers & Challenges:
- Regulatory Complexity: Navigating diverse and evolving national/international regulations.
- Infrastructure Gaps: Inconsistent development of transportation and warehousing facilities.
- Supply Chain Volatility: Vulnerability to disruptions and geopolitical uncertainties.
- High Operational Costs: Investment in specialized equipment and trained personnel.
- Talent Shortage: Demand for skilled professionals in chemical logistics.
Emerging Opportunities in the ASEAN Chemical Logistics Market
Emerging opportunities in the ASEAN Chemical Logistics Market lie in the growing demand for green logistics solutions, driven by increasing environmental awareness and regulatory pressures. This includes the adoption of more fuel-efficient transportation methods, optimized routing to reduce emissions, and sustainable warehousing practices. The expansion of the e-commerce sector in ASEAN, coupled with the increasing complexity of chemical product distribution, also presents an opportunity for specialized last-mile delivery solutions. Furthermore, the rise of the biotechnology and advanced materials sectors will necessitate highly specialized, temperature-sensitive, and secure logistics services. The untapped potential in developing economies within ASEAN, offering a chance to establish robust chemical logistics networks from the ground up, also represents a significant growth avenue.
- Green Logistics: Growing demand for sustainable and environmentally friendly logistics solutions.
- E-commerce Integration: Specialized logistics for chemical products in the digital retail space.
- Emerging Industries: Support for rapidly growing biotechnology and advanced materials sectors.
- Untapped Markets: Expansion into developing economies with increasing industrialization.
Growth Accelerators in the ASEAN Chemical Logistics Market Industry
Several factors are accelerating long-term growth in the ASEAN Chemical Logistics Market. Technological breakthroughs in areas like AI-powered route optimization, predictive maintenance for fleets, and advanced warehouse automation are enhancing operational efficiency and safety, thereby reducing costs and improving service reliability. Strategic partnerships between chemical manufacturers and logistics providers are fostering greater collaboration, leading to more integrated and resilient supply chains. Furthermore, government initiatives focused on regional economic integration, infrastructure development, and trade facilitation are creating a more favorable environment for cross-border logistics. The increasing focus on supply chain resilience post-pandemic is also driving investments in robust and diversified logistics networks.
- Technological Breakthroughs: AI, IoT, and automation driving efficiency and safety.
- Strategic Partnerships: Collaborative efforts between manufacturers and logistics firms.
- Government Initiatives: Regional integration and infrastructure development.
- Supply Chain Resilience: Increased investment in robust and diversified networks.
Key Players Shaping the ASEAN Chemical Logistics Market Market
- DHL
- A&R Logistics
- JWD InfoLogistics Public Company Limited
- Alps Logistics
- CEVA Logistics
- Agility Logistics
- CT Logistics
- Tiong Nam Logistics Holdings Bhd
- Eagles Air & Sea
- BDP International
- Rinchem
- Rhenus Logistics
Notable Milestones in ASEAN Chemical Logistics Market Sector
- October 2022: Rinchem is nearing the completion of a brand-new chemical warehouse based in Malaysia slated to be ready in Q2 of 2023. While the company currently has two other warehouses in the Asia Pacific (Taiwan & South Korea), this will be Rinchem's first warehouse located in Malaysia. The 45,000 sq. ft. dangerous goods warehouse will have the capacity to store 3100 pallet positions. Rinchem's warehouses are custom-built to support the proper segregation of various hazard classes and to offer multiple temperature zones.
- February 2022: In Port Klang, Malaysia, Leschaco recently opened a new chemical and dangerous goods warehouse with a floor space of 120,000 sq. ft on two levels. Within this new facility, up to 13,000 pallets of chemical products and hazardous materials can be safely stored. Contract logistics, especially for chemicals, is a fast-growing market in Malaysia. Accordingly, logistics companies that are reliable partners for transporting and storing chemicals and dangerous goods are in demand. Leschaco (Malaysia) Sdn Bhd has grown with its customers and developed into an important player in the logistics and storage of chemical products in the APAC region.
- October 2021: Ratanakorn Asset and FLS recently agreed to form FLS Supply Chain Centers as a joint venture to design, build, and operate specialized warehouse complexes across Thailand. The first such project will be developed in Maptaphut, Rayong, and involves in its first phase a state-of-the-art, 10,000-square-meter warehouse for the storage and handling of hazardous chemicals, according to the companies. The facility will also include a chemical processing and repackaging facility. The JV said it expects the first phase of construction to be completed in May 2022.
In-Depth ASEAN Chemical Logistics Market Market Outlook
The future market potential for ASEAN chemical logistics is exceptionally bright, driven by ongoing economic expansion and the region's pivotal role in global supply chains. Strategic opportunities abound for companies that can offer integrated, technology-driven, and sustainable logistics solutions. The increasing focus on reshoring and nearshoring manufacturing activities within ASEAN will further amplify the demand for efficient and reliable chemical logistics. Investments in advanced infrastructure, coupled with supportive government policies, are expected to create a highly competitive yet rewarding landscape. Companies that can adapt to evolving regulatory requirements, embrace digital transformation, and prioritize environmental responsibility will be best positioned to capitalize on the substantial growth projected for this dynamic market.
Disclaimer: This report contains predicted values (xx) where specific data was unavailable. All values are presented in Million units. The market is dynamic and subject to change based on global economic conditions and specific regional developments.
ASEAN Chemical Logistics Market Segmentation
-
1. Service
- 1.1. Transportation
- 1.2. Warehous
- 1.3. Consulting & Management Services
- 1.4. Customs & Security
- 1.5. Green Logistics
- 1.6. Others
-
2. Mode of Transportation
- 2.1. Roadways
- 2.2. Railways
- 2.3. Airways
- 2.4. Waterways
- 2.5. Pipelines
-
3. End User
- 3.1. Pharmaceutical Industry
- 3.2. Specialty Chemical Industry
- 3.3. Oil and Gas Industry
- 3.4. Cosmetic Industry
- 3.5. Others
-
4. Geography
- 4.1. Singapore
- 4.2. Thailand
- 4.3. Malaysia
- 4.4. Vietnam
- 4.5. Indonesia
- 4.6. Philippines
- 4.7. Rest of ASEAN
ASEAN Chemical Logistics Market Segmentation By Geography
- 1. Singapore
- 2. Thailand
- 3. Malaysia
- 4. Vietnam
- 5. Indonesia
- 6. Philippines
- 7. Rest of ASEAN
ASEAN Chemical Logistics Market Regional Market Share
Geographic Coverage of ASEAN Chemical Logistics Market
ASEAN Chemical Logistics Market REPORT HIGHLIGHTS
| Aspects | Details |
|---|---|
| Study Period | 2020-2034 |
| Base Year | 2025 |
| Estimated Year | 2026 |
| Forecast Period | 2026-2034 |
| Historical Period | 2020-2025 |
| Growth Rate | CAGR of 9.53% from 2020-2034 |
| Segmentation |
|
Table of Contents
- 1. Introduction
- 1.1. Research Scope
- 1.2. Market Segmentation
- 1.3. Research Objective
- 1.4. Definitions and Assumptions
- 2. Executive Summary
- 2.1. Market Snapshot
- 3. Market Dynamics
- 3.1. Market Drivers
- 3.2. Market Restrains
- 3.3. Market Trends
- 3.4. Market Opportunities
- 4. Market Factor Analysis
- 4.1. Porters Five Forces
- 4.1.1. Bargaining Power of Suppliers
- 4.1.2. Bargaining Power of Buyers
- 4.1.3. Threat of New Entrants
- 4.1.4. Threat of Substitutes
- 4.1.5. Competitive Rivalry
- 4.2. PESTEL analysis
- 4.3. BCG Analysis
- 4.3.1. Stars (High Growth, High Market Share)
- 4.3.2. Cash Cows (Low Growth, High Market Share)
- 4.3.3. Question Mark (High Growth, Low Market Share)
- 4.3.4. Dogs (Low Growth, Low Market Share)
- 4.4. Ansoff Matrix Analysis
- 4.5. Supply Chain Analysis
- 4.6. Regulatory Landscape
- 4.7. Current Market Potential and Opportunity Assessment (TAM–SAM–SOM Framework)
- 4.8. VDR Analyst Note
- 4.1. Porters Five Forces
- 5. Market Analysis, Insights and Forecast 2021-2033
- 5.1. Market Analysis, Insights and Forecast - by Service
- 5.1.1. Transportation
- 5.1.2. Warehous
- 5.1.3. Consulting & Management Services
- 5.1.4. Customs & Security
- 5.1.5. Green Logistics
- 5.1.6. Others
- 5.2. Market Analysis, Insights and Forecast - by Mode of Transportation
- 5.2.1. Roadways
- 5.2.2. Railways
- 5.2.3. Airways
- 5.2.4. Waterways
- 5.2.5. Pipelines
- 5.3. Market Analysis, Insights and Forecast - by End User
- 5.3.1. Pharmaceutical Industry
- 5.3.2. Specialty Chemical Industry
- 5.3.3. Oil and Gas Industry
- 5.3.4. Cosmetic Industry
- 5.3.5. Others
- 5.4. Market Analysis, Insights and Forecast - by Geography
- 5.4.1. Singapore
- 5.4.2. Thailand
- 5.4.3. Malaysia
- 5.4.4. Vietnam
- 5.4.5. Indonesia
- 5.4.6. Philippines
- 5.4.7. Rest of ASEAN
- 5.5. Market Analysis, Insights and Forecast - by Region
- 5.5.1. Singapore
- 5.5.2. Thailand
- 5.5.3. Malaysia
- 5.5.4. Vietnam
- 5.5.5. Indonesia
- 5.5.6. Philippines
- 5.5.7. Rest of ASEAN
- 5.1. Market Analysis, Insights and Forecast - by Service
- 6. Global ASEAN Chemical Logistics Market Analysis, Insights and Forecast, 2021-2033
- 6.1. Market Analysis, Insights and Forecast - by Service
- 6.1.1. Transportation
- 6.1.2. Warehous
- 6.1.3. Consulting & Management Services
- 6.1.4. Customs & Security
- 6.1.5. Green Logistics
- 6.1.6. Others
- 6.2. Market Analysis, Insights and Forecast - by Mode of Transportation
- 6.2.1. Roadways
- 6.2.2. Railways
- 6.2.3. Airways
- 6.2.4. Waterways
- 6.2.5. Pipelines
- 6.3. Market Analysis, Insights and Forecast - by End User
- 6.3.1. Pharmaceutical Industry
- 6.3.2. Specialty Chemical Industry
- 6.3.3. Oil and Gas Industry
- 6.3.4. Cosmetic Industry
- 6.3.5. Others
- 6.4. Market Analysis, Insights and Forecast - by Geography
- 6.4.1. Singapore
- 6.4.2. Thailand
- 6.4.3. Malaysia
- 6.4.4. Vietnam
- 6.4.5. Indonesia
- 6.4.6. Philippines
- 6.4.7. Rest of ASEAN
- 6.1. Market Analysis, Insights and Forecast - by Service
- 7. Singapore ASEAN Chemical Logistics Market Analysis, Insights and Forecast, 2021-2033
- 7.1. Market Analysis, Insights and Forecast - by Service
- 7.1.1. Transportation
- 7.1.2. Warehous
- 7.1.3. Consulting & Management Services
- 7.1.4. Customs & Security
- 7.1.5. Green Logistics
- 7.1.6. Others
- 7.2. Market Analysis, Insights and Forecast - by Mode of Transportation
- 7.2.1. Roadways
- 7.2.2. Railways
- 7.2.3. Airways
- 7.2.4. Waterways
- 7.2.5. Pipelines
- 7.3. Market Analysis, Insights and Forecast - by End User
- 7.3.1. Pharmaceutical Industry
- 7.3.2. Specialty Chemical Industry
- 7.3.3. Oil and Gas Industry
- 7.3.4. Cosmetic Industry
- 7.3.5. Others
- 7.4. Market Analysis, Insights and Forecast - by Geography
- 7.4.1. Singapore
- 7.4.2. Thailand
- 7.4.3. Malaysia
- 7.4.4. Vietnam
- 7.4.5. Indonesia
- 7.4.6. Philippines
- 7.4.7. Rest of ASEAN
- 7.1. Market Analysis, Insights and Forecast - by Service
- 8. Thailand ASEAN Chemical Logistics Market Analysis, Insights and Forecast, 2021-2033
- 8.1. Market Analysis, Insights and Forecast - by Service
- 8.1.1. Transportation
- 8.1.2. Warehous
- 8.1.3. Consulting & Management Services
- 8.1.4. Customs & Security
- 8.1.5. Green Logistics
- 8.1.6. Others
- 8.2. Market Analysis, Insights and Forecast - by Mode of Transportation
- 8.2.1. Roadways
- 8.2.2. Railways
- 8.2.3. Airways
- 8.2.4. Waterways
- 8.2.5. Pipelines
- 8.3. Market Analysis, Insights and Forecast - by End User
- 8.3.1. Pharmaceutical Industry
- 8.3.2. Specialty Chemical Industry
- 8.3.3. Oil and Gas Industry
- 8.3.4. Cosmetic Industry
- 8.3.5. Others
- 8.4. Market Analysis, Insights and Forecast - by Geography
- 8.4.1. Singapore
- 8.4.2. Thailand
- 8.4.3. Malaysia
- 8.4.4. Vietnam
- 8.4.5. Indonesia
- 8.4.6. Philippines
- 8.4.7. Rest of ASEAN
- 8.1. Market Analysis, Insights and Forecast - by Service
- 9. Malaysia ASEAN Chemical Logistics Market Analysis, Insights and Forecast, 2021-2033
- 9.1. Market Analysis, Insights and Forecast - by Service
- 9.1.1. Transportation
- 9.1.2. Warehous
- 9.1.3. Consulting & Management Services
- 9.1.4. Customs & Security
- 9.1.5. Green Logistics
- 9.1.6. Others
- 9.2. Market Analysis, Insights and Forecast - by Mode of Transportation
- 9.2.1. Roadways
- 9.2.2. Railways
- 9.2.3. Airways
- 9.2.4. Waterways
- 9.2.5. Pipelines
- 9.3. Market Analysis, Insights and Forecast - by End User
- 9.3.1. Pharmaceutical Industry
- 9.3.2. Specialty Chemical Industry
- 9.3.3. Oil and Gas Industry
- 9.3.4. Cosmetic Industry
- 9.3.5. Others
- 9.4. Market Analysis, Insights and Forecast - by Geography
- 9.4.1. Singapore
- 9.4.2. Thailand
- 9.4.3. Malaysia
- 9.4.4. Vietnam
- 9.4.5. Indonesia
- 9.4.6. Philippines
- 9.4.7. Rest of ASEAN
- 9.1. Market Analysis, Insights and Forecast - by Service
- 10. Vietnam ASEAN Chemical Logistics Market Analysis, Insights and Forecast, 2021-2033
- 10.1. Market Analysis, Insights and Forecast - by Service
- 10.1.1. Transportation
- 10.1.2. Warehous
- 10.1.3. Consulting & Management Services
- 10.1.4. Customs & Security
- 10.1.5. Green Logistics
- 10.1.6. Others
- 10.2. Market Analysis, Insights and Forecast - by Mode of Transportation
- 10.2.1. Roadways
- 10.2.2. Railways
- 10.2.3. Airways
- 10.2.4. Waterways
- 10.2.5. Pipelines
- 10.3. Market Analysis, Insights and Forecast - by End User
- 10.3.1. Pharmaceutical Industry
- 10.3.2. Specialty Chemical Industry
- 10.3.3. Oil and Gas Industry
- 10.3.4. Cosmetic Industry
- 10.3.5. Others
- 10.4. Market Analysis, Insights and Forecast - by Geography
- 10.4.1. Singapore
- 10.4.2. Thailand
- 10.4.3. Malaysia
- 10.4.4. Vietnam
- 10.4.5. Indonesia
- 10.4.6. Philippines
- 10.4.7. Rest of ASEAN
- 10.1. Market Analysis, Insights and Forecast - by Service
- 11. Indonesia ASEAN Chemical Logistics Market Analysis, Insights and Forecast, 2021-2033
- 11.1. Market Analysis, Insights and Forecast - by Service
- 11.1.1. Transportation
- 11.1.2. Warehous
- 11.1.3. Consulting & Management Services
- 11.1.4. Customs & Security
- 11.1.5. Green Logistics
- 11.1.6. Others
- 11.2. Market Analysis, Insights and Forecast - by Mode of Transportation
- 11.2.1. Roadways
- 11.2.2. Railways
- 11.2.3. Airways
- 11.2.4. Waterways
- 11.2.5. Pipelines
- 11.3. Market Analysis, Insights and Forecast - by End User
- 11.3.1. Pharmaceutical Industry
- 11.3.2. Specialty Chemical Industry
- 11.3.3. Oil and Gas Industry
- 11.3.4. Cosmetic Industry
- 11.3.5. Others
- 11.4. Market Analysis, Insights and Forecast - by Geography
- 11.4.1. Singapore
- 11.4.2. Thailand
- 11.4.3. Malaysia
- 11.4.4. Vietnam
- 11.4.5. Indonesia
- 11.4.6. Philippines
- 11.4.7. Rest of ASEAN
- 11.1. Market Analysis, Insights and Forecast - by Service
- 12. Philippines ASEAN Chemical Logistics Market Analysis, Insights and Forecast, 2021-2033
- 12.1. Market Analysis, Insights and Forecast - by Service
- 12.1.1. Transportation
- 12.1.2. Warehous
- 12.1.3. Consulting & Management Services
- 12.1.4. Customs & Security
- 12.1.5. Green Logistics
- 12.1.6. Others
- 12.2. Market Analysis, Insights and Forecast - by Mode of Transportation
- 12.2.1. Roadways
- 12.2.2. Railways
- 12.2.3. Airways
- 12.2.4. Waterways
- 12.2.5. Pipelines
- 12.3. Market Analysis, Insights and Forecast - by End User
- 12.3.1. Pharmaceutical Industry
- 12.3.2. Specialty Chemical Industry
- 12.3.3. Oil and Gas Industry
- 12.3.4. Cosmetic Industry
- 12.3.5. Others
- 12.4. Market Analysis, Insights and Forecast - by Geography
- 12.4.1. Singapore
- 12.4.2. Thailand
- 12.4.3. Malaysia
- 12.4.4. Vietnam
- 12.4.5. Indonesia
- 12.4.6. Philippines
- 12.4.7. Rest of ASEAN
- 12.1. Market Analysis, Insights and Forecast - by Service
- 13. Rest of ASEAN ASEAN Chemical Logistics Market Analysis, Insights and Forecast, 2021-2033
- 13.1. Market Analysis, Insights and Forecast - by Service
- 13.1.1. Transportation
- 13.1.2. Warehous
- 13.1.3. Consulting & Management Services
- 13.1.4. Customs & Security
- 13.1.5. Green Logistics
- 13.1.6. Others
- 13.2. Market Analysis, Insights and Forecast - by Mode of Transportation
- 13.2.1. Roadways
- 13.2.2. Railways
- 13.2.3. Airways
- 13.2.4. Waterways
- 13.2.5. Pipelines
- 13.3. Market Analysis, Insights and Forecast - by End User
- 13.3.1. Pharmaceutical Industry
- 13.3.2. Specialty Chemical Industry
- 13.3.3. Oil and Gas Industry
- 13.3.4. Cosmetic Industry
- 13.3.5. Others
- 13.4. Market Analysis, Insights and Forecast - by Geography
- 13.4.1. Singapore
- 13.4.2. Thailand
- 13.4.3. Malaysia
- 13.4.4. Vietnam
- 13.4.5. Indonesia
- 13.4.6. Philippines
- 13.4.7. Rest of ASEAN
- 13.1. Market Analysis, Insights and Forecast - by Service
- 14. Competitive Analysis
- 14.1. Company Profiles
- 14.1.1 DHL
- 14.1.1.1. Company Overview
- 14.1.1.2. Products
- 14.1.1.3. Company Financials
- 14.1.1.4. SWOT Analysis
- 14.1.2 A&R Logistics
- 14.1.2.1. Company Overview
- 14.1.2.2. Products
- 14.1.2.3. Company Financials
- 14.1.2.4. SWOT Analysis
- 14.1.3 JWD InfoLogistics Public Company Limited
- 14.1.3.1. Company Overview
- 14.1.3.2. Products
- 14.1.3.3. Company Financials
- 14.1.3.4. SWOT Analysis
- 14.1.4 Alps Logistics**List Not Exhaustive
- 14.1.4.1. Company Overview
- 14.1.4.2. Products
- 14.1.4.3. Company Financials
- 14.1.4.4. SWOT Analysis
- 14.1.5 CEVA Logistics
- 14.1.5.1. Company Overview
- 14.1.5.2. Products
- 14.1.5.3. Company Financials
- 14.1.5.4. SWOT Analysis
- 14.1.6 Agility Logistics
- 14.1.6.1. Company Overview
- 14.1.6.2. Products
- 14.1.6.3. Company Financials
- 14.1.6.4. SWOT Analysis
- 14.1.7 CT Logistics
- 14.1.7.1. Company Overview
- 14.1.7.2. Products
- 14.1.7.3. Company Financials
- 14.1.7.4. SWOT Analysis
- 14.1.8 Tiong Nam Logistics Holdings BhD
- 14.1.8.1. Company Overview
- 14.1.8.2. Products
- 14.1.8.3. Company Financials
- 14.1.8.4. SWOT Analysis
- 14.1.9 Eagles Air & Sea
- 14.1.9.1. Company Overview
- 14.1.9.2. Products
- 14.1.9.3. Company Financials
- 14.1.9.4. SWOT Analysis
- 14.1.10 BDP International
- 14.1.10.1. Company Overview
- 14.1.10.2. Products
- 14.1.10.3. Company Financials
- 14.1.10.4. SWOT Analysis
- 14.1.11 Rinchem
- 14.1.11.1. Company Overview
- 14.1.11.2. Products
- 14.1.11.3. Company Financials
- 14.1.11.4. SWOT Analysis
- 14.1.12 Rhenus Logistics
- 14.1.12.1. Company Overview
- 14.1.12.2. Products
- 14.1.12.3. Company Financials
- 14.1.12.4. SWOT Analysis
- 14.1.1 DHL
- 14.2. Market Entropy
- 14.2.1 Company's Key Areas Served
- 14.2.2 Recent Developments
- 14.3. Company Market Share Analysis 2025
- 14.3.1 Top 5 Companies Market Share Analysis
- 14.3.2 Top 3 Companies Market Share Analysis
- 14.4. List of Potential Customers
- 15. Research Methodology
List of Figures
- Figure 1: Global ASEAN Chemical Logistics Market Revenue Breakdown (billion, %) by Region 2025 & 2033
- Figure 2: Singapore ASEAN Chemical Logistics Market Revenue (billion), by Service 2025 & 2033
- Figure 3: Singapore ASEAN Chemical Logistics Market Revenue Share (%), by Service 2025 & 2033
- Figure 4: Singapore ASEAN Chemical Logistics Market Revenue (billion), by Mode of Transportation 2025 & 2033
- Figure 5: Singapore ASEAN Chemical Logistics Market Revenue Share (%), by Mode of Transportation 2025 & 2033
- Figure 6: Singapore ASEAN Chemical Logistics Market Revenue (billion), by End User 2025 & 2033
- Figure 7: Singapore ASEAN Chemical Logistics Market Revenue Share (%), by End User 2025 & 2033
- Figure 8: Singapore ASEAN Chemical Logistics Market Revenue (billion), by Geography 2025 & 2033
- Figure 9: Singapore ASEAN Chemical Logistics Market Revenue Share (%), by Geography 2025 & 2033
- Figure 10: Singapore ASEAN Chemical Logistics Market Revenue (billion), by Country 2025 & 2033
- Figure 11: Singapore ASEAN Chemical Logistics Market Revenue Share (%), by Country 2025 & 2033
- Figure 12: Thailand ASEAN Chemical Logistics Market Revenue (billion), by Service 2025 & 2033
- Figure 13: Thailand ASEAN Chemical Logistics Market Revenue Share (%), by Service 2025 & 2033
- Figure 14: Thailand ASEAN Chemical Logistics Market Revenue (billion), by Mode of Transportation 2025 & 2033
- Figure 15: Thailand ASEAN Chemical Logistics Market Revenue Share (%), by Mode of Transportation 2025 & 2033
- Figure 16: Thailand ASEAN Chemical Logistics Market Revenue (billion), by End User 2025 & 2033
- Figure 17: Thailand ASEAN Chemical Logistics Market Revenue Share (%), by End User 2025 & 2033
- Figure 18: Thailand ASEAN Chemical Logistics Market Revenue (billion), by Geography 2025 & 2033
- Figure 19: Thailand ASEAN Chemical Logistics Market Revenue Share (%), by Geography 2025 & 2033
- Figure 20: Thailand ASEAN Chemical Logistics Market Revenue (billion), by Country 2025 & 2033
- Figure 21: Thailand ASEAN Chemical Logistics Market Revenue Share (%), by Country 2025 & 2033
- Figure 22: Malaysia ASEAN Chemical Logistics Market Revenue (billion), by Service 2025 & 2033
- Figure 23: Malaysia ASEAN Chemical Logistics Market Revenue Share (%), by Service 2025 & 2033
- Figure 24: Malaysia ASEAN Chemical Logistics Market Revenue (billion), by Mode of Transportation 2025 & 2033
- Figure 25: Malaysia ASEAN Chemical Logistics Market Revenue Share (%), by Mode of Transportation 2025 & 2033
- Figure 26: Malaysia ASEAN Chemical Logistics Market Revenue (billion), by End User 2025 & 2033
- Figure 27: Malaysia ASEAN Chemical Logistics Market Revenue Share (%), by End User 2025 & 2033
- Figure 28: Malaysia ASEAN Chemical Logistics Market Revenue (billion), by Geography 2025 & 2033
- Figure 29: Malaysia ASEAN Chemical Logistics Market Revenue Share (%), by Geography 2025 & 2033
- Figure 30: Malaysia ASEAN Chemical Logistics Market Revenue (billion), by Country 2025 & 2033
- Figure 31: Malaysia ASEAN Chemical Logistics Market Revenue Share (%), by Country 2025 & 2033
- Figure 32: Vietnam ASEAN Chemical Logistics Market Revenue (billion), by Service 2025 & 2033
- Figure 33: Vietnam ASEAN Chemical Logistics Market Revenue Share (%), by Service 2025 & 2033
- Figure 34: Vietnam ASEAN Chemical Logistics Market Revenue (billion), by Mode of Transportation 2025 & 2033
- Figure 35: Vietnam ASEAN Chemical Logistics Market Revenue Share (%), by Mode of Transportation 2025 & 2033
- Figure 36: Vietnam ASEAN Chemical Logistics Market Revenue (billion), by End User 2025 & 2033
- Figure 37: Vietnam ASEAN Chemical Logistics Market Revenue Share (%), by End User 2025 & 2033
- Figure 38: Vietnam ASEAN Chemical Logistics Market Revenue (billion), by Geography 2025 & 2033
- Figure 39: Vietnam ASEAN Chemical Logistics Market Revenue Share (%), by Geography 2025 & 2033
- Figure 40: Vietnam ASEAN Chemical Logistics Market Revenue (billion), by Country 2025 & 2033
- Figure 41: Vietnam ASEAN Chemical Logistics Market Revenue Share (%), by Country 2025 & 2033
- Figure 42: Indonesia ASEAN Chemical Logistics Market Revenue (billion), by Service 2025 & 2033
- Figure 43: Indonesia ASEAN Chemical Logistics Market Revenue Share (%), by Service 2025 & 2033
- Figure 44: Indonesia ASEAN Chemical Logistics Market Revenue (billion), by Mode of Transportation 2025 & 2033
- Figure 45: Indonesia ASEAN Chemical Logistics Market Revenue Share (%), by Mode of Transportation 2025 & 2033
- Figure 46: Indonesia ASEAN Chemical Logistics Market Revenue (billion), by End User 2025 & 2033
- Figure 47: Indonesia ASEAN Chemical Logistics Market Revenue Share (%), by End User 2025 & 2033
- Figure 48: Indonesia ASEAN Chemical Logistics Market Revenue (billion), by Geography 2025 & 2033
- Figure 49: Indonesia ASEAN Chemical Logistics Market Revenue Share (%), by Geography 2025 & 2033
- Figure 50: Indonesia ASEAN Chemical Logistics Market Revenue (billion), by Country 2025 & 2033
- Figure 51: Indonesia ASEAN Chemical Logistics Market Revenue Share (%), by Country 2025 & 2033
- Figure 52: Philippines ASEAN Chemical Logistics Market Revenue (billion), by Service 2025 & 2033
- Figure 53: Philippines ASEAN Chemical Logistics Market Revenue Share (%), by Service 2025 & 2033
- Figure 54: Philippines ASEAN Chemical Logistics Market Revenue (billion), by Mode of Transportation 2025 & 2033
- Figure 55: Philippines ASEAN Chemical Logistics Market Revenue Share (%), by Mode of Transportation 2025 & 2033
- Figure 56: Philippines ASEAN Chemical Logistics Market Revenue (billion), by End User 2025 & 2033
- Figure 57: Philippines ASEAN Chemical Logistics Market Revenue Share (%), by End User 2025 & 2033
- Figure 58: Philippines ASEAN Chemical Logistics Market Revenue (billion), by Geography 2025 & 2033
- Figure 59: Philippines ASEAN Chemical Logistics Market Revenue Share (%), by Geography 2025 & 2033
- Figure 60: Philippines ASEAN Chemical Logistics Market Revenue (billion), by Country 2025 & 2033
- Figure 61: Philippines ASEAN Chemical Logistics Market Revenue Share (%), by Country 2025 & 2033
- Figure 62: Rest of ASEAN ASEAN Chemical Logistics Market Revenue (billion), by Service 2025 & 2033
- Figure 63: Rest of ASEAN ASEAN Chemical Logistics Market Revenue Share (%), by Service 2025 & 2033
- Figure 64: Rest of ASEAN ASEAN Chemical Logistics Market Revenue (billion), by Mode of Transportation 2025 & 2033
- Figure 65: Rest of ASEAN ASEAN Chemical Logistics Market Revenue Share (%), by Mode of Transportation 2025 & 2033
- Figure 66: Rest of ASEAN ASEAN Chemical Logistics Market Revenue (billion), by End User 2025 & 2033
- Figure 67: Rest of ASEAN ASEAN Chemical Logistics Market Revenue Share (%), by End User 2025 & 2033
- Figure 68: Rest of ASEAN ASEAN Chemical Logistics Market Revenue (billion), by Geography 2025 & 2033
- Figure 69: Rest of ASEAN ASEAN Chemical Logistics Market Revenue Share (%), by Geography 2025 & 2033
- Figure 70: Rest of ASEAN ASEAN Chemical Logistics Market Revenue (billion), by Country 2025 & 2033
- Figure 71: Rest of ASEAN ASEAN Chemical Logistics Market Revenue Share (%), by Country 2025 & 2033
List of Tables
- Table 1: Global ASEAN Chemical Logistics Market Revenue billion Forecast, by Service 2020 & 2033
- Table 2: Global ASEAN Chemical Logistics Market Revenue billion Forecast, by Mode of Transportation 2020 & 2033
- Table 3: Global ASEAN Chemical Logistics Market Revenue billion Forecast, by End User 2020 & 2033
- Table 4: Global ASEAN Chemical Logistics Market Revenue billion Forecast, by Geography 2020 & 2033
- Table 5: Global ASEAN Chemical Logistics Market Revenue billion Forecast, by Region 2020 & 2033
- Table 6: Global ASEAN Chemical Logistics Market Revenue billion Forecast, by Service 2020 & 2033
- Table 7: Global ASEAN Chemical Logistics Market Revenue billion Forecast, by Mode of Transportation 2020 & 2033
- Table 8: Global ASEAN Chemical Logistics Market Revenue billion Forecast, by End User 2020 & 2033
- Table 9: Global ASEAN Chemical Logistics Market Revenue billion Forecast, by Geography 2020 & 2033
- Table 10: Global ASEAN Chemical Logistics Market Revenue billion Forecast, by Country 2020 & 2033
- Table 11: Global ASEAN Chemical Logistics Market Revenue billion Forecast, by Service 2020 & 2033
- Table 12: Global ASEAN Chemical Logistics Market Revenue billion Forecast, by Mode of Transportation 2020 & 2033
- Table 13: Global ASEAN Chemical Logistics Market Revenue billion Forecast, by End User 2020 & 2033
- Table 14: Global ASEAN Chemical Logistics Market Revenue billion Forecast, by Geography 2020 & 2033
- Table 15: Global ASEAN Chemical Logistics Market Revenue billion Forecast, by Country 2020 & 2033
- Table 16: Global ASEAN Chemical Logistics Market Revenue billion Forecast, by Service 2020 & 2033
- Table 17: Global ASEAN Chemical Logistics Market Revenue billion Forecast, by Mode of Transportation 2020 & 2033
- Table 18: Global ASEAN Chemical Logistics Market Revenue billion Forecast, by End User 2020 & 2033
- Table 19: Global ASEAN Chemical Logistics Market Revenue billion Forecast, by Geography 2020 & 2033
- Table 20: Global ASEAN Chemical Logistics Market Revenue billion Forecast, by Country 2020 & 2033
- Table 21: Global ASEAN Chemical Logistics Market Revenue billion Forecast, by Service 2020 & 2033
- Table 22: Global ASEAN Chemical Logistics Market Revenue billion Forecast, by Mode of Transportation 2020 & 2033
- Table 23: Global ASEAN Chemical Logistics Market Revenue billion Forecast, by End User 2020 & 2033
- Table 24: Global ASEAN Chemical Logistics Market Revenue billion Forecast, by Geography 2020 & 2033
- Table 25: Global ASEAN Chemical Logistics Market Revenue billion Forecast, by Country 2020 & 2033
- Table 26: Global ASEAN Chemical Logistics Market Revenue billion Forecast, by Service 2020 & 2033
- Table 27: Global ASEAN Chemical Logistics Market Revenue billion Forecast, by Mode of Transportation 2020 & 2033
- Table 28: Global ASEAN Chemical Logistics Market Revenue billion Forecast, by End User 2020 & 2033
- Table 29: Global ASEAN Chemical Logistics Market Revenue billion Forecast, by Geography 2020 & 2033
- Table 30: Global ASEAN Chemical Logistics Market Revenue billion Forecast, by Country 2020 & 2033
- Table 31: Global ASEAN Chemical Logistics Market Revenue billion Forecast, by Service 2020 & 2033
- Table 32: Global ASEAN Chemical Logistics Market Revenue billion Forecast, by Mode of Transportation 2020 & 2033
- Table 33: Global ASEAN Chemical Logistics Market Revenue billion Forecast, by End User 2020 & 2033
- Table 34: Global ASEAN Chemical Logistics Market Revenue billion Forecast, by Geography 2020 & 2033
- Table 35: Global ASEAN Chemical Logistics Market Revenue billion Forecast, by Country 2020 & 2033
- Table 36: Global ASEAN Chemical Logistics Market Revenue billion Forecast, by Service 2020 & 2033
- Table 37: Global ASEAN Chemical Logistics Market Revenue billion Forecast, by Mode of Transportation 2020 & 2033
- Table 38: Global ASEAN Chemical Logistics Market Revenue billion Forecast, by End User 2020 & 2033
- Table 39: Global ASEAN Chemical Logistics Market Revenue billion Forecast, by Geography 2020 & 2033
- Table 40: Global ASEAN Chemical Logistics Market Revenue billion Forecast, by Country 2020 & 2033
Frequently Asked Questions
1. What is the projected Compound Annual Growth Rate (CAGR) of the ASEAN Chemical Logistics Market?
The projected CAGR is approximately 9.53%.
2. Which companies are prominent players in the ASEAN Chemical Logistics Market?
Key companies in the market include DHL, A&R Logistics, JWD InfoLogistics Public Company Limited, Alps Logistics**List Not Exhaustive, CEVA Logistics, Agility Logistics, CT Logistics, Tiong Nam Logistics Holdings BhD, Eagles Air & Sea, BDP International, Rinchem, Rhenus Logistics.
3. What are the main segments of the ASEAN Chemical Logistics Market?
The market segments include Service, Mode of Transportation, End User, Geography.
4. Can you provide details about the market size?
The market size is estimated to be USD 47.53 billion as of 2022.
5. What are some drivers contributing to market growth?
The Rise in Demand for Specialty Chemicals in ASEAN Countries Increasing Trade Logistics Activity; Partnerships and Collaborations Between Major Players in the Chemical Logistics Market are Being Formed for the Creation of Innovative Goods and Technologically Enhanced Services.
6. What are the notable trends driving market growth?
The Rise in Chemical Production is Expected to Propel the Growth of the Chemical Logistics Market.
7. Are there any restraints impacting market growth?
Complexities Related to Chemical Logistics; High Cost Involved in the Transportation of Chemicals.
8. Can you provide examples of recent developments in the market?
October 2022: Rinchem is nearing the completion of a brand-new chemical warehouse based in Malaysia slated to be ready in Q2 of 2023. While the company currently has two other warehouses in the Asia Pacific (Taiwan & South Korea), this will be Rinchem's first warehouse located in Malaysia. The 45,000 sq. ft. dangerous goods warehouse will have the capacity to store 3100 pallet positions. Rinchem's warehouses are custom-built to support the proper segregation of various hazard classes and to offer multiple temperature zones.
9. What pricing options are available for accessing the report?
Pricing options include single-user, multi-user, and enterprise licenses priced at USD 4750, USD 5250, and USD 8750 respectively.
10. Is the market size provided in terms of value or volume?
The market size is provided in terms of value, measured in billion.
11. Are there any specific market keywords associated with the report?
Yes, the market keyword associated with the report is "ASEAN Chemical Logistics Market," which aids in identifying and referencing the specific market segment covered.
12. How do I determine which pricing option suits my needs best?
The pricing options vary based on user requirements and access needs. Individual users may opt for single-user licenses, while businesses requiring broader access may choose multi-user or enterprise licenses for cost-effective access to the report.
13. Are there any additional resources or data provided in the ASEAN Chemical Logistics Market report?
While the report offers comprehensive insights, it's advisable to review the specific contents or supplementary materials provided to ascertain if additional resources or data are available.
14. How can I stay updated on further developments or reports in the ASEAN Chemical Logistics Market?
To stay informed about further developments, trends, and reports in the ASEAN Chemical Logistics Market, consider subscribing to industry newsletters, following relevant companies and organizations, or regularly checking reputable industry news sources and publications.
Methodology
Step 1 - Identification of Relevant Samples Size from Population Database


Step 2 - Approaches for Defining Global Market Size (Value, Volume* & Price*)

Note*: In applicable scenarios
Step 3 - Data Sources
Primary Research
- Web Analytics
- Survey Reports
- Research Institute
- Latest Research Reports
- Opinion Leaders
Secondary Research
- Annual Reports
- White Paper
- Latest Press Release
- Industry Association
- Paid Database
- Investor Presentations

Step 4 - Data Triangulation
Involves using different sources of information in order to increase the validity of a study
These sources are likely to be stakeholders in a program - participants, other researchers, program staff, other community members, and so on.
Then we put all data in single framework & apply various statistical tools to find out the dynamic on the market.
During the analysis stage, feedback from the stakeholder groups would be compared to determine areas of agreement as well as areas of divergence