
Key Insights
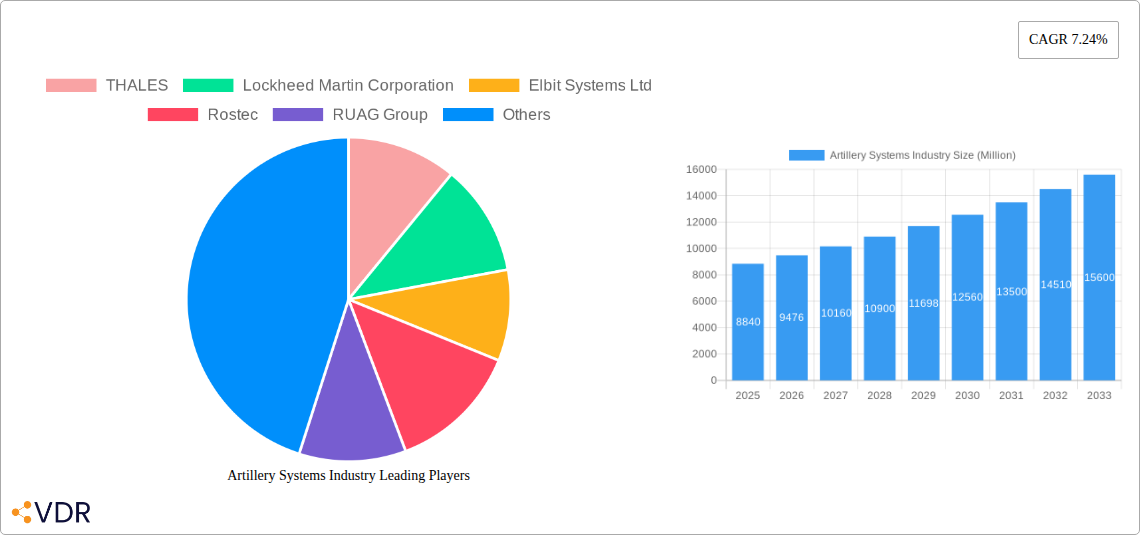
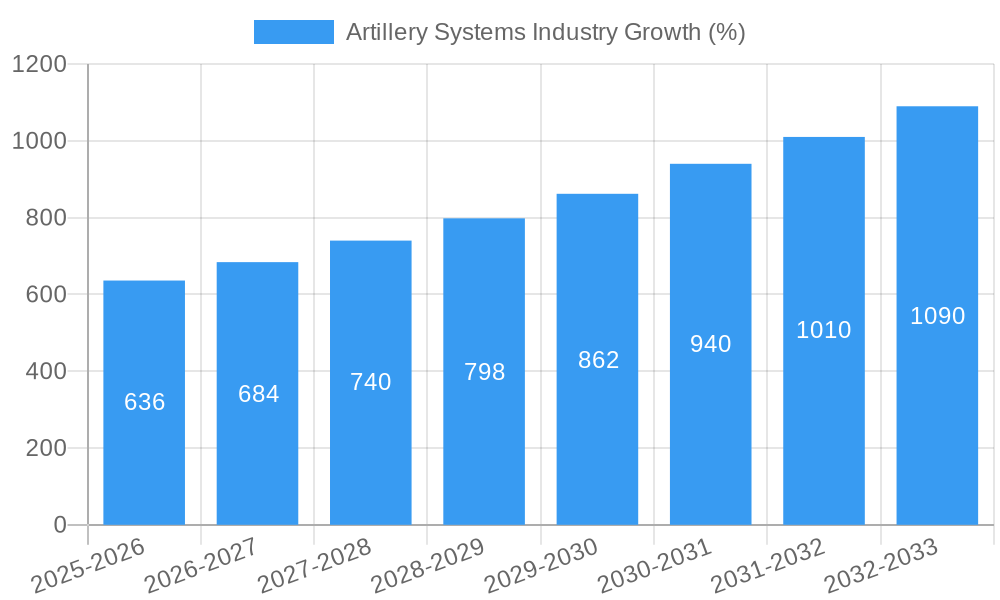
The global artillery systems market, valued at $8.84 billion in 2025, is projected to experience robust growth, driven by a compound annual growth rate (CAGR) of 7.24% from 2025 to 2033. This expansion is fueled by several key factors. Firstly, geopolitical instability and ongoing conflicts across various regions are driving increased demand for advanced artillery systems capable of delivering precise and long-range firepower. Secondly, technological advancements, such as the integration of precision-guided munitions, improved fire control systems, and the development of autonomous artillery platforms, are enhancing the effectiveness and lethality of artillery, further boosting market growth. The increasing adoption of network-centric warfare strategies, enabling better coordination and targeting capabilities, also contributes to market expansion. Finally, government investments in modernizing their defense capabilities, particularly among major global powers, fuel consistent demand. Segmentation reveals that long-range artillery systems are witnessing significant demand, driven by the need for extended strike capabilities. Similarly, the howitzer segment holds a substantial market share due to its widespread use across various military applications. Leading players such as Thales, Lockheed Martin, and Elbit Systems are actively investing in research and development, focusing on improving the accuracy, range, and adaptability of their systems, reinforcing the market's competitive landscape.
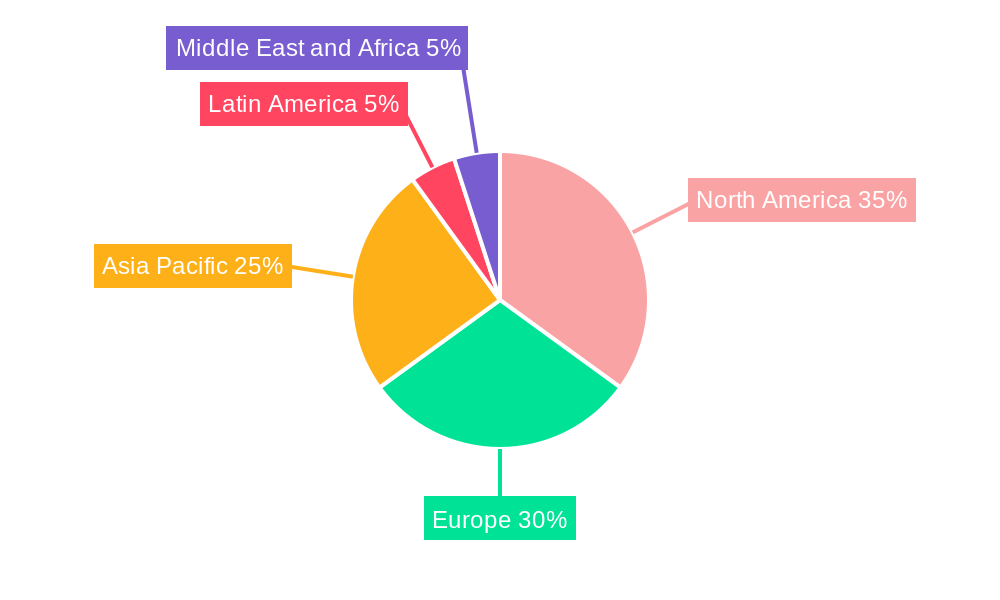
The market's growth, however, is not without its challenges. Budgetary constraints in some regions, coupled with the high cost of developing and maintaining advanced artillery systems, may act as a restraint on market expansion. Furthermore, the increasing focus on alternative warfare technologies, such as cyber warfare and drone technology, could potentially divert some defense budgets, slowing down the overall market growth. Nevertheless, the consistent demand for enhanced firepower and the continued technological advancements in artillery systems are likely to ensure the market's continued growth trajectory throughout the forecast period. Regional analysis indicates that North America and Europe currently hold significant market shares, driven by substantial defense spending and ongoing technological innovation. However, the Asia-Pacific region is projected to witness significant growth in the coming years due to rising geopolitical tensions and increasing military modernization efforts in several nations within the region.
Artillery Systems Industry Market Report: 2019-2033
This comprehensive report provides an in-depth analysis of the global artillery systems market, encompassing historical data (2019-2024), current estimations (2025), and future forecasts (2025-2033). The report meticulously examines market dynamics, growth trends, regional dominance, product landscapes, key players, and emerging opportunities within this crucial defense sector. With a focus on key segments like Howitzers, Mortars, and Rocket Artillery, across short, medium, and long-range capabilities, this report is an essential resource for industry professionals, investors, and government agencies.
Artillery Systems Industry Market Dynamics & Structure
The global artillery systems market, valued at xx million units in 2025, is characterized by moderate concentration with a few dominant players and numerous specialized regional manufacturers. Technological innovation, particularly in precision-guided munitions and autonomous systems, is a major driver. Stringent regulatory frameworks concerning export controls and weapon proliferation significantly influence market access and growth. Substitutes, such as drone technology and advanced missile systems, pose a competitive threat, although artillery maintains a crucial role in conventional warfare. End-users are primarily national militaries and government defense agencies, with some involvement from international peacekeeping organizations. The market has seen a moderate level of M&A activity in recent years, driven by consolidation amongst defense contractors.
- Market Concentration: Moderately concentrated, with top 5 players holding approximately xx% market share in 2025.
- Technological Innovation: Focus on precision-guided munitions, autonomous targeting, and increased range capabilities.
- Regulatory Framework: Strict export controls and international treaties heavily influence market dynamics.
- Competitive Substitutes: Drones, advanced missiles, and other precision strike capabilities.
- M&A Activity: xx deals closed between 2019 and 2024, with a focus on expanding capabilities and market reach. Average deal size: xx million units.
- Innovation Barriers: High R&D costs, stringent testing and certification processes, and geopolitical factors.
Artillery Systems Industry Growth Trends & Insights
The artillery systems market is projected to experience a CAGR of xx% during the forecast period (2025-2033), driven by escalating geopolitical tensions, modernization efforts by various armed forces, and the continuous demand for advanced artillery systems. Adoption rates are influenced by budgetary allocations, technological advancements, and regional security concerns. Technological disruptions, such as the integration of AI and improved communication systems, are revolutionizing artillery systems' effectiveness and precision. Consumer behavior, in this case, referring to government defense spending patterns, is significantly influenced by global security landscapes and national defense priorities.
(Note: This section would contain a 600-word analysis using the provided XXX data source, detailing market size evolution, adoption rates, and technological disruptions with specific metrics such as CAGR and market penetration).
Dominant Regions, Countries, or Segments in Artillery Systems Industry
The North American and European regions dominate the artillery systems market, accounting for approximately xx% of the global market share in 2025. Within these regions, the USA and certain European nations like the UK and France are key contributors, driving growth due to robust defense budgets and active participation in international conflicts. The significant segments driving growth include:
Type: Rocket Artillery and Howitzers dominate the market, with a combined share of xx% in 2025. Growing demand for long-range precision strike capabilities fuels this dominance.
Range: Long-range artillery (above 60 kilometers) is experiencing the highest growth rate, driven by advancements in projectile technology and the need for deep strike capabilities.
Key Drivers: High defense spending in key regions, modernization programs by armed forces, geopolitical instability.
Market Share: North America (xx%), Europe (xx%), Asia-Pacific (xx%), Rest of World (xx%).
(Note: This section would contain a 600-word analysis with a deeper dive into regional and segmental dominance, growth drivers, and market share data.)
Artillery Systems Industry Product Landscape
Current artillery systems showcase significant advancements in precision, range, and automation. Key innovations include guided munitions, improved fire control systems, and the integration of unmanned aerial vehicles (UAVs) for reconnaissance and targeting. These features offer unique selling propositions such as increased accuracy, reduced collateral damage, and enhanced battlefield situational awareness. Technological advancements are primarily focused on improving lethality, range, and survivability of the systems.
Key Drivers, Barriers & Challenges in Artillery Systems Industry
Key Drivers:
- Increased defense budgets globally.
- Modernization of armed forces.
- Demand for precision-guided munitions.
- Geopolitical instability and regional conflicts.
Key Challenges:
- High R&D costs and manufacturing complexity.
- Stringent export control regulations.
- Intense competition among major defense contractors.
- Supply chain disruptions and material shortages impacting manufacturing timelines and production costs by approximately xx%.
Emerging Opportunities in Artillery Systems Industry
- Development and integration of AI and machine learning for improved target acquisition and fire control.
- Expansion into emerging markets with growing defense budgets.
- Development of hypersonic artillery projectiles extending range and speed significantly.
- Increased focus on developing lighter, more mobile systems adaptable to diverse terrains.
Growth Accelerators in the Artillery Systems Industry
Technological breakthroughs in areas like precision guidance, autonomous systems, and improved ammunition are key long-term growth catalysts. Strategic partnerships between defense contractors and technology companies will further accelerate innovation. Market expansion strategies focusing on emerging markets and diversifying product portfolios will provide additional growth opportunities.
Key Players Shaping the Artillery Systems Industry Market
- THALES
- Lockheed Martin Corporation
- Elbit Systems Ltd
- Rostec
- RUAG Group
- Denel SOC Ltd
- Nexter Group
- Leonardo S p A
- Norinco International Cooperation Ltd
- Hanwha Group
- Avibras Indústria Aeroespacial SA
- Singapore Technologies Engineering Ltd
- Rheinmetall A
- BAE Systems plc
Notable Milestones in Artillery Systems Industry Sector
- July 2023: Elbit Systems Ltd. awarded a USD 150 million contract for PULS™ rocket launchers and precision-guided rockets. This significantly boosts Elbit's market position and highlights the growing demand for long-range precision systems.
- July 2023: The UK MoD awarded a USD 4.5 million contract to BAE Systems Bofors AB for Archer Artillery System support. This signifies ongoing investment in existing systems and emphasizes the importance of maintenance and upgrades within the market.
In-Depth Artillery Systems Industry Market Outlook
The artillery systems market is poised for sustained growth driven by ongoing technological advancements and increased defense spending globally. Strategic partnerships and innovative product development will continue to shape market dynamics. Focus areas such as hypersonic projectiles, AI-enabled targeting, and autonomous operation systems represent key opportunities for expansion and increased market share for key players. The market exhibits promising potential for sustained growth over the next decade.
Artillery Systems Industry Segmentation
-
1. Type
- 1.1. Howitzer
- 1.2. Mortar
- 1.3. Anti-air Artillery
- 1.4. Rocket Artillery
- 1.5. Other Types (Naval and Coastal Artillery)
-
2. Range
- 2.1. Short Range (5-30 kilometers)
- 2.2. Medium Range (31-60 kilometers)
- 2.3. Long Range (Above 60 kilometers)
Artillery Systems Industry Segmentation By Geography
-
1. North America
- 1.1. United States
- 1.2. Canada
-
2. Europe
- 2.1. United Kingdom
- 2.2. Germany
- 2.3. France
- 2.4. Russia
- 2.5. Spain
- 2.6. Rest of Europe
-
3. Asia Pacific
- 3.1. China
- 3.2. India
- 3.3. Japan
- 3.4. South Korea
- 3.5. Australia
- 3.6. Rest of Asia Pacific
-
4. Latin America
- 4.1. Brazil
- 4.2. Mexico
- 4.3. Rest of Latin America
-
5. Middle East and Africa
- 5.1. United Arab Emirates
- 5.2. Saudi Arabia
- 5.3. Israel
- 5.4. South Africa
- 5.5. Rest of Middle East and Africa
Artillery Systems Industry REPORT HIGHLIGHTS
| Aspects | Details |
|---|---|
| Study Period | 2019-2033 |
| Base Year | 2024 |
| Estimated Year | 2025 |
| Forecast Period | 2025-2033 |
| Historical Period | 2019-2024 |
| Growth Rate | CAGR of 7.24% from 2019-2033 |
| Segmentation |
|
Table of Contents
- 1. Introduction
- 1.1. Research Scope
- 1.2. Market Segmentation
- 1.3. Research Methodology
- 1.4. Definitions and Assumptions
- 2. Executive Summary
- 2.1. Introduction
- 3. Market Dynamics
- 3.1. Introduction
- 3.2. Market Drivers
- 3.3. Market Restrains
- 3.4. Market Trends
- 3.4.1. Increasing Defense Expenditure Supporting the Growth of the Artillery Systems Market
- 4. Market Factor Analysis
- 4.1. Porters Five Forces
- 4.2. Supply/Value Chain
- 4.3. PESTEL analysis
- 4.4. Market Entropy
- 4.5. Patent/Trademark Analysis
- 5. Global Artillery Systems Industry Analysis, Insights and Forecast, 2019-2031
- 5.1. Market Analysis, Insights and Forecast - by Type
- 5.1.1. Howitzer
- 5.1.2. Mortar
- 5.1.3. Anti-air Artillery
- 5.1.4. Rocket Artillery
- 5.1.5. Other Types (Naval and Coastal Artillery)
- 5.2. Market Analysis, Insights and Forecast - by Range
- 5.2.1. Short Range (5-30 kilometers)
- 5.2.2. Medium Range (31-60 kilometers)
- 5.2.3. Long Range (Above 60 kilometers)
- 5.3. Market Analysis, Insights and Forecast - by Region
- 5.3.1. North America
- 5.3.2. Europe
- 5.3.3. Asia Pacific
- 5.3.4. Latin America
- 5.3.5. Middle East and Africa
- 5.1. Market Analysis, Insights and Forecast - by Type
- 6. North America Artillery Systems Industry Analysis, Insights and Forecast, 2019-2031
- 6.1. Market Analysis, Insights and Forecast - by Type
- 6.1.1. Howitzer
- 6.1.2. Mortar
- 6.1.3. Anti-air Artillery
- 6.1.4. Rocket Artillery
- 6.1.5. Other Types (Naval and Coastal Artillery)
- 6.2. Market Analysis, Insights and Forecast - by Range
- 6.2.1. Short Range (5-30 kilometers)
- 6.2.2. Medium Range (31-60 kilometers)
- 6.2.3. Long Range (Above 60 kilometers)
- 6.1. Market Analysis, Insights and Forecast - by Type
- 7. Europe Artillery Systems Industry Analysis, Insights and Forecast, 2019-2031
- 7.1. Market Analysis, Insights and Forecast - by Type
- 7.1.1. Howitzer
- 7.1.2. Mortar
- 7.1.3. Anti-air Artillery
- 7.1.4. Rocket Artillery
- 7.1.5. Other Types (Naval and Coastal Artillery)
- 7.2. Market Analysis, Insights and Forecast - by Range
- 7.2.1. Short Range (5-30 kilometers)
- 7.2.2. Medium Range (31-60 kilometers)
- 7.2.3. Long Range (Above 60 kilometers)
- 7.1. Market Analysis, Insights and Forecast - by Type
- 8. Asia Pacific Artillery Systems Industry Analysis, Insights and Forecast, 2019-2031
- 8.1. Market Analysis, Insights and Forecast - by Type
- 8.1.1. Howitzer
- 8.1.2. Mortar
- 8.1.3. Anti-air Artillery
- 8.1.4. Rocket Artillery
- 8.1.5. Other Types (Naval and Coastal Artillery)
- 8.2. Market Analysis, Insights and Forecast - by Range
- 8.2.1. Short Range (5-30 kilometers)
- 8.2.2. Medium Range (31-60 kilometers)
- 8.2.3. Long Range (Above 60 kilometers)
- 8.1. Market Analysis, Insights and Forecast - by Type
- 9. Latin America Artillery Systems Industry Analysis, Insights and Forecast, 2019-2031
- 9.1. Market Analysis, Insights and Forecast - by Type
- 9.1.1. Howitzer
- 9.1.2. Mortar
- 9.1.3. Anti-air Artillery
- 9.1.4. Rocket Artillery
- 9.1.5. Other Types (Naval and Coastal Artillery)
- 9.2. Market Analysis, Insights and Forecast - by Range
- 9.2.1. Short Range (5-30 kilometers)
- 9.2.2. Medium Range (31-60 kilometers)
- 9.2.3. Long Range (Above 60 kilometers)
- 9.1. Market Analysis, Insights and Forecast - by Type
- 10. Middle East and Africa Artillery Systems Industry Analysis, Insights and Forecast, 2019-2031
- 10.1. Market Analysis, Insights and Forecast - by Type
- 10.1.1. Howitzer
- 10.1.2. Mortar
- 10.1.3. Anti-air Artillery
- 10.1.4. Rocket Artillery
- 10.1.5. Other Types (Naval and Coastal Artillery)
- 10.2. Market Analysis, Insights and Forecast - by Range
- 10.2.1. Short Range (5-30 kilometers)
- 10.2.2. Medium Range (31-60 kilometers)
- 10.2.3. Long Range (Above 60 kilometers)
- 10.1. Market Analysis, Insights and Forecast - by Type
- 11. North America Artillery Systems Industry Analysis, Insights and Forecast, 2019-2031
- 11.1. Market Analysis, Insights and Forecast - By Country/Sub-region
- 11.1.1 United States
- 11.1.2 Canada
- 12. Europe Artillery Systems Industry Analysis, Insights and Forecast, 2019-2031
- 12.1. Market Analysis, Insights and Forecast - By Country/Sub-region
- 12.1.1 United Kingdom
- 12.1.2 Germany
- 12.1.3 France
- 12.1.4 Russia
- 12.1.5 Spain
- 12.1.6 Rest of Europe
- 13. Asia Pacific Artillery Systems Industry Analysis, Insights and Forecast, 2019-2031
- 13.1. Market Analysis, Insights and Forecast - By Country/Sub-region
- 13.1.1 China
- 13.1.2 India
- 13.1.3 Japan
- 13.1.4 South Korea
- 13.1.5 Australia
- 13.1.6 Rest of Asia Pacific
- 14. Latin America Artillery Systems Industry Analysis, Insights and Forecast, 2019-2031
- 14.1. Market Analysis, Insights and Forecast - By Country/Sub-region
- 14.1.1 Brazil
- 14.1.2 Mexico
- 14.1.3 Rest of Latin America
- 15. Middle East and Africa Artillery Systems Industry Analysis, Insights and Forecast, 2019-2031
- 15.1. Market Analysis, Insights and Forecast - By Country/Sub-region
- 15.1.1 United Arab Emirates
- 15.1.2 Saudi Arabia
- 15.1.3 Israel
- 15.1.4 South Africa
- 15.1.5 Rest of Middle East and Africa
- 16. Competitive Analysis
- 16.1. Global Market Share Analysis 2024
- 16.2. Company Profiles
- 16.2.1 THALES
- 16.2.1.1. Overview
- 16.2.1.2. Products
- 16.2.1.3. SWOT Analysis
- 16.2.1.4. Recent Developments
- 16.2.1.5. Financials (Based on Availability)
- 16.2.2 Lockheed Martin Corporation
- 16.2.2.1. Overview
- 16.2.2.2. Products
- 16.2.2.3. SWOT Analysis
- 16.2.2.4. Recent Developments
- 16.2.2.5. Financials (Based on Availability)
- 16.2.3 Elbit Systems Ltd
- 16.2.3.1. Overview
- 16.2.3.2. Products
- 16.2.3.3. SWOT Analysis
- 16.2.3.4. Recent Developments
- 16.2.3.5. Financials (Based on Availability)
- 16.2.4 Rostec
- 16.2.4.1. Overview
- 16.2.4.2. Products
- 16.2.4.3. SWOT Analysis
- 16.2.4.4. Recent Developments
- 16.2.4.5. Financials (Based on Availability)
- 16.2.5 RUAG Group
- 16.2.5.1. Overview
- 16.2.5.2. Products
- 16.2.5.3. SWOT Analysis
- 16.2.5.4. Recent Developments
- 16.2.5.5. Financials (Based on Availability)
- 16.2.6 Denel SOC Ltd
- 16.2.6.1. Overview
- 16.2.6.2. Products
- 16.2.6.3. SWOT Analysis
- 16.2.6.4. Recent Developments
- 16.2.6.5. Financials (Based on Availability)
- 16.2.7 Nexter Group
- 16.2.7.1. Overview
- 16.2.7.2. Products
- 16.2.7.3. SWOT Analysis
- 16.2.7.4. Recent Developments
- 16.2.7.5. Financials (Based on Availability)
- 16.2.8 Leonardo S p A
- 16.2.8.1. Overview
- 16.2.8.2. Products
- 16.2.8.3. SWOT Analysis
- 16.2.8.4. Recent Developments
- 16.2.8.5. Financials (Based on Availability)
- 16.2.9 Norinco International Cooperation Ltd
- 16.2.9.1. Overview
- 16.2.9.2. Products
- 16.2.9.3. SWOT Analysis
- 16.2.9.4. Recent Developments
- 16.2.9.5. Financials (Based on Availability)
- 16.2.10 Hanwha Group
- 16.2.10.1. Overview
- 16.2.10.2. Products
- 16.2.10.3. SWOT Analysis
- 16.2.10.4. Recent Developments
- 16.2.10.5. Financials (Based on Availability)
- 16.2.11 Avibras Indústria Aeroespacial SA
- 16.2.11.1. Overview
- 16.2.11.2. Products
- 16.2.11.3. SWOT Analysis
- 16.2.11.4. Recent Developments
- 16.2.11.5. Financials (Based on Availability)
- 16.2.12 Singapore Technologies Engineering Ltd
- 16.2.12.1. Overview
- 16.2.12.2. Products
- 16.2.12.3. SWOT Analysis
- 16.2.12.4. Recent Developments
- 16.2.12.5. Financials (Based on Availability)
- 16.2.13 Rheinmetall A
- 16.2.13.1. Overview
- 16.2.13.2. Products
- 16.2.13.3. SWOT Analysis
- 16.2.13.4. Recent Developments
- 16.2.13.5. Financials (Based on Availability)
- 16.2.14 BAE Systems plc
- 16.2.14.1. Overview
- 16.2.14.2. Products
- 16.2.14.3. SWOT Analysis
- 16.2.14.4. Recent Developments
- 16.2.14.5. Financials (Based on Availability)
- 16.2.1 THALES
List of Figures
- Figure 1: Global Artillery Systems Industry Revenue Breakdown (Million, %) by Region 2024 & 2032
- Figure 2: North America Artillery Systems Industry Revenue (Million), by Country 2024 & 2032
- Figure 3: North America Artillery Systems Industry Revenue Share (%), by Country 2024 & 2032
- Figure 4: Europe Artillery Systems Industry Revenue (Million), by Country 2024 & 2032
- Figure 5: Europe Artillery Systems Industry Revenue Share (%), by Country 2024 & 2032
- Figure 6: Asia Pacific Artillery Systems Industry Revenue (Million), by Country 2024 & 2032
- Figure 7: Asia Pacific Artillery Systems Industry Revenue Share (%), by Country 2024 & 2032
- Figure 8: Latin America Artillery Systems Industry Revenue (Million), by Country 2024 & 2032
- Figure 9: Latin America Artillery Systems Industry Revenue Share (%), by Country 2024 & 2032
- Figure 10: Middle East and Africa Artillery Systems Industry Revenue (Million), by Country 2024 & 2032
- Figure 11: Middle East and Africa Artillery Systems Industry Revenue Share (%), by Country 2024 & 2032
- Figure 12: North America Artillery Systems Industry Revenue (Million), by Type 2024 & 2032
- Figure 13: North America Artillery Systems Industry Revenue Share (%), by Type 2024 & 2032
- Figure 14: North America Artillery Systems Industry Revenue (Million), by Range 2024 & 2032
- Figure 15: North America Artillery Systems Industry Revenue Share (%), by Range 2024 & 2032
- Figure 16: North America Artillery Systems Industry Revenue (Million), by Country 2024 & 2032
- Figure 17: North America Artillery Systems Industry Revenue Share (%), by Country 2024 & 2032
- Figure 18: Europe Artillery Systems Industry Revenue (Million), by Type 2024 & 2032
- Figure 19: Europe Artillery Systems Industry Revenue Share (%), by Type 2024 & 2032
- Figure 20: Europe Artillery Systems Industry Revenue (Million), by Range 2024 & 2032
- Figure 21: Europe Artillery Systems Industry Revenue Share (%), by Range 2024 & 2032
- Figure 22: Europe Artillery Systems Industry Revenue (Million), by Country 2024 & 2032
- Figure 23: Europe Artillery Systems Industry Revenue Share (%), by Country 2024 & 2032
- Figure 24: Asia Pacific Artillery Systems Industry Revenue (Million), by Type 2024 & 2032
- Figure 25: Asia Pacific Artillery Systems Industry Revenue Share (%), by Type 2024 & 2032
- Figure 26: Asia Pacific Artillery Systems Industry Revenue (Million), by Range 2024 & 2032
- Figure 27: Asia Pacific Artillery Systems Industry Revenue Share (%), by Range 2024 & 2032
- Figure 28: Asia Pacific Artillery Systems Industry Revenue (Million), by Country 2024 & 2032
- Figure 29: Asia Pacific Artillery Systems Industry Revenue Share (%), by Country 2024 & 2032
- Figure 30: Latin America Artillery Systems Industry Revenue (Million), by Type 2024 & 2032
- Figure 31: Latin America Artillery Systems Industry Revenue Share (%), by Type 2024 & 2032
- Figure 32: Latin America Artillery Systems Industry Revenue (Million), by Range 2024 & 2032
- Figure 33: Latin America Artillery Systems Industry Revenue Share (%), by Range 2024 & 2032
- Figure 34: Latin America Artillery Systems Industry Revenue (Million), by Country 2024 & 2032
- Figure 35: Latin America Artillery Systems Industry Revenue Share (%), by Country 2024 & 2032
- Figure 36: Middle East and Africa Artillery Systems Industry Revenue (Million), by Type 2024 & 2032
- Figure 37: Middle East and Africa Artillery Systems Industry Revenue Share (%), by Type 2024 & 2032
- Figure 38: Middle East and Africa Artillery Systems Industry Revenue (Million), by Range 2024 & 2032
- Figure 39: Middle East and Africa Artillery Systems Industry Revenue Share (%), by Range 2024 & 2032
- Figure 40: Middle East and Africa Artillery Systems Industry Revenue (Million), by Country 2024 & 2032
- Figure 41: Middle East and Africa Artillery Systems Industry Revenue Share (%), by Country 2024 & 2032
List of Tables
- Table 1: Global Artillery Systems Industry Revenue Million Forecast, by Region 2019 & 2032
- Table 2: Global Artillery Systems Industry Revenue Million Forecast, by Type 2019 & 2032
- Table 3: Global Artillery Systems Industry Revenue Million Forecast, by Range 2019 & 2032
- Table 4: Global Artillery Systems Industry Revenue Million Forecast, by Region 2019 & 2032
- Table 5: Global Artillery Systems Industry Revenue Million Forecast, by Country 2019 & 2032
- Table 6: United States Artillery Systems Industry Revenue (Million) Forecast, by Application 2019 & 2032
- Table 7: Canada Artillery Systems Industry Revenue (Million) Forecast, by Application 2019 & 2032
- Table 8: Global Artillery Systems Industry Revenue Million Forecast, by Country 2019 & 2032
- Table 9: United Kingdom Artillery Systems Industry Revenue (Million) Forecast, by Application 2019 & 2032
- Table 10: Germany Artillery Systems Industry Revenue (Million) Forecast, by Application 2019 & 2032
- Table 11: France Artillery Systems Industry Revenue (Million) Forecast, by Application 2019 & 2032
- Table 12: Russia Artillery Systems Industry Revenue (Million) Forecast, by Application 2019 & 2032
- Table 13: Spain Artillery Systems Industry Revenue (Million) Forecast, by Application 2019 & 2032
- Table 14: Rest of Europe Artillery Systems Industry Revenue (Million) Forecast, by Application 2019 & 2032
- Table 15: Global Artillery Systems Industry Revenue Million Forecast, by Country 2019 & 2032
- Table 16: China Artillery Systems Industry Revenue (Million) Forecast, by Application 2019 & 2032
- Table 17: India Artillery Systems Industry Revenue (Million) Forecast, by Application 2019 & 2032
- Table 18: Japan Artillery Systems Industry Revenue (Million) Forecast, by Application 2019 & 2032
- Table 19: South Korea Artillery Systems Industry Revenue (Million) Forecast, by Application 2019 & 2032
- Table 20: Australia Artillery Systems Industry Revenue (Million) Forecast, by Application 2019 & 2032
- Table 21: Rest of Asia Pacific Artillery Systems Industry Revenue (Million) Forecast, by Application 2019 & 2032
- Table 22: Global Artillery Systems Industry Revenue Million Forecast, by Country 2019 & 2032
- Table 23: Brazil Artillery Systems Industry Revenue (Million) Forecast, by Application 2019 & 2032
- Table 24: Mexico Artillery Systems Industry Revenue (Million) Forecast, by Application 2019 & 2032
- Table 25: Rest of Latin America Artillery Systems Industry Revenue (Million) Forecast, by Application 2019 & 2032
- Table 26: Global Artillery Systems Industry Revenue Million Forecast, by Country 2019 & 2032
- Table 27: United Arab Emirates Artillery Systems Industry Revenue (Million) Forecast, by Application 2019 & 2032
- Table 28: Saudi Arabia Artillery Systems Industry Revenue (Million) Forecast, by Application 2019 & 2032
- Table 29: Israel Artillery Systems Industry Revenue (Million) Forecast, by Application 2019 & 2032
- Table 30: South Africa Artillery Systems Industry Revenue (Million) Forecast, by Application 2019 & 2032
- Table 31: Rest of Middle East and Africa Artillery Systems Industry Revenue (Million) Forecast, by Application 2019 & 2032
- Table 32: Global Artillery Systems Industry Revenue Million Forecast, by Type 2019 & 2032
- Table 33: Global Artillery Systems Industry Revenue Million Forecast, by Range 2019 & 2032
- Table 34: Global Artillery Systems Industry Revenue Million Forecast, by Country 2019 & 2032
- Table 35: United States Artillery Systems Industry Revenue (Million) Forecast, by Application 2019 & 2032
- Table 36: Canada Artillery Systems Industry Revenue (Million) Forecast, by Application 2019 & 2032
- Table 37: Global Artillery Systems Industry Revenue Million Forecast, by Type 2019 & 2032
- Table 38: Global Artillery Systems Industry Revenue Million Forecast, by Range 2019 & 2032
- Table 39: Global Artillery Systems Industry Revenue Million Forecast, by Country 2019 & 2032
- Table 40: United Kingdom Artillery Systems Industry Revenue (Million) Forecast, by Application 2019 & 2032
- Table 41: Germany Artillery Systems Industry Revenue (Million) Forecast, by Application 2019 & 2032
- Table 42: France Artillery Systems Industry Revenue (Million) Forecast, by Application 2019 & 2032
- Table 43: Russia Artillery Systems Industry Revenue (Million) Forecast, by Application 2019 & 2032
- Table 44: Spain Artillery Systems Industry Revenue (Million) Forecast, by Application 2019 & 2032
- Table 45: Rest of Europe Artillery Systems Industry Revenue (Million) Forecast, by Application 2019 & 2032
- Table 46: Global Artillery Systems Industry Revenue Million Forecast, by Type 2019 & 2032
- Table 47: Global Artillery Systems Industry Revenue Million Forecast, by Range 2019 & 2032
- Table 48: Global Artillery Systems Industry Revenue Million Forecast, by Country 2019 & 2032
- Table 49: China Artillery Systems Industry Revenue (Million) Forecast, by Application 2019 & 2032
- Table 50: India Artillery Systems Industry Revenue (Million) Forecast, by Application 2019 & 2032
- Table 51: Japan Artillery Systems Industry Revenue (Million) Forecast, by Application 2019 & 2032
- Table 52: South Korea Artillery Systems Industry Revenue (Million) Forecast, by Application 2019 & 2032
- Table 53: Australia Artillery Systems Industry Revenue (Million) Forecast, by Application 2019 & 2032
- Table 54: Rest of Asia Pacific Artillery Systems Industry Revenue (Million) Forecast, by Application 2019 & 2032
- Table 55: Global Artillery Systems Industry Revenue Million Forecast, by Type 2019 & 2032
- Table 56: Global Artillery Systems Industry Revenue Million Forecast, by Range 2019 & 2032
- Table 57: Global Artillery Systems Industry Revenue Million Forecast, by Country 2019 & 2032
- Table 58: Brazil Artillery Systems Industry Revenue (Million) Forecast, by Application 2019 & 2032
- Table 59: Mexico Artillery Systems Industry Revenue (Million) Forecast, by Application 2019 & 2032
- Table 60: Rest of Latin America Artillery Systems Industry Revenue (Million) Forecast, by Application 2019 & 2032
- Table 61: Global Artillery Systems Industry Revenue Million Forecast, by Type 2019 & 2032
- Table 62: Global Artillery Systems Industry Revenue Million Forecast, by Range 2019 & 2032
- Table 63: Global Artillery Systems Industry Revenue Million Forecast, by Country 2019 & 2032
- Table 64: United Arab Emirates Artillery Systems Industry Revenue (Million) Forecast, by Application 2019 & 2032
- Table 65: Saudi Arabia Artillery Systems Industry Revenue (Million) Forecast, by Application 2019 & 2032
- Table 66: Israel Artillery Systems Industry Revenue (Million) Forecast, by Application 2019 & 2032
- Table 67: South Africa Artillery Systems Industry Revenue (Million) Forecast, by Application 2019 & 2032
- Table 68: Rest of Middle East and Africa Artillery Systems Industry Revenue (Million) Forecast, by Application 2019 & 2032
Frequently Asked Questions
1. What is the projected Compound Annual Growth Rate (CAGR) of the Artillery Systems Industry?
The projected CAGR is approximately 7.24%.
2. Which companies are prominent players in the Artillery Systems Industry?
Key companies in the market include THALES, Lockheed Martin Corporation, Elbit Systems Ltd, Rostec, RUAG Group, Denel SOC Ltd, Nexter Group, Leonardo S p A, Norinco International Cooperation Ltd, Hanwha Group, Avibras Indústria Aeroespacial SA, Singapore Technologies Engineering Ltd, Rheinmetall A, BAE Systems plc.
3. What are the main segments of the Artillery Systems Industry?
The market segments include Type, Range.
4. Can you provide details about the market size?
The market size is estimated to be USD 8.84 Million as of 2022.
5. What are some drivers contributing to market growth?
N/A
6. What are the notable trends driving market growth?
Increasing Defense Expenditure Supporting the Growth of the Artillery Systems Market.
7. Are there any restraints impacting market growth?
N/A
8. Can you provide examples of recent developments in the market?
July 2023: Elbit Systems Ltd. announced it was awarded a USD 150 million contract to supply PULS™ (Precise and Universal Launching Systems) rocket launchers and a package of precision-guided long-range rockets.
9. What pricing options are available for accessing the report?
Pricing options include single-user, multi-user, and enterprise licenses priced at USD 4750, USD 5250, and USD 8750 respectively.
10. Is the market size provided in terms of value or volume?
The market size is provided in terms of value, measured in Million.
11. Are there any specific market keywords associated with the report?
Yes, the market keyword associated with the report is "Artillery Systems Industry," which aids in identifying and referencing the specific market segment covered.
12. How do I determine which pricing option suits my needs best?
The pricing options vary based on user requirements and access needs. Individual users may opt for single-user licenses, while businesses requiring broader access may choose multi-user or enterprise licenses for cost-effective access to the report.
13. Are there any additional resources or data provided in the Artillery Systems Industry report?
While the report offers comprehensive insights, it's advisable to review the specific contents or supplementary materials provided to ascertain if additional resources or data are available.
14. How can I stay updated on further developments or reports in the Artillery Systems Industry?
To stay informed about further developments, trends, and reports in the Artillery Systems Industry, consider subscribing to industry newsletters, following relevant companies and organizations, or regularly checking reputable industry news sources and publications.
Methodology
Step 1 - Identification of Relevant Samples Size from Population Database


Step 2 - Approaches for Defining Global Market Size (Value, Volume* & Price*)

Note*: In applicable scenarios
Step 3 - Data Sources
Primary Research
- Web Analytics
- Survey Reports
- Research Institute
- Latest Research Reports
- Opinion Leaders
Secondary Research
- Annual Reports
- White Paper
- Latest Press Release
- Industry Association
- Paid Database
- Investor Presentations

Step 4 - Data Triangulation
Involves using different sources of information in order to increase the validity of a study
These sources are likely to be stakeholders in a program - participants, other researchers, program staff, other community members, and so on.
Then we put all data in single framework & apply various statistical tools to find out the dynamic on the market.
During the analysis stage, feedback from the stakeholder groups would be compared to determine areas of agreement as well as areas of divergence


