
Key Insights
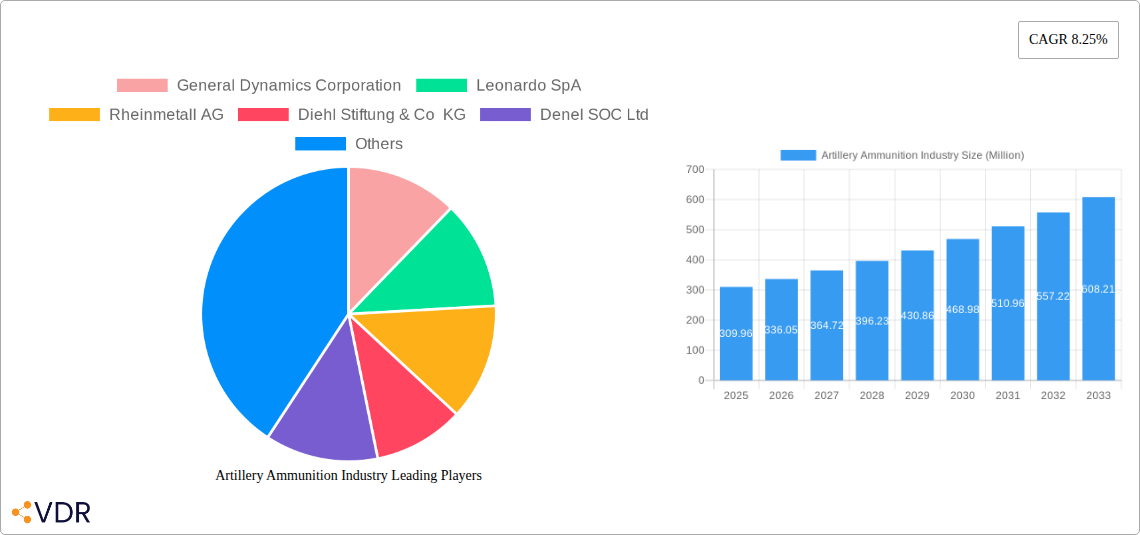
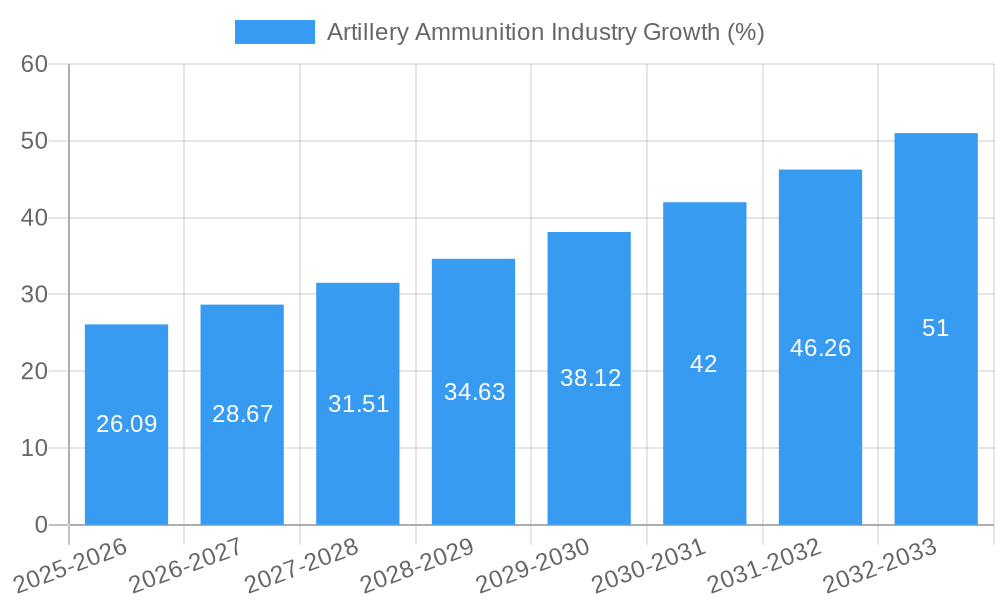
The global artillery ammunition market, valued at $309.96 million in 2025, is projected to experience robust growth, driven by escalating geopolitical tensions, modernization of armed forces globally, and increasing demand for precision-guided munitions. A compound annual growth rate (CAGR) of 8.25% from 2025 to 2033 indicates a significant expansion of this market. Key drivers include the ongoing conflicts and regional instabilities necessitating substantial ammunition replenishment and upgrades. Furthermore, technological advancements in artillery ammunition, including increased accuracy, range, and lethality through guided munitions and smart fuzes, are fueling market expansion. The market segmentation reveals a significant portion allocated to above 60mm caliber ammunition, reflecting a preference for larger-caliber weapons systems offering greater destructive power. The end-user segment is dominated by naval and ground forces, with substantial demand from various branches including air forces, armies, and special forces across numerous nations. This strong demand is underpinned by ongoing military expenditure increases worldwide, particularly in regions experiencing heightened security concerns.
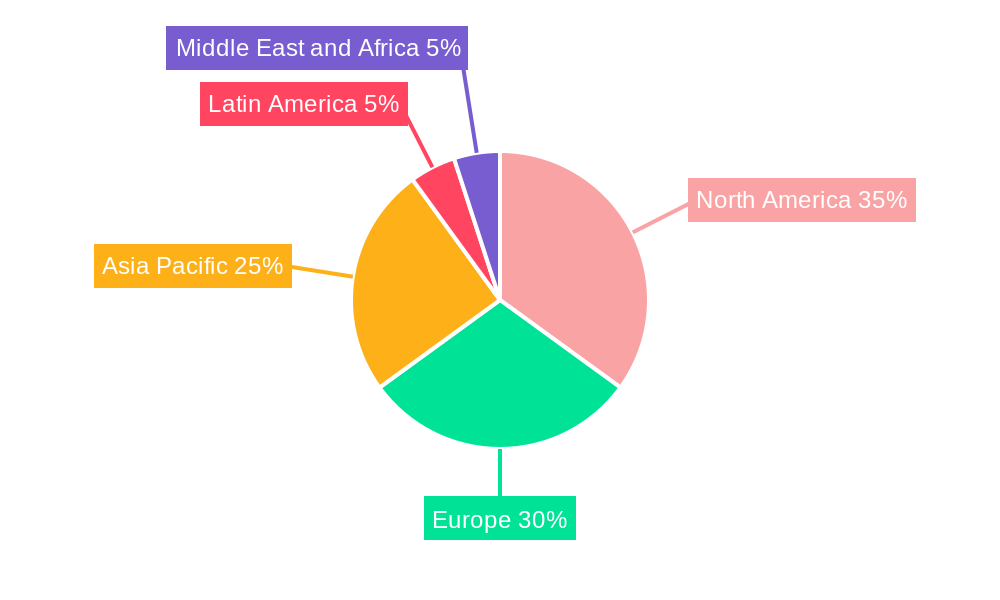
The market's growth trajectory is, however, subject to certain restraints. These include fluctuating global defense budgets, particularly in economically unstable regions, and the potential for advancements in alternative defense technologies that could reduce the reliance on traditional artillery ammunition. Competition within the market is intense, with numerous established players and emerging companies vying for market share. North America and Europe currently hold significant market shares, reflecting established defense industries and substantial military spending within these regions. However, Asia-Pacific is expected to exhibit the fastest growth due to increasing military modernization efforts and rising geopolitical tensions in the region. The forecast period (2025-2033) will be characterized by a continuous push for improved ammunition technologies, increased automation in production, and a focus on enhancing logistics and supply chain efficiency to meet the evolving demands of modern warfare.
Artillery Ammunition Industry Market Report: 2019-2033
This comprehensive report provides a detailed analysis of the global artillery ammunition market, encompassing market dynamics, growth trends, regional segmentation, product landscape, and key players. The study period covers 2019-2033, with 2025 as the base and estimated year. This report is crucial for industry professionals, investors, and researchers seeking to understand the complexities and future potential of this vital sector. The parent market is the broader defense and aerospace industry, while the child market is specifically artillery systems and munitions.
Artillery Ammunition Industry Market Dynamics & Structure
The artillery ammunition market is characterized by moderate concentration, with a few major players holding significant market share. Technological innovation, driven by the need for enhanced precision, range, and lethality, is a key market driver. Stringent regulatory frameworks governing the production, storage, and use of ammunition also significantly influence market dynamics. Competitive pressure from substitute technologies is relatively low, due to the specialized nature of artillery ammunition. End-user demographics are largely driven by global geopolitical instability and defense spending priorities. Mergers and acquisitions (M&A) activity within the sector reflects consolidation efforts and strategic expansion.
- Market Concentration: Oligopolistic, with top 5 players holding approximately xx% market share (2024).
- Technological Innovation: Focus on smart munitions, guided projectiles, and improved propellants.
- Regulatory Framework: Strict international and national regulations on arms trade and ammunition handling.
- Competitive Substitutes: Limited substitutes, primarily alternative weapon systems.
- End-User Demographics: Primarily government defense forces (Army, Navy, Air Force) and allied security agencies.
- M&A Trends: xx major M&A deals recorded between 2019 and 2024, valued at approximately xx million USD.
Artillery Ammunition Industry Growth Trends & Insights
The global artillery ammunition market experienced steady growth during the historical period (2019-2024), primarily fueled by increasing defense budgets worldwide and regional conflicts. The market is expected to witness continued expansion during the forecast period (2025-2033), driven by modernization efforts among armed forces and technological advancements. Adoption rates are influenced by factors like defense spending, technological maturity, and geopolitical dynamics. Technological disruptions, such as the development of precision-guided munitions, are transforming the market landscape. Consumer behavior, in this context, refers to the procurement patterns of governmental defense agencies, heavily influenced by budget allocation and strategic needs.
- Market Size (2024): xx million units
- CAGR (2019-2024): xx%
- Market Penetration (2024): xx% in major markets
- Projected Market Size (2033): xx million units
Dominant Regions, Countries, or Segments in Artillery Ammunition Industry
The North American and European markets currently dominate the global artillery ammunition industry, driven by strong defense budgets and established indigenous manufacturing capabilities. However, the Asia-Pacific region is projected to exhibit the highest growth rate during the forecast period, fueled by increasing military spending and modernization initiatives. Within caliber types, the "Above 60 mm" segment holds a larger market share due to its widespread use in conventional artillery systems. Ground forces, particularly armies and special forces, constitute the largest end-user segment.
- Leading Region (2024): North America
- Fastest Growing Region (2025-2033): Asia-Pacific
- Largest Caliber Segment: Above 60 mm
- Largest End-User Segment: Ground Forces (Army)
- Key Drivers (Asia-Pacific): Rising defense expenditure, regional geopolitical tensions, modernization of armed forces.
Artillery Ammunition Industry Product Landscape
The artillery ammunition market offers a diverse range of products, categorized by caliber, type (e.g., high-explosive, smoke, illumination), and guidance systems. Innovations focus on enhancing accuracy, range, and lethality, while incorporating smart technologies for improved targeting and effectiveness. Unique selling propositions include increased precision, reduced collateral damage, and enhanced survivability. Technological advancements include the integration of GPS guidance, advanced fuzes, and improved propellants.
Key Drivers, Barriers & Challenges in Artillery Ammunition Industry
Key Drivers: Increasing global defense spending, modernization of artillery systems, technological advancements in precision-guided munitions, and geopolitical instability.
Key Challenges: Stringent regulatory compliance, supply chain disruptions, geopolitical risks impacting production and trade, and intense competition among established players. The impact of supply chain disruptions is estimated to have reduced market growth by approximately xx% in 2022.
Emerging Opportunities in Artillery Ammunition Industry
Emerging opportunities include the development of smart munitions with advanced guidance and targeting systems, expansion into untapped markets in developing economies, and the growing demand for precision-guided artillery ammunition for counter-insurgency operations. The increasing use of unmanned aerial vehicles (UAVs) for artillery spotting also presents a significant opportunity.
Growth Accelerators in the Artillery Ammunition Industry
Technological breakthroughs in precision-guided munitions and advanced propellants are accelerating market growth. Strategic partnerships between defense contractors and government agencies enhance production capabilities and R&D efforts. Market expansion strategies, including diversification into new geographies and product lines, are contributing to long-term growth.
Key Players Shaping the Artillery Ammunition Industry Market
- General Dynamics Corporation
- Leonardo SpA
- Rheinmetall AG
- Diehl Stiftung & Co KG
- Denel SOC Ltd
- BAE Systems PLC
- Northrop Grumman
- Raytheon Technologies Corporation
- Global Ordnance
- Nammo AS
- Ukroboronprom
- Saab AB
- ST Engineering
- Nexter group KNDS
Notable Milestones in Artillery Ammunition Industry Sector
- April 2022: Senegal signs contract with Nexter for 105 mm ammunition.
- March 2022: Hungary contracts with Rheinmetall for extensive ammunition supply.
In-Depth Artillery Ammunition Industry Market Outlook
The future of the artillery ammunition market is bright, driven by ongoing technological advancements, increasing defense budgets globally, and persistent geopolitical uncertainties. Strategic partnerships and collaborations will be key for companies to maintain competitiveness. The market presents significant opportunities for companies that can innovate, adapt, and provide cutting-edge solutions to meet the evolving needs of armed forces worldwide. The increasing adoption of precision-guided munitions and the exploration of new propellants will shape the market in the coming decade.
Artillery Ammunition Industry Segmentation
-
1. Caliber Type
- 1.1. 40-60 mm
- 1.2. Above 60 mm
-
2. End User
- 2.1. Naval Forces
- 2.2. Ground F
Artillery Ammunition Industry Segmentation By Geography
-
1. North America
- 1.1. United States
- 1.2. Canada
-
2. Europe
- 2.1. United Kingdom
- 2.2. Germany
- 2.3. France
- 2.4. Russia
- 2.5. Rest of Europe
-
3. Asia Pacific
- 3.1. China
- 3.2. India
- 3.3. Japan
- 3.4. South Korea
- 3.5. Rest of Asia Pacific
-
4. Latin America
- 4.1. Brazil
- 4.2. Rest of Latin America
-
5. Middle East and Africa
- 5.1. United Arab Emirates
- 5.2. Saudi Arabia
- 5.3. Israel
- 5.4. South Africa
- 5.5. Rest of Middle East and Africa
Artillery Ammunition Industry REPORT HIGHLIGHTS
| Aspects | Details |
|---|---|
| Study Period | 2019-2033 |
| Base Year | 2024 |
| Estimated Year | 2025 |
| Forecast Period | 2025-2033 |
| Historical Period | 2019-2024 |
| Growth Rate | CAGR of 8.25% from 2019-2033 |
| Segmentation |
|
Table of Contents
- 1. Introduction
- 1.1. Research Scope
- 1.2. Market Segmentation
- 1.3. Research Methodology
- 1.4. Definitions and Assumptions
- 2. Executive Summary
- 2.1. Introduction
- 3. Market Dynamics
- 3.1. Introduction
- 3.2. Market Drivers
- 3.3. Market Restrains
- 3.4. Market Trends
- 3.4.1. Ground Forces Segment is Projected to Grow with Highest CAGR During the Forecast Period
- 4. Market Factor Analysis
- 4.1. Porters Five Forces
- 4.2. Supply/Value Chain
- 4.3. PESTEL analysis
- 4.4. Market Entropy
- 4.5. Patent/Trademark Analysis
- 5. Global Artillery Ammunition Industry Analysis, Insights and Forecast, 2019-2031
- 5.1. Market Analysis, Insights and Forecast - by Caliber Type
- 5.1.1. 40-60 mm
- 5.1.2. Above 60 mm
- 5.2. Market Analysis, Insights and Forecast - by End User
- 5.2.1. Naval Forces
- 5.2.2. Ground F
- 5.3. Market Analysis, Insights and Forecast - by Region
- 5.3.1. North America
- 5.3.2. Europe
- 5.3.3. Asia Pacific
- 5.3.4. Latin America
- 5.3.5. Middle East and Africa
- 5.1. Market Analysis, Insights and Forecast - by Caliber Type
- 6. North America Artillery Ammunition Industry Analysis, Insights and Forecast, 2019-2031
- 6.1. Market Analysis, Insights and Forecast - by Caliber Type
- 6.1.1. 40-60 mm
- 6.1.2. Above 60 mm
- 6.2. Market Analysis, Insights and Forecast - by End User
- 6.2.1. Naval Forces
- 6.2.2. Ground F
- 6.1. Market Analysis, Insights and Forecast - by Caliber Type
- 7. Europe Artillery Ammunition Industry Analysis, Insights and Forecast, 2019-2031
- 7.1. Market Analysis, Insights and Forecast - by Caliber Type
- 7.1.1. 40-60 mm
- 7.1.2. Above 60 mm
- 7.2. Market Analysis, Insights and Forecast - by End User
- 7.2.1. Naval Forces
- 7.2.2. Ground F
- 7.1. Market Analysis, Insights and Forecast - by Caliber Type
- 8. Asia Pacific Artillery Ammunition Industry Analysis, Insights and Forecast, 2019-2031
- 8.1. Market Analysis, Insights and Forecast - by Caliber Type
- 8.1.1. 40-60 mm
- 8.1.2. Above 60 mm
- 8.2. Market Analysis, Insights and Forecast - by End User
- 8.2.1. Naval Forces
- 8.2.2. Ground F
- 8.1. Market Analysis, Insights and Forecast - by Caliber Type
- 9. Latin America Artillery Ammunition Industry Analysis, Insights and Forecast, 2019-2031
- 9.1. Market Analysis, Insights and Forecast - by Caliber Type
- 9.1.1. 40-60 mm
- 9.1.2. Above 60 mm
- 9.2. Market Analysis, Insights and Forecast - by End User
- 9.2.1. Naval Forces
- 9.2.2. Ground F
- 9.1. Market Analysis, Insights and Forecast - by Caliber Type
- 10. Middle East and Africa Artillery Ammunition Industry Analysis, Insights and Forecast, 2019-2031
- 10.1. Market Analysis, Insights and Forecast - by Caliber Type
- 10.1.1. 40-60 mm
- 10.1.2. Above 60 mm
- 10.2. Market Analysis, Insights and Forecast - by End User
- 10.2.1. Naval Forces
- 10.2.2. Ground F
- 10.1. Market Analysis, Insights and Forecast - by Caliber Type
- 11. North America Artillery Ammunition Industry Analysis, Insights and Forecast, 2019-2031
- 11.1. Market Analysis, Insights and Forecast - By Country/Sub-region
- 11.1.1 United States
- 11.1.2 Canada
- 12. Europe Artillery Ammunition Industry Analysis, Insights and Forecast, 2019-2031
- 12.1. Market Analysis, Insights and Forecast - By Country/Sub-region
- 12.1.1 United Kingdom
- 12.1.2 Germany
- 12.1.3 France
- 12.1.4 Russia
- 12.1.5 Rest of Europe
- 13. Asia Pacific Artillery Ammunition Industry Analysis, Insights and Forecast, 2019-2031
- 13.1. Market Analysis, Insights and Forecast - By Country/Sub-region
- 13.1.1 China
- 13.1.2 India
- 13.1.3 Japan
- 13.1.4 South Korea
- 13.1.5 Rest of Asia Pacific
- 14. Latin America Artillery Ammunition Industry Analysis, Insights and Forecast, 2019-2031
- 14.1. Market Analysis, Insights and Forecast - By Country/Sub-region
- 14.1.1 Brazil
- 14.1.2 Rest of Latin America
- 15. Middle East and Africa Artillery Ammunition Industry Analysis, Insights and Forecast, 2019-2031
- 15.1. Market Analysis, Insights and Forecast - By Country/Sub-region
- 15.1.1 United Arab Emirates
- 15.1.2 Saudi Arabia
- 15.1.3 Israel
- 15.1.4 South Africa
- 15.1.5 Rest of Middle East and Africa
- 16. Competitive Analysis
- 16.1. Global Market Share Analysis 2024
- 16.2. Company Profiles
- 16.2.1 General Dynamics Corporation
- 16.2.1.1. Overview
- 16.2.1.2. Products
- 16.2.1.3. SWOT Analysis
- 16.2.1.4. Recent Developments
- 16.2.1.5. Financials (Based on Availability)
- 16.2.2 Leonardo SpA
- 16.2.2.1. Overview
- 16.2.2.2. Products
- 16.2.2.3. SWOT Analysis
- 16.2.2.4. Recent Developments
- 16.2.2.5. Financials (Based on Availability)
- 16.2.3 Rheinmetall AG
- 16.2.3.1. Overview
- 16.2.3.2. Products
- 16.2.3.3. SWOT Analysis
- 16.2.3.4. Recent Developments
- 16.2.3.5. Financials (Based on Availability)
- 16.2.4 Diehl Stiftung & Co KG
- 16.2.4.1. Overview
- 16.2.4.2. Products
- 16.2.4.3. SWOT Analysis
- 16.2.4.4. Recent Developments
- 16.2.4.5. Financials (Based on Availability)
- 16.2.5 Denel SOC Ltd
- 16.2.5.1. Overview
- 16.2.5.2. Products
- 16.2.5.3. SWOT Analysis
- 16.2.5.4. Recent Developments
- 16.2.5.5. Financials (Based on Availability)
- 16.2.6 BAE Systems PLC
- 16.2.6.1. Overview
- 16.2.6.2. Products
- 16.2.6.3. SWOT Analysis
- 16.2.6.4. Recent Developments
- 16.2.6.5. Financials (Based on Availability)
- 16.2.7 Northrop Grumman
- 16.2.7.1. Overview
- 16.2.7.2. Products
- 16.2.7.3. SWOT Analysis
- 16.2.7.4. Recent Developments
- 16.2.7.5. Financials (Based on Availability)
- 16.2.8 Raytheon Technologies Corporation*List Not Exhaustive
- 16.2.8.1. Overview
- 16.2.8.2. Products
- 16.2.8.3. SWOT Analysis
- 16.2.8.4. Recent Developments
- 16.2.8.5. Financials (Based on Availability)
- 16.2.9 Global Ordnance
- 16.2.9.1. Overview
- 16.2.9.2. Products
- 16.2.9.3. SWOT Analysis
- 16.2.9.4. Recent Developments
- 16.2.9.5. Financials (Based on Availability)
- 16.2.10 Nammo AS
- 16.2.10.1. Overview
- 16.2.10.2. Products
- 16.2.10.3. SWOT Analysis
- 16.2.10.4. Recent Developments
- 16.2.10.5. Financials (Based on Availability)
- 16.2.11 Ukroboronprom
- 16.2.11.1. Overview
- 16.2.11.2. Products
- 16.2.11.3. SWOT Analysis
- 16.2.11.4. Recent Developments
- 16.2.11.5. Financials (Based on Availability)
- 16.2.12 Saab AB
- 16.2.12.1. Overview
- 16.2.12.2. Products
- 16.2.12.3. SWOT Analysis
- 16.2.12.4. Recent Developments
- 16.2.12.5. Financials (Based on Availability)
- 16.2.13 ST Engineering
- 16.2.13.1. Overview
- 16.2.13.2. Products
- 16.2.13.3. SWOT Analysis
- 16.2.13.4. Recent Developments
- 16.2.13.5. Financials (Based on Availability)
- 16.2.14 Nexter group KNDS
- 16.2.14.1. Overview
- 16.2.14.2. Products
- 16.2.14.3. SWOT Analysis
- 16.2.14.4. Recent Developments
- 16.2.14.5. Financials (Based on Availability)
- 16.2.1 General Dynamics Corporation
List of Figures
- Figure 1: Global Artillery Ammunition Industry Revenue Breakdown (Million, %) by Region 2024 & 2032
- Figure 2: North America Artillery Ammunition Industry Revenue (Million), by Country 2024 & 2032
- Figure 3: North America Artillery Ammunition Industry Revenue Share (%), by Country 2024 & 2032
- Figure 4: Europe Artillery Ammunition Industry Revenue (Million), by Country 2024 & 2032
- Figure 5: Europe Artillery Ammunition Industry Revenue Share (%), by Country 2024 & 2032
- Figure 6: Asia Pacific Artillery Ammunition Industry Revenue (Million), by Country 2024 & 2032
- Figure 7: Asia Pacific Artillery Ammunition Industry Revenue Share (%), by Country 2024 & 2032
- Figure 8: Latin America Artillery Ammunition Industry Revenue (Million), by Country 2024 & 2032
- Figure 9: Latin America Artillery Ammunition Industry Revenue Share (%), by Country 2024 & 2032
- Figure 10: Middle East and Africa Artillery Ammunition Industry Revenue (Million), by Country 2024 & 2032
- Figure 11: Middle East and Africa Artillery Ammunition Industry Revenue Share (%), by Country 2024 & 2032
- Figure 12: North America Artillery Ammunition Industry Revenue (Million), by Caliber Type 2024 & 2032
- Figure 13: North America Artillery Ammunition Industry Revenue Share (%), by Caliber Type 2024 & 2032
- Figure 14: North America Artillery Ammunition Industry Revenue (Million), by End User 2024 & 2032
- Figure 15: North America Artillery Ammunition Industry Revenue Share (%), by End User 2024 & 2032
- Figure 16: North America Artillery Ammunition Industry Revenue (Million), by Country 2024 & 2032
- Figure 17: North America Artillery Ammunition Industry Revenue Share (%), by Country 2024 & 2032
- Figure 18: Europe Artillery Ammunition Industry Revenue (Million), by Caliber Type 2024 & 2032
- Figure 19: Europe Artillery Ammunition Industry Revenue Share (%), by Caliber Type 2024 & 2032
- Figure 20: Europe Artillery Ammunition Industry Revenue (Million), by End User 2024 & 2032
- Figure 21: Europe Artillery Ammunition Industry Revenue Share (%), by End User 2024 & 2032
- Figure 22: Europe Artillery Ammunition Industry Revenue (Million), by Country 2024 & 2032
- Figure 23: Europe Artillery Ammunition Industry Revenue Share (%), by Country 2024 & 2032
- Figure 24: Asia Pacific Artillery Ammunition Industry Revenue (Million), by Caliber Type 2024 & 2032
- Figure 25: Asia Pacific Artillery Ammunition Industry Revenue Share (%), by Caliber Type 2024 & 2032
- Figure 26: Asia Pacific Artillery Ammunition Industry Revenue (Million), by End User 2024 & 2032
- Figure 27: Asia Pacific Artillery Ammunition Industry Revenue Share (%), by End User 2024 & 2032
- Figure 28: Asia Pacific Artillery Ammunition Industry Revenue (Million), by Country 2024 & 2032
- Figure 29: Asia Pacific Artillery Ammunition Industry Revenue Share (%), by Country 2024 & 2032
- Figure 30: Latin America Artillery Ammunition Industry Revenue (Million), by Caliber Type 2024 & 2032
- Figure 31: Latin America Artillery Ammunition Industry Revenue Share (%), by Caliber Type 2024 & 2032
- Figure 32: Latin America Artillery Ammunition Industry Revenue (Million), by End User 2024 & 2032
- Figure 33: Latin America Artillery Ammunition Industry Revenue Share (%), by End User 2024 & 2032
- Figure 34: Latin America Artillery Ammunition Industry Revenue (Million), by Country 2024 & 2032
- Figure 35: Latin America Artillery Ammunition Industry Revenue Share (%), by Country 2024 & 2032
- Figure 36: Middle East and Africa Artillery Ammunition Industry Revenue (Million), by Caliber Type 2024 & 2032
- Figure 37: Middle East and Africa Artillery Ammunition Industry Revenue Share (%), by Caliber Type 2024 & 2032
- Figure 38: Middle East and Africa Artillery Ammunition Industry Revenue (Million), by End User 2024 & 2032
- Figure 39: Middle East and Africa Artillery Ammunition Industry Revenue Share (%), by End User 2024 & 2032
- Figure 40: Middle East and Africa Artillery Ammunition Industry Revenue (Million), by Country 2024 & 2032
- Figure 41: Middle East and Africa Artillery Ammunition Industry Revenue Share (%), by Country 2024 & 2032
List of Tables
- Table 1: Global Artillery Ammunition Industry Revenue Million Forecast, by Region 2019 & 2032
- Table 2: Global Artillery Ammunition Industry Revenue Million Forecast, by Caliber Type 2019 & 2032
- Table 3: Global Artillery Ammunition Industry Revenue Million Forecast, by End User 2019 & 2032
- Table 4: Global Artillery Ammunition Industry Revenue Million Forecast, by Region 2019 & 2032
- Table 5: Global Artillery Ammunition Industry Revenue Million Forecast, by Country 2019 & 2032
- Table 6: United States Artillery Ammunition Industry Revenue (Million) Forecast, by Application 2019 & 2032
- Table 7: Canada Artillery Ammunition Industry Revenue (Million) Forecast, by Application 2019 & 2032
- Table 8: Global Artillery Ammunition Industry Revenue Million Forecast, by Country 2019 & 2032
- Table 9: United Kingdom Artillery Ammunition Industry Revenue (Million) Forecast, by Application 2019 & 2032
- Table 10: Germany Artillery Ammunition Industry Revenue (Million) Forecast, by Application 2019 & 2032
- Table 11: France Artillery Ammunition Industry Revenue (Million) Forecast, by Application 2019 & 2032
- Table 12: Russia Artillery Ammunition Industry Revenue (Million) Forecast, by Application 2019 & 2032
- Table 13: Rest of Europe Artillery Ammunition Industry Revenue (Million) Forecast, by Application 2019 & 2032
- Table 14: Global Artillery Ammunition Industry Revenue Million Forecast, by Country 2019 & 2032
- Table 15: China Artillery Ammunition Industry Revenue (Million) Forecast, by Application 2019 & 2032
- Table 16: India Artillery Ammunition Industry Revenue (Million) Forecast, by Application 2019 & 2032
- Table 17: Japan Artillery Ammunition Industry Revenue (Million) Forecast, by Application 2019 & 2032
- Table 18: South Korea Artillery Ammunition Industry Revenue (Million) Forecast, by Application 2019 & 2032
- Table 19: Rest of Asia Pacific Artillery Ammunition Industry Revenue (Million) Forecast, by Application 2019 & 2032
- Table 20: Global Artillery Ammunition Industry Revenue Million Forecast, by Country 2019 & 2032
- Table 21: Brazil Artillery Ammunition Industry Revenue (Million) Forecast, by Application 2019 & 2032
- Table 22: Rest of Latin America Artillery Ammunition Industry Revenue (Million) Forecast, by Application 2019 & 2032
- Table 23: Global Artillery Ammunition Industry Revenue Million Forecast, by Country 2019 & 2032
- Table 24: United Arab Emirates Artillery Ammunition Industry Revenue (Million) Forecast, by Application 2019 & 2032
- Table 25: Saudi Arabia Artillery Ammunition Industry Revenue (Million) Forecast, by Application 2019 & 2032
- Table 26: Israel Artillery Ammunition Industry Revenue (Million) Forecast, by Application 2019 & 2032
- Table 27: South Africa Artillery Ammunition Industry Revenue (Million) Forecast, by Application 2019 & 2032
- Table 28: Rest of Middle East and Africa Artillery Ammunition Industry Revenue (Million) Forecast, by Application 2019 & 2032
- Table 29: Global Artillery Ammunition Industry Revenue Million Forecast, by Caliber Type 2019 & 2032
- Table 30: Global Artillery Ammunition Industry Revenue Million Forecast, by End User 2019 & 2032
- Table 31: Global Artillery Ammunition Industry Revenue Million Forecast, by Country 2019 & 2032
- Table 32: United States Artillery Ammunition Industry Revenue (Million) Forecast, by Application 2019 & 2032
- Table 33: Canada Artillery Ammunition Industry Revenue (Million) Forecast, by Application 2019 & 2032
- Table 34: Global Artillery Ammunition Industry Revenue Million Forecast, by Caliber Type 2019 & 2032
- Table 35: Global Artillery Ammunition Industry Revenue Million Forecast, by End User 2019 & 2032
- Table 36: Global Artillery Ammunition Industry Revenue Million Forecast, by Country 2019 & 2032
- Table 37: United Kingdom Artillery Ammunition Industry Revenue (Million) Forecast, by Application 2019 & 2032
- Table 38: Germany Artillery Ammunition Industry Revenue (Million) Forecast, by Application 2019 & 2032
- Table 39: France Artillery Ammunition Industry Revenue (Million) Forecast, by Application 2019 & 2032
- Table 40: Russia Artillery Ammunition Industry Revenue (Million) Forecast, by Application 2019 & 2032
- Table 41: Rest of Europe Artillery Ammunition Industry Revenue (Million) Forecast, by Application 2019 & 2032
- Table 42: Global Artillery Ammunition Industry Revenue Million Forecast, by Caliber Type 2019 & 2032
- Table 43: Global Artillery Ammunition Industry Revenue Million Forecast, by End User 2019 & 2032
- Table 44: Global Artillery Ammunition Industry Revenue Million Forecast, by Country 2019 & 2032
- Table 45: China Artillery Ammunition Industry Revenue (Million) Forecast, by Application 2019 & 2032
- Table 46: India Artillery Ammunition Industry Revenue (Million) Forecast, by Application 2019 & 2032
- Table 47: Japan Artillery Ammunition Industry Revenue (Million) Forecast, by Application 2019 & 2032
- Table 48: South Korea Artillery Ammunition Industry Revenue (Million) Forecast, by Application 2019 & 2032
- Table 49: Rest of Asia Pacific Artillery Ammunition Industry Revenue (Million) Forecast, by Application 2019 & 2032
- Table 50: Global Artillery Ammunition Industry Revenue Million Forecast, by Caliber Type 2019 & 2032
- Table 51: Global Artillery Ammunition Industry Revenue Million Forecast, by End User 2019 & 2032
- Table 52: Global Artillery Ammunition Industry Revenue Million Forecast, by Country 2019 & 2032
- Table 53: Brazil Artillery Ammunition Industry Revenue (Million) Forecast, by Application 2019 & 2032
- Table 54: Rest of Latin America Artillery Ammunition Industry Revenue (Million) Forecast, by Application 2019 & 2032
- Table 55: Global Artillery Ammunition Industry Revenue Million Forecast, by Caliber Type 2019 & 2032
- Table 56: Global Artillery Ammunition Industry Revenue Million Forecast, by End User 2019 & 2032
- Table 57: Global Artillery Ammunition Industry Revenue Million Forecast, by Country 2019 & 2032
- Table 58: United Arab Emirates Artillery Ammunition Industry Revenue (Million) Forecast, by Application 2019 & 2032
- Table 59: Saudi Arabia Artillery Ammunition Industry Revenue (Million) Forecast, by Application 2019 & 2032
- Table 60: Israel Artillery Ammunition Industry Revenue (Million) Forecast, by Application 2019 & 2032
- Table 61: South Africa Artillery Ammunition Industry Revenue (Million) Forecast, by Application 2019 & 2032
- Table 62: Rest of Middle East and Africa Artillery Ammunition Industry Revenue (Million) Forecast, by Application 2019 & 2032
Frequently Asked Questions
1. What is the projected Compound Annual Growth Rate (CAGR) of the Artillery Ammunition Industry?
The projected CAGR is approximately 8.25%.
2. Which companies are prominent players in the Artillery Ammunition Industry?
Key companies in the market include General Dynamics Corporation, Leonardo SpA, Rheinmetall AG, Diehl Stiftung & Co KG, Denel SOC Ltd, BAE Systems PLC, Northrop Grumman, Raytheon Technologies Corporation*List Not Exhaustive, Global Ordnance, Nammo AS, Ukroboronprom, Saab AB, ST Engineering, Nexter group KNDS.
3. What are the main segments of the Artillery Ammunition Industry?
The market segments include Caliber Type, End User.
4. Can you provide details about the market size?
The market size is estimated to be USD 309.96 Million as of 2022.
5. What are some drivers contributing to market growth?
N/A
6. What are the notable trends driving market growth?
Ground Forces Segment is Projected to Grow with Highest CAGR During the Forecast Period.
7. Are there any restraints impacting market growth?
N/A
8. Can you provide examples of recent developments in the market?
In April 2022, the Armed Forces of Senegal signed a contract with Nexter to supply 8 105 LG guns and 105 mm ammunition. The 105LG is a 105 mm towed artillery gun known for its reliability and unmatched lightness (1,650 kg) and can be used in extreme climates and difficult terrains.
9. What pricing options are available for accessing the report?
Pricing options include single-user, multi-user, and enterprise licenses priced at USD 4750, USD 5250, and USD 8750 respectively.
10. Is the market size provided in terms of value or volume?
The market size is provided in terms of value, measured in Million.
11. Are there any specific market keywords associated with the report?
Yes, the market keyword associated with the report is "Artillery Ammunition Industry," which aids in identifying and referencing the specific market segment covered.
12. How do I determine which pricing option suits my needs best?
The pricing options vary based on user requirements and access needs. Individual users may opt for single-user licenses, while businesses requiring broader access may choose multi-user or enterprise licenses for cost-effective access to the report.
13. Are there any additional resources or data provided in the Artillery Ammunition Industry report?
While the report offers comprehensive insights, it's advisable to review the specific contents or supplementary materials provided to ascertain if additional resources or data are available.
14. How can I stay updated on further developments or reports in the Artillery Ammunition Industry?
To stay informed about further developments, trends, and reports in the Artillery Ammunition Industry, consider subscribing to industry newsletters, following relevant companies and organizations, or regularly checking reputable industry news sources and publications.
Methodology
Step 1 - Identification of Relevant Samples Size from Population Database


Step 2 - Approaches for Defining Global Market Size (Value, Volume* & Price*)

Note*: In applicable scenarios
Step 3 - Data Sources
Primary Research
- Web Analytics
- Survey Reports
- Research Institute
- Latest Research Reports
- Opinion Leaders
Secondary Research
- Annual Reports
- White Paper
- Latest Press Release
- Industry Association
- Paid Database
- Investor Presentations

Step 4 - Data Triangulation
Involves using different sources of information in order to increase the validity of a study
These sources are likely to be stakeholders in a program - participants, other researchers, program staff, other community members, and so on.
Then we put all data in single framework & apply various statistical tools to find out the dynamic on the market.
During the analysis stage, feedback from the stakeholder groups would be compared to determine areas of agreement as well as areas of divergence


