
Key Insights
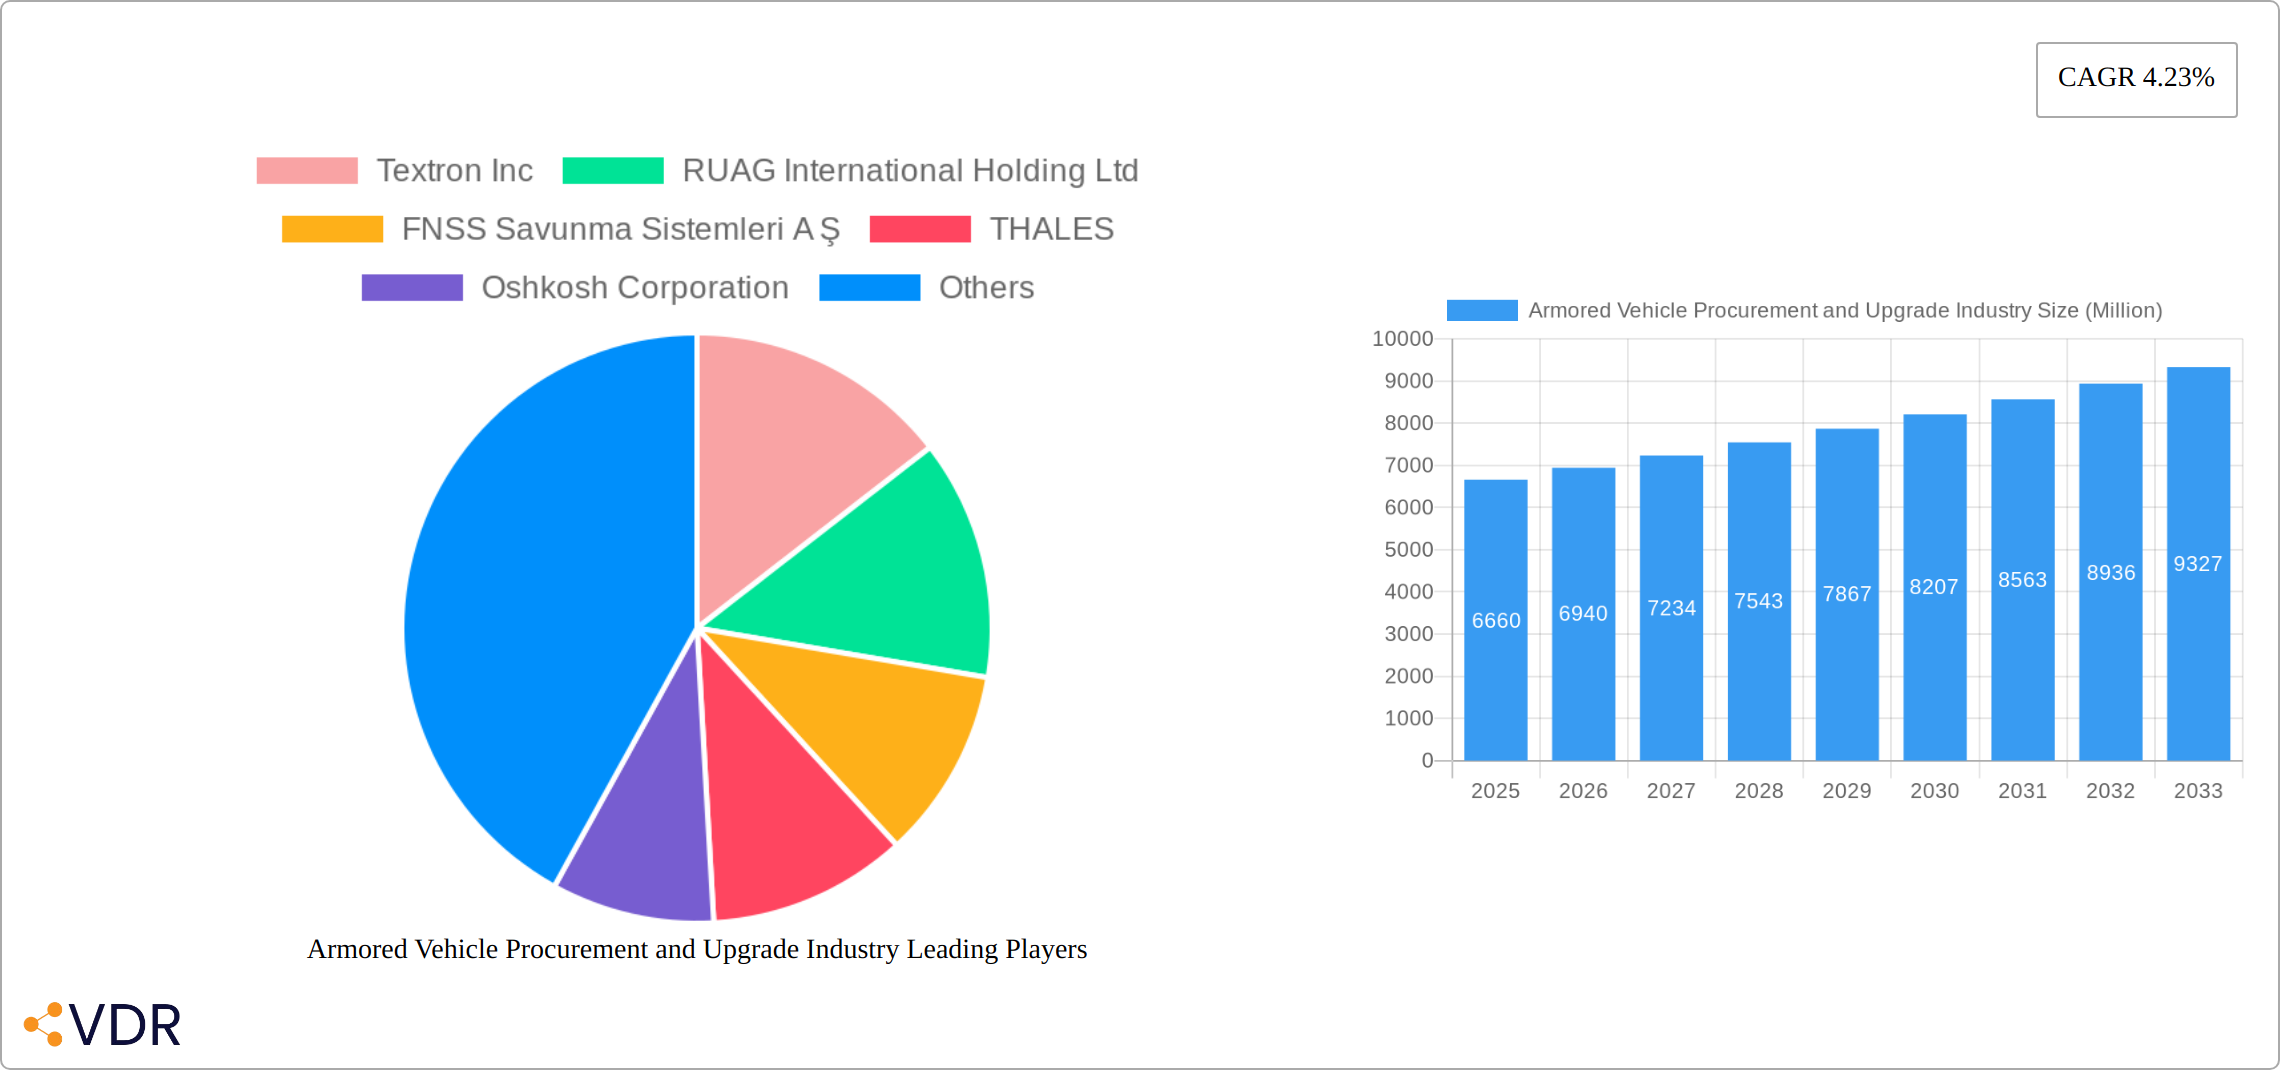
The global armored vehicle procurement and upgrade market, valued at $6.66 billion in 2025, is projected to experience robust growth, driven by escalating geopolitical instability and the increasing demand for advanced military capabilities. A Compound Annual Growth Rate (CAGR) of 4.23% from 2025 to 2033 indicates a significant market expansion, reaching an estimated value exceeding $9.5 billion by 2033. This growth is fueled by several key factors. Firstly, modernization efforts by armed forces worldwide are driving the demand for upgraded armored vehicles with enhanced protection, firepower, and technological integration. Secondly, the increasing adoption of unmanned and autonomous systems within armored vehicle platforms is transforming the battlefield landscape and generating considerable investment. Finally, ongoing conflicts and regional tensions are stimulating significant procurement activities for new armored vehicles, particularly in regions experiencing political instability. The market segment analysis reveals a diverse range of vehicle types, with Armored Personnel Carriers (APCs), Infantry Fighting Vehicles (IFVs), and Mine-resistant Ambush Protected (MRAP) vehicles constituting significant shares. The competitive landscape is characterized by prominent players such as Textron, Oshkosh, General Dynamics, Rheinmetall, and BAE Systems, each vying for market share through technological innovation and strategic partnerships.
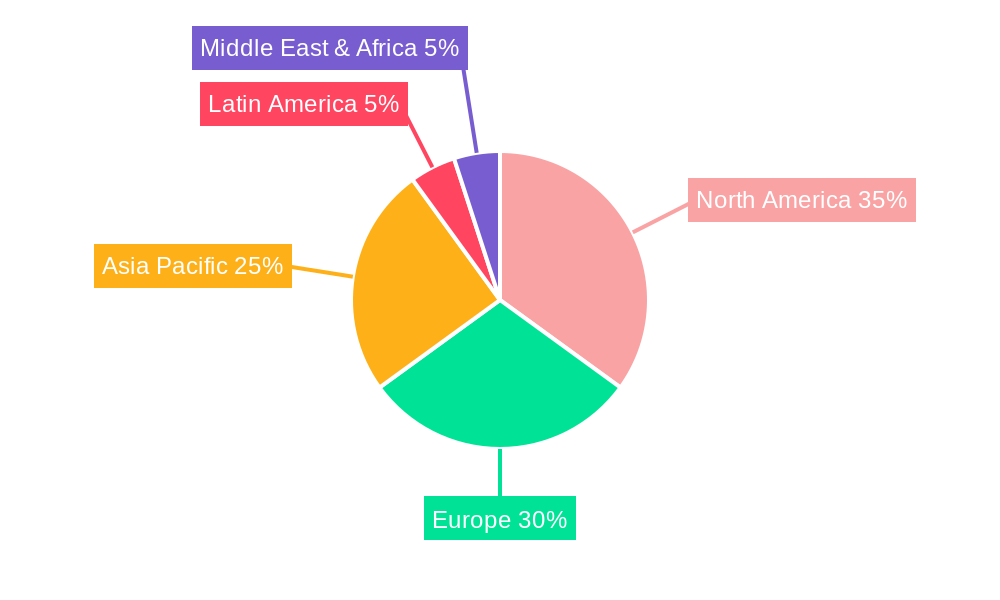
The geographical distribution of the market shows strong demand from North America and Europe, driven by high defense budgets and ongoing modernization programs. However, the Asia-Pacific region, particularly countries like India and China, is expected to witness substantial growth due to their expanding defense capabilities and investments in military equipment. Latin America and the Middle East also present significant opportunities, although market growth in these regions may be influenced by factors like fluctuating political landscapes and economic conditions. The market's success will hinge on technological advancements, specifically in areas like active protection systems, advanced materials, and autonomous capabilities. Furthermore, the ability of manufacturers to adapt to evolving geopolitical circumstances and tailor their offerings to specific regional requirements will be critical in shaping their market position within this dynamic landscape. The industry's success is intrinsically linked to the global security climate, suggesting continued growth as long as the need for advanced defense technologies persists.
Armored Vehicle Procurement and Upgrade Industry Market Report: 2019-2033
This comprehensive report provides a detailed analysis of the Armored Vehicle Procurement and Upgrade industry, encompassing market dynamics, growth trends, regional segmentation, product landscape, and key player profiles. The study period covers 2019-2033, with 2025 as the base and estimated year. The report offers invaluable insights for industry professionals, investors, and stakeholders seeking to understand and capitalize on opportunities within this dynamic sector. The parent market is the defense industry, with the child market being armored vehicle manufacturing and upgrade services.
Armored Vehicle Procurement and Upgrade Industry Market Dynamics & Structure
The global armored vehicle procurement and upgrade market is characterized by moderate concentration, with several key players holding significant market share. The market size in 2025 is estimated at xx Million units, exhibiting a complex interplay of technological innovation, stringent regulatory frameworks, and the presence of competitive product substitutes. Mergers and acquisitions (M&A) activity plays a crucial role in shaping market structure and competitive dynamics. The historical period (2019-2024) saw xx Million units in M&A deals, while the forecast period (2025-2033) projects xx Million units, indicative of ongoing consolidation.
- Market Concentration: Moderately concentrated, with top 5 players holding approximately 60% market share.
- Technological Innovation: Driven by advancements in materials science, sensor technology, and autonomous systems. Key barriers include high R&D costs and stringent testing requirements.
- Regulatory Frameworks: Vary significantly across regions, influencing procurement decisions and impacting market access. Compliance costs are significant, particularly with export controls.
- Competitive Product Substitutes: Limited direct substitutes, but evolving drone technology and other asymmetric warfare capabilities present indirect competitive threats.
- End-User Demographics: Primarily government defense forces and paramilitary organizations, with increasing demand from international peacekeeping missions and specialized security forces.
- M&A Trends: Consolidation is expected to continue, driven by economies of scale, technological synergies, and enhanced market access.
Armored Vehicle Procurement and Upgrade Industry Growth Trends & Insights
The armored vehicle procurement and upgrade market is experiencing robust growth, projected to continue strongly throughout the forecast period (2025-2033). This expansion is fueled by a confluence of factors including geopolitical instability, escalating defense budgets globally, and the continuous advancement of vehicle technologies. Market analysts predict a Compound Annual Growth Rate (CAGR) of xx% between 2025 and 2033. A notable aspect of this market is the relatively low penetration of cutting-edge technologies such as active protection systems and advanced communication suites, representing significant untapped potential for future growth. Furthermore, evolving military operational requirements, such as a preference for lighter, more agile armored vehicles, are significantly influencing procurement strategies across various nations. The historical period (2019-2024) showcased a CAGR of xx%, reflecting a period of market stabilization before the current accelerated growth trajectory. The market size in 2025 is estimated at xx million units, highlighting the considerable scale and importance of this sector. The adoption rate of these new technologies is expected to increase exponentially, driven by the persistent demand for enhanced protection, situational awareness, and improved battlefield effectiveness.
Dominant Regions, Countries, or Segments in Armored Vehicle Procurement and Upgrade Industry
North America and Europe currently hold the leading positions in the armored vehicle procurement and upgrade market, driven by substantial defense budgets and the presence of major industry players with established manufacturing capabilities. However, the Asia-Pacific region is poised for the most rapid expansion during the forecast period, propelled by significantly increased defense spending and widespread military modernization initiatives across numerous nations within the region. Analyzing vehicle types, Armored Personnel Carriers (APCs) and Infantry Fighting Vehicles (IFVs) currently command the largest market share. Nevertheless, the Mine-Resistant Ambush Protected (MRAP) segment is experiencing remarkable growth, particularly in regions grappling with counter-insurgency operations. This highlights the adaptable nature of the market and its responsiveness to evolving geopolitical landscapes.
Key Drivers:
- Increased defense spending: Global investments in military modernization programs are accelerating market growth.
- Geopolitical instability: Rising global tensions and conflicts directly translate into increased demand for armored vehicles.
- Technological advancements: Continuous improvements in vehicle design, materials science, and protection systems are driving innovation and demand.
- Urban warfare considerations: The increasing prevalence of urban combat scenarios necessitates the development and procurement of vehicles optimized for such environments.
Dominance Factors:
- North America & Europe: Established manufacturing infrastructure, substantial defense budgets, and high technological expertise create a strong market base.
- Asia-Pacific: Rapid economic growth, substantial increases in defense expenditure, and large-scale modernization of military forces are key drivers of expansion.
- APC/IFV Segments: These vehicle types remain central to conventional warfare and peacekeeping operations, maintaining consistent high demand.
- MRAP Segment: Growth is spurred by ongoing counter-insurgency operations in specific regions, emphasizing the dynamic nature of market segments.
Armored Vehicle Procurement and Upgrade Industry Product Landscape
The armored vehicle market showcases a diverse range of products, with ongoing innovation in areas such as enhanced protection, mobility, and situational awareness. Vehicles are tailored for specific operational needs, leading to diverse configurations and capabilities. Key advancements include the integration of advanced sensors, improved communication systems, and the exploration of autonomous and remotely operated vehicles. Unique selling propositions (USPs) often center on superior protection against specific threats (e.g., IEDs, anti-tank weapons), improved mobility in challenging terrains, and enhanced crew survivability.
Key Drivers, Barriers & Challenges in Armored Vehicle Procurement and Upgrade Industry
Key Drivers: The market's growth is primarily driven by expanding global defense budgets, escalating geopolitical instability, the critical need for enhanced troop protection, and continuous technological advancements in vehicle design and capabilities. The emergence of hybrid and electric power systems is also contributing significantly to market expansion, reflecting a move towards more sustainable and efficient platforms.
Challenges and Restraints: The industry faces significant hurdles including high procurement costs, complex and often lengthy acquisition processes, potential supply chain disruptions, and the evolving threat of asymmetric warfare tactics. Rapid technological advancements contribute to a complex regulatory landscape and impact lifecycle management costs, necessitating ongoing adaptation and investment.
Emerging Opportunities in Armored Vehicle Procurement and Upgrade Industry
Untapped markets in developing countries, the growing demand for specialized armored vehicles (e.g., for law enforcement), and the increasing integration of autonomous features and AI in armored vehicle systems present exciting opportunities. The development of lighter, more fuel-efficient vehicles also offers promising avenues for market expansion.
Growth Accelerators in the Armored Vehicle Procurement and Upgrade Industry Industry
Technological breakthroughs in areas such as lightweight materials, active protection systems, and advanced sensor technologies are driving long-term growth. Strategic partnerships between defense contractors and technology providers, along with expansion into emerging markets through joint ventures and international collaborations, are also accelerating market expansion.
Key Players Shaping the Armored Vehicle Procurement and Upgrade Industry Market
- Textron Inc
- RUAG International Holding Ltd
- FNSS Savunma Sistemleri A Ş
- THALES
- Oshkosh Corporation
- General Dynamics Corporation
- Rheinmetall AG
- Elbit Systems Ltd
- The CMI Group Inc
- BMC Otomotiv Sanayi ve Ticaret A Ş
- KNDS N V
- Streit Group
- IVECO S p A
- BAE Systems plc
Notable Milestones in Armored Vehicle Procurement and Upgrade Industry Sector
- May 2023: Elbit Systems Ltd. secured a contract from the British Army for Project Vulcan, encompassing the maintenance and operation of the GMST system, Boxer armored vehicles, and Challenger 3 tanks. This highlights the ongoing importance of after-market services and support in this industry.
- May 2023: The Czech Ministry of Defence awarded a USD 2.2 billion contract to BAE Systems plc for 246 CV90 Mk IV infantry fighting vehicles, with Slovakia placing a separate order for an additional 152. This substantial contract underscores the significant investment in modern armored vehicle platforms.
- [Add other recent significant milestones here, with dates and brief descriptions]
In-Depth Armored Vehicle Procurement and Upgrade Industry Market Outlook
The armored vehicle procurement and upgrade market exhibits strong potential for continued growth, driven by a combination of factors: ongoing technological innovation, escalating defense budgets worldwide, and persistent geopolitical uncertainty. Strategic partnerships, expansion into new and emerging markets, and the development of innovative vehicle designs will significantly influence the market landscape in the years ahead, creating substantial opportunities for established industry leaders and new entrants alike. Future success within this market hinges on the ability of companies to adapt to evolving threat environments, effectively leverage technological advancements, and enhance the capabilities and effectiveness of armored vehicles to meet the demands of modern warfare.
Armored Vehicle Procurement and Upgrade Industry Segmentation
-
1. Vehicle Type
- 1.1. Armored Personnel Carrier (APC)
- 1.2. Infantry Fighting Vehicle (IFV)
- 1.3. Mine-resistant Ambush Protected (MRAP)
- 1.4. Main Battle Tank (MBT)
- 1.5. Other Vehicle Types
Armored Vehicle Procurement and Upgrade Industry Segmentation By Geography
-
1. North America
- 1.1. United States
- 1.2. Canada
-
2. Europe
- 2.1. United Kingdom
- 2.2. France
- 2.3. Germany
- 2.4. Russia
- 2.5. Rest of Europe
-
3. Asia Pacific
- 3.1. China
- 3.2. India
- 3.3. Japan
- 3.4. South Korea
- 3.5. Australia
- 3.6. Rest of Asia Pacific
-
4. Latin America
- 4.1. Brazil
- 4.2. Mexico
- 4.3. Rest of Latin America
- 5. Middle East
-
6. United Arab Emirates
- 6.1. Saudi Arabia
- 6.2. Turkey
- 6.3. South Africa
- 6.4. Rest of Middle East and Africa
Armored Vehicle Procurement and Upgrade Industry REPORT HIGHLIGHTS
| Aspects | Details |
|---|---|
| Study Period | 2019-2033 |
| Base Year | 2024 |
| Estimated Year | 2025 |
| Forecast Period | 2025-2033 |
| Historical Period | 2019-2024 |
| Growth Rate | CAGR of 4.23% from 2019-2033 |
| Segmentation |
|
Table of Contents
- 1. Introduction
- 1.1. Research Scope
- 1.2. Market Segmentation
- 1.3. Research Methodology
- 1.4. Definitions and Assumptions
- 2. Executive Summary
- 2.1. Introduction
- 3. Market Dynamics
- 3.1. Introduction
- 3.2. Market Drivers
- 3.3. Market Restrains
- 3.4. Market Trends
- 3.4.1. The Infantry Fighting Vehicle Segment to Dominate Market Share
- 4. Market Factor Analysis
- 4.1. Porters Five Forces
- 4.2. Supply/Value Chain
- 4.3. PESTEL analysis
- 4.4. Market Entropy
- 4.5. Patent/Trademark Analysis
- 5. Global Armored Vehicle Procurement and Upgrade Industry Analysis, Insights and Forecast, 2019-2031
- 5.1. Market Analysis, Insights and Forecast - by Vehicle Type
- 5.1.1. Armored Personnel Carrier (APC)
- 5.1.2. Infantry Fighting Vehicle (IFV)
- 5.1.3. Mine-resistant Ambush Protected (MRAP)
- 5.1.4. Main Battle Tank (MBT)
- 5.1.5. Other Vehicle Types
- 5.2. Market Analysis, Insights and Forecast - by Region
- 5.2.1. North America
- 5.2.2. Europe
- 5.2.3. Asia Pacific
- 5.2.4. Latin America
- 5.2.5. Middle East
- 5.2.6. United Arab Emirates
- 5.1. Market Analysis, Insights and Forecast - by Vehicle Type
- 6. North America Armored Vehicle Procurement and Upgrade Industry Analysis, Insights and Forecast, 2019-2031
- 6.1. Market Analysis, Insights and Forecast - by Vehicle Type
- 6.1.1. Armored Personnel Carrier (APC)
- 6.1.2. Infantry Fighting Vehicle (IFV)
- 6.1.3. Mine-resistant Ambush Protected (MRAP)
- 6.1.4. Main Battle Tank (MBT)
- 6.1.5. Other Vehicle Types
- 6.1. Market Analysis, Insights and Forecast - by Vehicle Type
- 7. Europe Armored Vehicle Procurement and Upgrade Industry Analysis, Insights and Forecast, 2019-2031
- 7.1. Market Analysis, Insights and Forecast - by Vehicle Type
- 7.1.1. Armored Personnel Carrier (APC)
- 7.1.2. Infantry Fighting Vehicle (IFV)
- 7.1.3. Mine-resistant Ambush Protected (MRAP)
- 7.1.4. Main Battle Tank (MBT)
- 7.1.5. Other Vehicle Types
- 7.1. Market Analysis, Insights and Forecast - by Vehicle Type
- 8. Asia Pacific Armored Vehicle Procurement and Upgrade Industry Analysis, Insights and Forecast, 2019-2031
- 8.1. Market Analysis, Insights and Forecast - by Vehicle Type
- 8.1.1. Armored Personnel Carrier (APC)
- 8.1.2. Infantry Fighting Vehicle (IFV)
- 8.1.3. Mine-resistant Ambush Protected (MRAP)
- 8.1.4. Main Battle Tank (MBT)
- 8.1.5. Other Vehicle Types
- 8.1. Market Analysis, Insights and Forecast - by Vehicle Type
- 9. Latin America Armored Vehicle Procurement and Upgrade Industry Analysis, Insights and Forecast, 2019-2031
- 9.1. Market Analysis, Insights and Forecast - by Vehicle Type
- 9.1.1. Armored Personnel Carrier (APC)
- 9.1.2. Infantry Fighting Vehicle (IFV)
- 9.1.3. Mine-resistant Ambush Protected (MRAP)
- 9.1.4. Main Battle Tank (MBT)
- 9.1.5. Other Vehicle Types
- 9.1. Market Analysis, Insights and Forecast - by Vehicle Type
- 10. Middle East Armored Vehicle Procurement and Upgrade Industry Analysis, Insights and Forecast, 2019-2031
- 10.1. Market Analysis, Insights and Forecast - by Vehicle Type
- 10.1.1. Armored Personnel Carrier (APC)
- 10.1.2. Infantry Fighting Vehicle (IFV)
- 10.1.3. Mine-resistant Ambush Protected (MRAP)
- 10.1.4. Main Battle Tank (MBT)
- 10.1.5. Other Vehicle Types
- 10.1. Market Analysis, Insights and Forecast - by Vehicle Type
- 11. United Arab Emirates Armored Vehicle Procurement and Upgrade Industry Analysis, Insights and Forecast, 2019-2031
- 11.1. Market Analysis, Insights and Forecast - by Vehicle Type
- 11.1.1. Armored Personnel Carrier (APC)
- 11.1.2. Infantry Fighting Vehicle (IFV)
- 11.1.3. Mine-resistant Ambush Protected (MRAP)
- 11.1.4. Main Battle Tank (MBT)
- 11.1.5. Other Vehicle Types
- 11.1. Market Analysis, Insights and Forecast - by Vehicle Type
- 12. North America Armored Vehicle Procurement and Upgrade Industry Analysis, Insights and Forecast, 2019-2031
- 12.1. Market Analysis, Insights and Forecast - By Country/Sub-region
- 12.1.1 United States
- 12.1.2 Canada
- 13. Europe Armored Vehicle Procurement and Upgrade Industry Analysis, Insights and Forecast, 2019-2031
- 13.1. Market Analysis, Insights and Forecast - By Country/Sub-region
- 13.1.1 United Kingdom
- 13.1.2 France
- 13.1.3 Germany
- 13.1.4 Russia
- 13.1.5 Rest of Europe
- 14. Asia Pacific Armored Vehicle Procurement and Upgrade Industry Analysis, Insights and Forecast, 2019-2031
- 14.1. Market Analysis, Insights and Forecast - By Country/Sub-region
- 14.1.1 China
- 14.1.2 India
- 14.1.3 Japan
- 14.1.4 South Korea
- 14.1.5 Australia
- 14.1.6 Rest of Asia Pacific
- 15. Latin America Armored Vehicle Procurement and Upgrade Industry Analysis, Insights and Forecast, 2019-2031
- 15.1. Market Analysis, Insights and Forecast - By Country/Sub-region
- 15.1.1 Brazil
- 15.1.2 Mexico
- 15.1.3 Rest of Latin America
- 16. Middle East Armored Vehicle Procurement and Upgrade Industry Analysis, Insights and Forecast, 2019-2031
- 16.1. Market Analysis, Insights and Forecast - By Country/Sub-region
- 16.1.1.
- 17. United Arab Emirates Armored Vehicle Procurement and Upgrade Industry Analysis, Insights and Forecast, 2019-2031
- 17.1. Market Analysis, Insights and Forecast - By Country/Sub-region
- 17.1.1 Saudi Arabia
- 17.1.2 Turkey
- 17.1.3 South Africa
- 17.1.4 Rest of Middle East and Africa
- 18. Competitive Analysis
- 18.1. Global Market Share Analysis 2024
- 18.2. Company Profiles
- 18.2.1 Textron Inc
- 18.2.1.1. Overview
- 18.2.1.2. Products
- 18.2.1.3. SWOT Analysis
- 18.2.1.4. Recent Developments
- 18.2.1.5. Financials (Based on Availability)
- 18.2.2 RUAG International Holding Ltd
- 18.2.2.1. Overview
- 18.2.2.2. Products
- 18.2.2.3. SWOT Analysis
- 18.2.2.4. Recent Developments
- 18.2.2.5. Financials (Based on Availability)
- 18.2.3 FNSS Savunma Sistemleri A Ş
- 18.2.3.1. Overview
- 18.2.3.2. Products
- 18.2.3.3. SWOT Analysis
- 18.2.3.4. Recent Developments
- 18.2.3.5. Financials (Based on Availability)
- 18.2.4 THALES
- 18.2.4.1. Overview
- 18.2.4.2. Products
- 18.2.4.3. SWOT Analysis
- 18.2.4.4. Recent Developments
- 18.2.4.5. Financials (Based on Availability)
- 18.2.5 Oshkosh Corporation
- 18.2.5.1. Overview
- 18.2.5.2. Products
- 18.2.5.3. SWOT Analysis
- 18.2.5.4. Recent Developments
- 18.2.5.5. Financials (Based on Availability)
- 18.2.6 General Dynamics Corporation
- 18.2.6.1. Overview
- 18.2.6.2. Products
- 18.2.6.3. SWOT Analysis
- 18.2.6.4. Recent Developments
- 18.2.6.5. Financials (Based on Availability)
- 18.2.7 Rheinmetall AG
- 18.2.7.1. Overview
- 18.2.7.2. Products
- 18.2.7.3. SWOT Analysis
- 18.2.7.4. Recent Developments
- 18.2.7.5. Financials (Based on Availability)
- 18.2.8 Elbit Systems Ltd
- 18.2.8.1. Overview
- 18.2.8.2. Products
- 18.2.8.3. SWOT Analysis
- 18.2.8.4. Recent Developments
- 18.2.8.5. Financials (Based on Availability)
- 18.2.9 The CMI Group Inc
- 18.2.9.1. Overview
- 18.2.9.2. Products
- 18.2.9.3. SWOT Analysis
- 18.2.9.4. Recent Developments
- 18.2.9.5. Financials (Based on Availability)
- 18.2.10 BMC Otomotiv Sanayi ve Ticaret A Ş
- 18.2.10.1. Overview
- 18.2.10.2. Products
- 18.2.10.3. SWOT Analysis
- 18.2.10.4. Recent Developments
- 18.2.10.5. Financials (Based on Availability)
- 18.2.11 KNDS N V
- 18.2.11.1. Overview
- 18.2.11.2. Products
- 18.2.11.3. SWOT Analysis
- 18.2.11.4. Recent Developments
- 18.2.11.5. Financials (Based on Availability)
- 18.2.12 Streit Grou
- 18.2.12.1. Overview
- 18.2.12.2. Products
- 18.2.12.3. SWOT Analysis
- 18.2.12.4. Recent Developments
- 18.2.12.5. Financials (Based on Availability)
- 18.2.13 IVECO S p A
- 18.2.13.1. Overview
- 18.2.13.2. Products
- 18.2.13.3. SWOT Analysis
- 18.2.13.4. Recent Developments
- 18.2.13.5. Financials (Based on Availability)
- 18.2.14 BAE Systems plc
- 18.2.14.1. Overview
- 18.2.14.2. Products
- 18.2.14.3. SWOT Analysis
- 18.2.14.4. Recent Developments
- 18.2.14.5. Financials (Based on Availability)
- 18.2.1 Textron Inc
List of Figures
- Figure 1: Global Armored Vehicle Procurement and Upgrade Industry Revenue Breakdown (Million, %) by Region 2024 & 2032
- Figure 2: North America Armored Vehicle Procurement and Upgrade Industry Revenue (Million), by Country 2024 & 2032
- Figure 3: North America Armored Vehicle Procurement and Upgrade Industry Revenue Share (%), by Country 2024 & 2032
- Figure 4: Europe Armored Vehicle Procurement and Upgrade Industry Revenue (Million), by Country 2024 & 2032
- Figure 5: Europe Armored Vehicle Procurement and Upgrade Industry Revenue Share (%), by Country 2024 & 2032
- Figure 6: Asia Pacific Armored Vehicle Procurement and Upgrade Industry Revenue (Million), by Country 2024 & 2032
- Figure 7: Asia Pacific Armored Vehicle Procurement and Upgrade Industry Revenue Share (%), by Country 2024 & 2032
- Figure 8: Latin America Armored Vehicle Procurement and Upgrade Industry Revenue (Million), by Country 2024 & 2032
- Figure 9: Latin America Armored Vehicle Procurement and Upgrade Industry Revenue Share (%), by Country 2024 & 2032
- Figure 10: Middle East Armored Vehicle Procurement and Upgrade Industry Revenue (Million), by Country 2024 & 2032
- Figure 11: Middle East Armored Vehicle Procurement and Upgrade Industry Revenue Share (%), by Country 2024 & 2032
- Figure 12: United Arab Emirates Armored Vehicle Procurement and Upgrade Industry Revenue (Million), by Country 2024 & 2032
- Figure 13: United Arab Emirates Armored Vehicle Procurement and Upgrade Industry Revenue Share (%), by Country 2024 & 2032
- Figure 14: North America Armored Vehicle Procurement and Upgrade Industry Revenue (Million), by Vehicle Type 2024 & 2032
- Figure 15: North America Armored Vehicle Procurement and Upgrade Industry Revenue Share (%), by Vehicle Type 2024 & 2032
- Figure 16: North America Armored Vehicle Procurement and Upgrade Industry Revenue (Million), by Country 2024 & 2032
- Figure 17: North America Armored Vehicle Procurement and Upgrade Industry Revenue Share (%), by Country 2024 & 2032
- Figure 18: Europe Armored Vehicle Procurement and Upgrade Industry Revenue (Million), by Vehicle Type 2024 & 2032
- Figure 19: Europe Armored Vehicle Procurement and Upgrade Industry Revenue Share (%), by Vehicle Type 2024 & 2032
- Figure 20: Europe Armored Vehicle Procurement and Upgrade Industry Revenue (Million), by Country 2024 & 2032
- Figure 21: Europe Armored Vehicle Procurement and Upgrade Industry Revenue Share (%), by Country 2024 & 2032
- Figure 22: Asia Pacific Armored Vehicle Procurement and Upgrade Industry Revenue (Million), by Vehicle Type 2024 & 2032
- Figure 23: Asia Pacific Armored Vehicle Procurement and Upgrade Industry Revenue Share (%), by Vehicle Type 2024 & 2032
- Figure 24: Asia Pacific Armored Vehicle Procurement and Upgrade Industry Revenue (Million), by Country 2024 & 2032
- Figure 25: Asia Pacific Armored Vehicle Procurement and Upgrade Industry Revenue Share (%), by Country 2024 & 2032
- Figure 26: Latin America Armored Vehicle Procurement and Upgrade Industry Revenue (Million), by Vehicle Type 2024 & 2032
- Figure 27: Latin America Armored Vehicle Procurement and Upgrade Industry Revenue Share (%), by Vehicle Type 2024 & 2032
- Figure 28: Latin America Armored Vehicle Procurement and Upgrade Industry Revenue (Million), by Country 2024 & 2032
- Figure 29: Latin America Armored Vehicle Procurement and Upgrade Industry Revenue Share (%), by Country 2024 & 2032
- Figure 30: Middle East Armored Vehicle Procurement and Upgrade Industry Revenue (Million), by Vehicle Type 2024 & 2032
- Figure 31: Middle East Armored Vehicle Procurement and Upgrade Industry Revenue Share (%), by Vehicle Type 2024 & 2032
- Figure 32: Middle East Armored Vehicle Procurement and Upgrade Industry Revenue (Million), by Country 2024 & 2032
- Figure 33: Middle East Armored Vehicle Procurement and Upgrade Industry Revenue Share (%), by Country 2024 & 2032
- Figure 34: United Arab Emirates Armored Vehicle Procurement and Upgrade Industry Revenue (Million), by Vehicle Type 2024 & 2032
- Figure 35: United Arab Emirates Armored Vehicle Procurement and Upgrade Industry Revenue Share (%), by Vehicle Type 2024 & 2032
- Figure 36: United Arab Emirates Armored Vehicle Procurement and Upgrade Industry Revenue (Million), by Country 2024 & 2032
- Figure 37: United Arab Emirates Armored Vehicle Procurement and Upgrade Industry Revenue Share (%), by Country 2024 & 2032
List of Tables
- Table 1: Global Armored Vehicle Procurement and Upgrade Industry Revenue Million Forecast, by Region 2019 & 2032
- Table 2: Global Armored Vehicle Procurement and Upgrade Industry Revenue Million Forecast, by Vehicle Type 2019 & 2032
- Table 3: Global Armored Vehicle Procurement and Upgrade Industry Revenue Million Forecast, by Region 2019 & 2032
- Table 4: Global Armored Vehicle Procurement and Upgrade Industry Revenue Million Forecast, by Country 2019 & 2032
- Table 5: United States Armored Vehicle Procurement and Upgrade Industry Revenue (Million) Forecast, by Application 2019 & 2032
- Table 6: Canada Armored Vehicle Procurement and Upgrade Industry Revenue (Million) Forecast, by Application 2019 & 2032
- Table 7: Global Armored Vehicle Procurement and Upgrade Industry Revenue Million Forecast, by Country 2019 & 2032
- Table 8: United Kingdom Armored Vehicle Procurement and Upgrade Industry Revenue (Million) Forecast, by Application 2019 & 2032
- Table 9: France Armored Vehicle Procurement and Upgrade Industry Revenue (Million) Forecast, by Application 2019 & 2032
- Table 10: Germany Armored Vehicle Procurement and Upgrade Industry Revenue (Million) Forecast, by Application 2019 & 2032
- Table 11: Russia Armored Vehicle Procurement and Upgrade Industry Revenue (Million) Forecast, by Application 2019 & 2032
- Table 12: Rest of Europe Armored Vehicle Procurement and Upgrade Industry Revenue (Million) Forecast, by Application 2019 & 2032
- Table 13: Global Armored Vehicle Procurement and Upgrade Industry Revenue Million Forecast, by Country 2019 & 2032
- Table 14: China Armored Vehicle Procurement and Upgrade Industry Revenue (Million) Forecast, by Application 2019 & 2032
- Table 15: India Armored Vehicle Procurement and Upgrade Industry Revenue (Million) Forecast, by Application 2019 & 2032
- Table 16: Japan Armored Vehicle Procurement and Upgrade Industry Revenue (Million) Forecast, by Application 2019 & 2032
- Table 17: South Korea Armored Vehicle Procurement and Upgrade Industry Revenue (Million) Forecast, by Application 2019 & 2032
- Table 18: Australia Armored Vehicle Procurement and Upgrade Industry Revenue (Million) Forecast, by Application 2019 & 2032
- Table 19: Rest of Asia Pacific Armored Vehicle Procurement and Upgrade Industry Revenue (Million) Forecast, by Application 2019 & 2032
- Table 20: Global Armored Vehicle Procurement and Upgrade Industry Revenue Million Forecast, by Country 2019 & 2032
- Table 21: Brazil Armored Vehicle Procurement and Upgrade Industry Revenue (Million) Forecast, by Application 2019 & 2032
- Table 22: Mexico Armored Vehicle Procurement and Upgrade Industry Revenue (Million) Forecast, by Application 2019 & 2032
- Table 23: Rest of Latin America Armored Vehicle Procurement and Upgrade Industry Revenue (Million) Forecast, by Application 2019 & 2032
- Table 24: Global Armored Vehicle Procurement and Upgrade Industry Revenue Million Forecast, by Country 2019 & 2032
- Table 25: Armored Vehicle Procurement and Upgrade Industry Revenue (Million) Forecast, by Application 2019 & 2032
- Table 26: Global Armored Vehicle Procurement and Upgrade Industry Revenue Million Forecast, by Country 2019 & 2032
- Table 27: Saudi Arabia Armored Vehicle Procurement and Upgrade Industry Revenue (Million) Forecast, by Application 2019 & 2032
- Table 28: Turkey Armored Vehicle Procurement and Upgrade Industry Revenue (Million) Forecast, by Application 2019 & 2032
- Table 29: South Africa Armored Vehicle Procurement and Upgrade Industry Revenue (Million) Forecast, by Application 2019 & 2032
- Table 30: Rest of Middle East and Africa Armored Vehicle Procurement and Upgrade Industry Revenue (Million) Forecast, by Application 2019 & 2032
- Table 31: Global Armored Vehicle Procurement and Upgrade Industry Revenue Million Forecast, by Vehicle Type 2019 & 2032
- Table 32: Global Armored Vehicle Procurement and Upgrade Industry Revenue Million Forecast, by Country 2019 & 2032
- Table 33: United States Armored Vehicle Procurement and Upgrade Industry Revenue (Million) Forecast, by Application 2019 & 2032
- Table 34: Canada Armored Vehicle Procurement and Upgrade Industry Revenue (Million) Forecast, by Application 2019 & 2032
- Table 35: Global Armored Vehicle Procurement and Upgrade Industry Revenue Million Forecast, by Vehicle Type 2019 & 2032
- Table 36: Global Armored Vehicle Procurement and Upgrade Industry Revenue Million Forecast, by Country 2019 & 2032
- Table 37: United Kingdom Armored Vehicle Procurement and Upgrade Industry Revenue (Million) Forecast, by Application 2019 & 2032
- Table 38: France Armored Vehicle Procurement and Upgrade Industry Revenue (Million) Forecast, by Application 2019 & 2032
- Table 39: Germany Armored Vehicle Procurement and Upgrade Industry Revenue (Million) Forecast, by Application 2019 & 2032
- Table 40: Russia Armored Vehicle Procurement and Upgrade Industry Revenue (Million) Forecast, by Application 2019 & 2032
- Table 41: Rest of Europe Armored Vehicle Procurement and Upgrade Industry Revenue (Million) Forecast, by Application 2019 & 2032
- Table 42: Global Armored Vehicle Procurement and Upgrade Industry Revenue Million Forecast, by Vehicle Type 2019 & 2032
- Table 43: Global Armored Vehicle Procurement and Upgrade Industry Revenue Million Forecast, by Country 2019 & 2032
- Table 44: China Armored Vehicle Procurement and Upgrade Industry Revenue (Million) Forecast, by Application 2019 & 2032
- Table 45: India Armored Vehicle Procurement and Upgrade Industry Revenue (Million) Forecast, by Application 2019 & 2032
- Table 46: Japan Armored Vehicle Procurement and Upgrade Industry Revenue (Million) Forecast, by Application 2019 & 2032
- Table 47: South Korea Armored Vehicle Procurement and Upgrade Industry Revenue (Million) Forecast, by Application 2019 & 2032
- Table 48: Australia Armored Vehicle Procurement and Upgrade Industry Revenue (Million) Forecast, by Application 2019 & 2032
- Table 49: Rest of Asia Pacific Armored Vehicle Procurement and Upgrade Industry Revenue (Million) Forecast, by Application 2019 & 2032
- Table 50: Global Armored Vehicle Procurement and Upgrade Industry Revenue Million Forecast, by Vehicle Type 2019 & 2032
- Table 51: Global Armored Vehicle Procurement and Upgrade Industry Revenue Million Forecast, by Country 2019 & 2032
- Table 52: Brazil Armored Vehicle Procurement and Upgrade Industry Revenue (Million) Forecast, by Application 2019 & 2032
- Table 53: Mexico Armored Vehicle Procurement and Upgrade Industry Revenue (Million) Forecast, by Application 2019 & 2032
- Table 54: Rest of Latin America Armored Vehicle Procurement and Upgrade Industry Revenue (Million) Forecast, by Application 2019 & 2032
- Table 55: Global Armored Vehicle Procurement and Upgrade Industry Revenue Million Forecast, by Vehicle Type 2019 & 2032
- Table 56: Global Armored Vehicle Procurement and Upgrade Industry Revenue Million Forecast, by Country 2019 & 2032
- Table 57: Global Armored Vehicle Procurement and Upgrade Industry Revenue Million Forecast, by Vehicle Type 2019 & 2032
- Table 58: Global Armored Vehicle Procurement and Upgrade Industry Revenue Million Forecast, by Country 2019 & 2032
- Table 59: Saudi Arabia Armored Vehicle Procurement and Upgrade Industry Revenue (Million) Forecast, by Application 2019 & 2032
- Table 60: Turkey Armored Vehicle Procurement and Upgrade Industry Revenue (Million) Forecast, by Application 2019 & 2032
- Table 61: South Africa Armored Vehicle Procurement and Upgrade Industry Revenue (Million) Forecast, by Application 2019 & 2032
- Table 62: Rest of Middle East and Africa Armored Vehicle Procurement and Upgrade Industry Revenue (Million) Forecast, by Application 2019 & 2032
Frequently Asked Questions
1. What is the projected Compound Annual Growth Rate (CAGR) of the Armored Vehicle Procurement and Upgrade Industry?
The projected CAGR is approximately 4.23%.
2. Which companies are prominent players in the Armored Vehicle Procurement and Upgrade Industry?
Key companies in the market include Textron Inc, RUAG International Holding Ltd, FNSS Savunma Sistemleri A Ş, THALES, Oshkosh Corporation, General Dynamics Corporation, Rheinmetall AG, Elbit Systems Ltd, The CMI Group Inc, BMC Otomotiv Sanayi ve Ticaret A Ş, KNDS N V, Streit Grou, IVECO S p A, BAE Systems plc.
3. What are the main segments of the Armored Vehicle Procurement and Upgrade Industry?
The market segments include Vehicle Type.
4. Can you provide details about the market size?
The market size is estimated to be USD 6.66 Million as of 2022.
5. What are some drivers contributing to market growth?
N/A
6. What are the notable trends driving market growth?
The Infantry Fighting Vehicle Segment to Dominate Market Share.
7. Are there any restraints impacting market growth?
N/A
8. Can you provide examples of recent developments in the market?
May 2023: Elbit Systems Ltd. was awarded a contract under the British Army's Project Vulcan to maintain and operate the Ground Manoeuvre Synthetic Trainer system (GMST), the Boxer armored vehicles, and Challenger 3 tanks. The contract includes a training management system with high-fidelity driver trainers and cabins for turret and armament variants.
9. What pricing options are available for accessing the report?
Pricing options include single-user, multi-user, and enterprise licenses priced at USD 4750, USD 5250, and USD 8750 respectively.
10. Is the market size provided in terms of value or volume?
The market size is provided in terms of value, measured in Million.
11. Are there any specific market keywords associated with the report?
Yes, the market keyword associated with the report is "Armored Vehicle Procurement and Upgrade Industry," which aids in identifying and referencing the specific market segment covered.
12. How do I determine which pricing option suits my needs best?
The pricing options vary based on user requirements and access needs. Individual users may opt for single-user licenses, while businesses requiring broader access may choose multi-user or enterprise licenses for cost-effective access to the report.
13. Are there any additional resources or data provided in the Armored Vehicle Procurement and Upgrade Industry report?
While the report offers comprehensive insights, it's advisable to review the specific contents or supplementary materials provided to ascertain if additional resources or data are available.
14. How can I stay updated on further developments or reports in the Armored Vehicle Procurement and Upgrade Industry?
To stay informed about further developments, trends, and reports in the Armored Vehicle Procurement and Upgrade Industry, consider subscribing to industry newsletters, following relevant companies and organizations, or regularly checking reputable industry news sources and publications.
Methodology
Step 1 - Identification of Relevant Samples Size from Population Database


Step 2 - Approaches for Defining Global Market Size (Value, Volume* & Price*)

Note*: In applicable scenarios
Step 3 - Data Sources
Primary Research
- Web Analytics
- Survey Reports
- Research Institute
- Latest Research Reports
- Opinion Leaders
Secondary Research
- Annual Reports
- White Paper
- Latest Press Release
- Industry Association
- Paid Database
- Investor Presentations

Step 4 - Data Triangulation
Involves using different sources of information in order to increase the validity of a study
These sources are likely to be stakeholders in a program - participants, other researchers, program staff, other community members, and so on.
Then we put all data in single framework & apply various statistical tools to find out the dynamic on the market.
During the analysis stage, feedback from the stakeholder groups would be compared to determine areas of agreement as well as areas of divergence


