
Key Insights
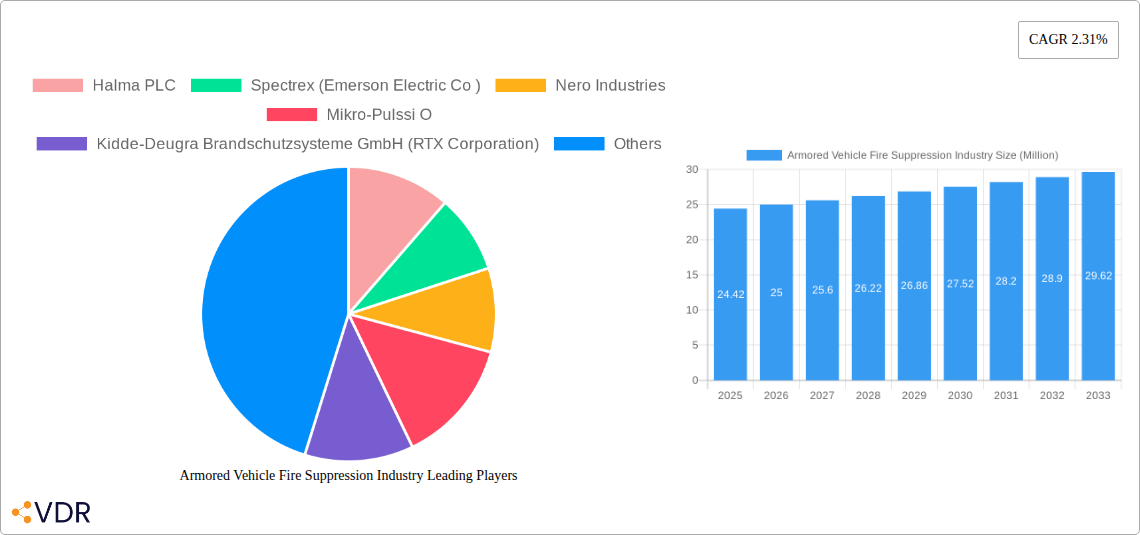
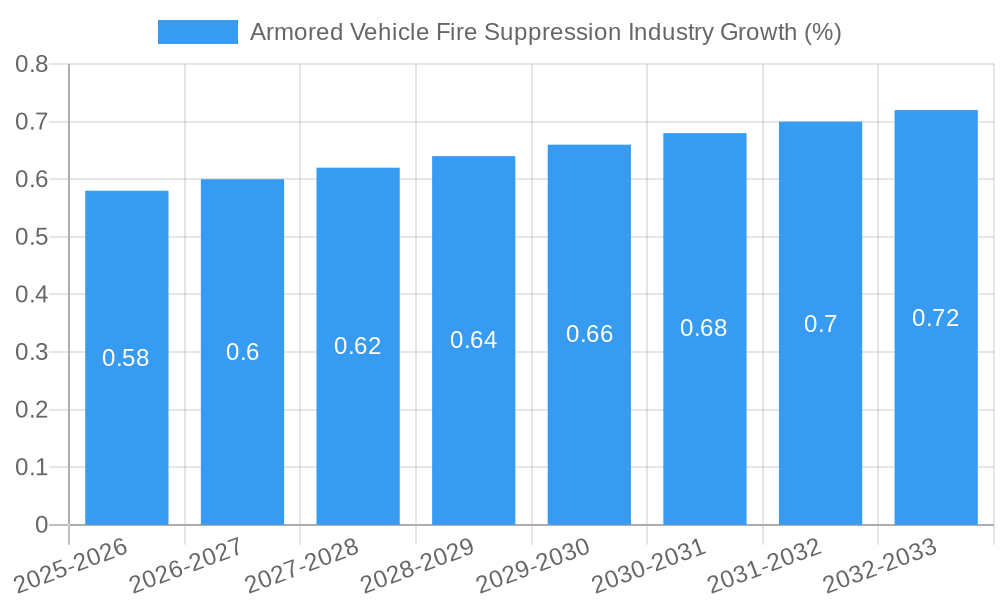
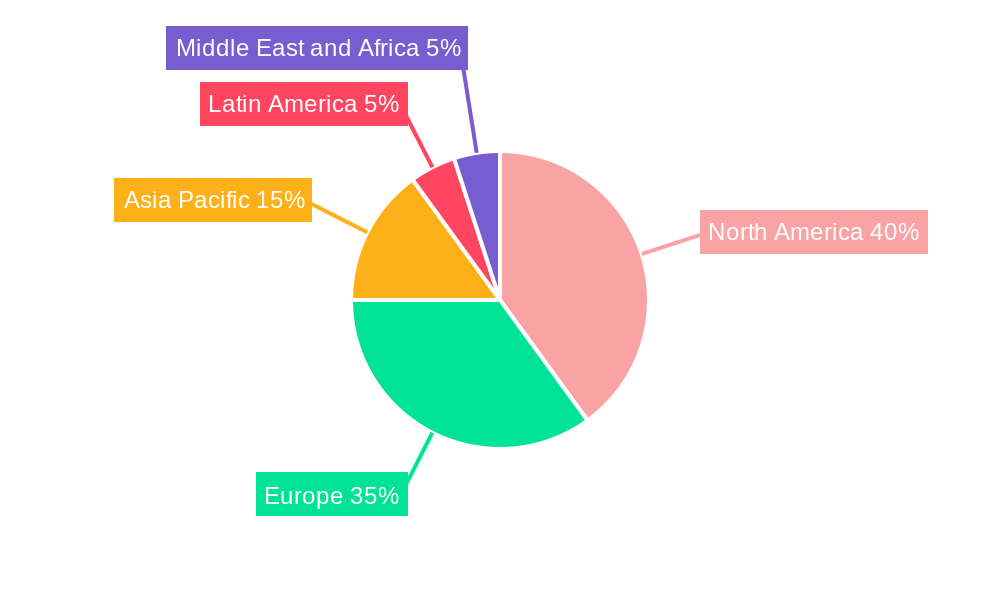
The Armored Vehicle Fire Suppression market, valued at $24.42 million in 2025, is projected to experience steady growth, driven by increasing demand for enhanced safety measures in military and defense applications. The Compound Annual Growth Rate (CAGR) of 2.31% from 2025 to 2033 reflects a consistent, albeit moderate, expansion. Key drivers include stringent safety regulations for armored vehicles, growing global military spending, and technological advancements leading to more sophisticated and effective fire suppression systems. Market segmentation reveals a significant share held by combat vehicles, followed by troop transport vehicles, with other vehicle types representing a smaller but growing segment. The increasing adoption of lightweight and advanced fire suppression technologies is a notable trend, while factors such as high initial investment costs and limited awareness in certain regions could act as market restraints. Major players like Halma PLC, Emerson Electric Co. (through Spectrex), and RTX Corporation (through Kidde-Deugra) are shaping the competitive landscape through product innovation and strategic partnerships. Regional analysis indicates significant market presence in North America and Europe, driven by high military expenditure and established defense industries. However, the Asia-Pacific region is expected to witness notable growth in the coming years due to increasing military modernization efforts in countries like India and China.
The forecast period (2025-2033) presents several opportunities for market participants. The focus is likely to shift towards integrated systems that combine fire suppression with other safety features, enhancing overall vehicle survivability. The development of environmentally friendly fire suppression agents will also gain traction. Competition will intensify as companies strive to differentiate their offerings through superior technology, enhanced performance, and cost-effective solutions. Companies will also invest in research and development for advanced systems to cater to the evolving needs of the defense industry. Long-term success will depend on adapting to emerging technologies and effectively addressing the challenges presented by stricter environmental regulations.
This comprehensive report provides an in-depth analysis of the Armored Vehicle Fire Suppression industry, encompassing market dynamics, growth trends, regional insights, product landscape, and key players. The study period covers 2019-2033, with 2025 as the base and estimated year. The forecast period extends from 2025-2033, and the historical period covers 2019-2024. The report segments the market by vehicle type: Combat Vehicles, Troop Transport Vehicles, and Other Vehicle Types. The global market size in 2025 is estimated at xx Million units.
Armored Vehicle Fire Suppression Industry Market Dynamics & Structure
The Armored Vehicle Fire Suppression industry is characterized by a moderately concentrated market structure, with key players holding significant market share. Halma PLC, Spectrex (Emerson Electric Co), and Kidde-Deugra Brandschutzsysteme GmbH (RTX Corporation) are among the leading players, collectively accounting for approximately xx% of the global market in 2025. Technological innovation, driven by the need for enhanced fire suppression capabilities and reduced environmental impact, is a key driver. Stringent safety regulations and evolving military standards significantly influence product development and adoption. Competitive pressures are substantial, with companies focusing on differentiation through technological advancements and superior performance metrics. The industry witnesses occasional mergers and acquisitions (M&A) activity, primarily focused on expanding product portfolios and geographical reach. An estimated xx M&A deals were recorded between 2019 and 2024.
- Market Concentration: Moderately concentrated, with top 3 players holding xx% market share in 2025.
- Technological Innovation: Driven by demand for advanced suppression systems and eco-friendly agents.
- Regulatory Landscape: Stringent safety standards and military specifications impact product design and adoption.
- Competitive Landscape: Intense competition based on technological superiority, performance, and cost-effectiveness.
- M&A Activity: Moderate activity observed, focused on expansion and diversification.
- Innovation Barriers: High R&D investment requirements, stringent testing and certification processes.
Armored Vehicle Fire Suppression Industry Growth Trends & Insights
The Armored Vehicle Fire Suppression market is experiencing robust growth, fueled by increasing demand for armored vehicles globally and heightened focus on personnel and equipment safety. The market size exhibited a CAGR of xx% during the historical period (2019-2024) and is projected to maintain a CAGR of xx% during the forecast period (2025-2033). This growth is attributed to several factors, including rising geopolitical instability, increased military spending, and technological advancements leading to the development of more efficient and effective fire suppression systems. Market penetration is gradually increasing, particularly in developing economies experiencing rapid military modernization. Technological disruptions, such as the integration of smart sensors and advanced control systems, are further enhancing system effectiveness and user experience. Consumer behavior shifts are witnessing a greater emphasis on proactive safety measures and integrated fire suppression solutions.
Dominant Regions, Countries, or Segments in Armored Vehicle Fire Suppression Industry
North America currently dominates the Armored Vehicle Fire Suppression market, driven by high military spending and a robust defense industry. The region holds approximately xx% of the global market share in 2025. Within North America, the United States is the largest market due to its substantial military investments in advanced defense technologies. The Combat Vehicle segment holds the largest share (xx%) within the overall market due to stringent safety requirements for these critical assets.
- Key Drivers in North America: High defense expenditure, advanced technological infrastructure, strong presence of key industry players.
- Combat Vehicle Segment Dominance: Stringent safety regulations, high value of assets necessitate robust fire suppression.
- Growth Potential: Emerging economies in Asia-Pacific and Middle East show significant growth potential, driven by increased military modernization programs.
Armored Vehicle Fire Suppression Industry Product Landscape
The Armored Vehicle Fire Suppression industry offers a range of products, from traditional chemical-based systems to advanced, environmentally friendly solutions. Innovations focus on improving suppression efficiency, reducing agent toxicity, and enhancing system reliability. Key advancements include the incorporation of automatic detection and suppression systems, lightweight and compact designs, and integrated fire control panels. Unique selling propositions often center on superior performance, ease of installation and maintenance, and compliance with stringent regulatory standards.
Key Drivers, Barriers & Challenges in Armored Vehicle Fire Suppression Industry
Key Drivers:
- Increased military spending globally.
- Rising demand for armored vehicles.
- Growing emphasis on personnel and equipment safety.
- Technological advancements in fire suppression technology.
Challenges & Restraints:
- High initial investment costs associated with advanced systems.
- Stringent regulatory approvals and certification processes can delay product launches.
- Supply chain disruptions and raw material price fluctuations can impact manufacturing costs.
- Intense competition from established and emerging players. This competitive pressure puts downward pressure on pricing and profit margins.
Emerging Opportunities in Armored Vehicle Fire Suppression Industry
Untapped markets in developing economies, particularly in regions with growing military modernization programs, offer significant growth potential. The integration of fire suppression systems with broader vehicle management and control systems presents exciting opportunities for technological innovation and value-added services. The development of environmentally friendly and sustainable fire suppression agents is becoming increasingly important.
Growth Accelerators in the Armored Vehicle Fire Suppression Industry
Strategic partnerships between fire suppression system manufacturers and armored vehicle producers will foster innovation and market penetration. Technological breakthroughs, such as the development of more effective and efficient extinguishing agents, will further drive market expansion. Market expansion initiatives, including targeted marketing campaigns and international collaborations, will be essential for achieving long-term growth.
Key Players Shaping the Armored Vehicle Fire Suppression Market
- Halma PLC
- Spectrex (Emerson Electric Co)
- Nero Industries
- Mikro-Pulssi O
- Kidde-Deugra Brandschutzsysteme GmbH (RTX Corporation)
- N2 Towers Inc
- Bulldog Direct Protective Systems Inc
- ExploSpot Systems (Pty) Ltd
- Fire Protection Technologies Pty Ltd
- Marotta Controls Inc
Notable Milestones in Armored Vehicle Fire Suppression Industry Sector
- 2020: Introduction of a new generation of lightweight, high-performance fire suppression systems by Kidde-Deugra.
- 2022: Halma PLC acquires a smaller fire suppression technology company, expanding its product portfolio.
- 2023: Several key players announce strategic partnerships to develop integrated fire detection and suppression solutions for armored vehicles.
- 2024: Release of a new environmentally friendly fire suppression agent by Spectrex.
In-Depth Armored Vehicle Fire Suppression Industry Market Outlook
The Armored Vehicle Fire Suppression market is poised for sustained growth, driven by ongoing military modernization efforts and increasing emphasis on personnel and equipment protection. Strategic partnerships, technological advancements, and market expansion initiatives will continue to drive market expansion. The focus on developing more effective, sustainable, and user-friendly solutions will shape future market trends. The market is expected to reach xx Million units by 2033.
Armored Vehicle Fire Suppression Industry Segmentation
-
1. Vehicle Type
- 1.1. Combat Vehicles
- 1.2. Troop Transport Vehicles
- 1.3. Other Vehicle Types
Armored Vehicle Fire Suppression Industry Segmentation By Geography
-
1. North America
- 1.1. United States
- 1.2. Canada
-
2. Europe
- 2.1. United Kingdom
- 2.2. Germany
- 2.3. France
- 2.4. Russia
- 2.5. Rest of Europe
-
3. Asia Pacific
- 3.1. China
- 3.2. India
- 3.3. Japan
- 3.4. South Korea
- 3.5. Rest of Asia Pacific
-
4. Latin America
- 4.1. Brazil
- 4.2. Rest of Latin America
-
5. Middle East and Africa
- 5.1. United Arab Emirates
- 5.2. Saudi Arabia
- 5.3. Turkey
- 5.4. Egypt
- 5.5. Rest of Middle East and Africa
Armored Vehicle Fire Suppression Industry REPORT HIGHLIGHTS
| Aspects | Details |
|---|---|
| Study Period | 2019-2033 |
| Base Year | 2024 |
| Estimated Year | 2025 |
| Forecast Period | 2025-2033 |
| Historical Period | 2019-2024 |
| Growth Rate | CAGR of 2.31% from 2019-2033 |
| Segmentation |
|
Table of Contents
- 1. Introduction
- 1.1. Research Scope
- 1.2. Market Segmentation
- 1.3. Research Methodology
- 1.4. Definitions and Assumptions
- 2. Executive Summary
- 2.1. Introduction
- 3. Market Dynamics
- 3.1. Introduction
- 3.2. Market Drivers
- 3.3. Market Restrains
- 3.4. Market Trends
- 3.4.1. Combat Vehicles to Witness Highest Growth During the Forecast Period
- 4. Market Factor Analysis
- 4.1. Porters Five Forces
- 4.2. Supply/Value Chain
- 4.3. PESTEL analysis
- 4.4. Market Entropy
- 4.5. Patent/Trademark Analysis
- 5. Global Armored Vehicle Fire Suppression Industry Analysis, Insights and Forecast, 2019-2031
- 5.1. Market Analysis, Insights and Forecast - by Vehicle Type
- 5.1.1. Combat Vehicles
- 5.1.2. Troop Transport Vehicles
- 5.1.3. Other Vehicle Types
- 5.2. Market Analysis, Insights and Forecast - by Region
- 5.2.1. North America
- 5.2.2. Europe
- 5.2.3. Asia Pacific
- 5.2.4. Latin America
- 5.2.5. Middle East and Africa
- 5.1. Market Analysis, Insights and Forecast - by Vehicle Type
- 6. North America Armored Vehicle Fire Suppression Industry Analysis, Insights and Forecast, 2019-2031
- 6.1. Market Analysis, Insights and Forecast - by Vehicle Type
- 6.1.1. Combat Vehicles
- 6.1.2. Troop Transport Vehicles
- 6.1.3. Other Vehicle Types
- 6.1. Market Analysis, Insights and Forecast - by Vehicle Type
- 7. Europe Armored Vehicle Fire Suppression Industry Analysis, Insights and Forecast, 2019-2031
- 7.1. Market Analysis, Insights and Forecast - by Vehicle Type
- 7.1.1. Combat Vehicles
- 7.1.2. Troop Transport Vehicles
- 7.1.3. Other Vehicle Types
- 7.1. Market Analysis, Insights and Forecast - by Vehicle Type
- 8. Asia Pacific Armored Vehicle Fire Suppression Industry Analysis, Insights and Forecast, 2019-2031
- 8.1. Market Analysis, Insights and Forecast - by Vehicle Type
- 8.1.1. Combat Vehicles
- 8.1.2. Troop Transport Vehicles
- 8.1.3. Other Vehicle Types
- 8.1. Market Analysis, Insights and Forecast - by Vehicle Type
- 9. Latin America Armored Vehicle Fire Suppression Industry Analysis, Insights and Forecast, 2019-2031
- 9.1. Market Analysis, Insights and Forecast - by Vehicle Type
- 9.1.1. Combat Vehicles
- 9.1.2. Troop Transport Vehicles
- 9.1.3. Other Vehicle Types
- 9.1. Market Analysis, Insights and Forecast - by Vehicle Type
- 10. Middle East and Africa Armored Vehicle Fire Suppression Industry Analysis, Insights and Forecast, 2019-2031
- 10.1. Market Analysis, Insights and Forecast - by Vehicle Type
- 10.1.1. Combat Vehicles
- 10.1.2. Troop Transport Vehicles
- 10.1.3. Other Vehicle Types
- 10.1. Market Analysis, Insights and Forecast - by Vehicle Type
- 11. North America Armored Vehicle Fire Suppression Industry Analysis, Insights and Forecast, 2019-2031
- 11.1. Market Analysis, Insights and Forecast - By Country/Sub-region
- 11.1.1 United States
- 11.1.2 Canada
- 12. Europe Armored Vehicle Fire Suppression Industry Analysis, Insights and Forecast, 2019-2031
- 12.1. Market Analysis, Insights and Forecast - By Country/Sub-region
- 12.1.1 United Kingdom
- 12.1.2 Germany
- 12.1.3 France
- 12.1.4 Russia
- 12.1.5 Rest of Europe
- 13. Asia Pacific Armored Vehicle Fire Suppression Industry Analysis, Insights and Forecast, 2019-2031
- 13.1. Market Analysis, Insights and Forecast - By Country/Sub-region
- 13.1.1 China
- 13.1.2 India
- 13.1.3 Japan
- 13.1.4 South Korea
- 13.1.5 Rest of Asia Pacific
- 14. Latin America Armored Vehicle Fire Suppression Industry Analysis, Insights and Forecast, 2019-2031
- 14.1. Market Analysis, Insights and Forecast - By Country/Sub-region
- 14.1.1 Brazil
- 14.1.2 Rest of Latin America
- 15. Middle East and Africa Armored Vehicle Fire Suppression Industry Analysis, Insights and Forecast, 2019-2031
- 15.1. Market Analysis, Insights and Forecast - By Country/Sub-region
- 15.1.1 United Arab Emirates
- 15.1.2 Saudi Arabia
- 15.1.3 Turkey
- 15.1.4 Egypt
- 15.1.5 Rest of Middle East and Africa
- 16. Competitive Analysis
- 16.1. Global Market Share Analysis 2024
- 16.2. Company Profiles
- 16.2.1 Halma PLC
- 16.2.1.1. Overview
- 16.2.1.2. Products
- 16.2.1.3. SWOT Analysis
- 16.2.1.4. Recent Developments
- 16.2.1.5. Financials (Based on Availability)
- 16.2.2 Spectrex (Emerson Electric Co )
- 16.2.2.1. Overview
- 16.2.2.2. Products
- 16.2.2.3. SWOT Analysis
- 16.2.2.4. Recent Developments
- 16.2.2.5. Financials (Based on Availability)
- 16.2.3 Nero Industries
- 16.2.3.1. Overview
- 16.2.3.2. Products
- 16.2.3.3. SWOT Analysis
- 16.2.3.4. Recent Developments
- 16.2.3.5. Financials (Based on Availability)
- 16.2.4 Mikro-Pulssi O
- 16.2.4.1. Overview
- 16.2.4.2. Products
- 16.2.4.3. SWOT Analysis
- 16.2.4.4. Recent Developments
- 16.2.4.5. Financials (Based on Availability)
- 16.2.5 Kidde-Deugra Brandschutzsysteme GmbH (RTX Corporation)
- 16.2.5.1. Overview
- 16.2.5.2. Products
- 16.2.5.3. SWOT Analysis
- 16.2.5.4. Recent Developments
- 16.2.5.5. Financials (Based on Availability)
- 16.2.6 N2 Towers Inc
- 16.2.6.1. Overview
- 16.2.6.2. Products
- 16.2.6.3. SWOT Analysis
- 16.2.6.4. Recent Developments
- 16.2.6.5. Financials (Based on Availability)
- 16.2.7 Bulldog Direct Protective Systems Inc
- 16.2.7.1. Overview
- 16.2.7.2. Products
- 16.2.7.3. SWOT Analysis
- 16.2.7.4. Recent Developments
- 16.2.7.5. Financials (Based on Availability)
- 16.2.8 ExploSpot Systems (Pty) Ltd
- 16.2.8.1. Overview
- 16.2.8.2. Products
- 16.2.8.3. SWOT Analysis
- 16.2.8.4. Recent Developments
- 16.2.8.5. Financials (Based on Availability)
- 16.2.9 Fire Protection Technologies Pty Ltd
- 16.2.9.1. Overview
- 16.2.9.2. Products
- 16.2.9.3. SWOT Analysis
- 16.2.9.4. Recent Developments
- 16.2.9.5. Financials (Based on Availability)
- 16.2.10 Marotta Controls Inc
- 16.2.10.1. Overview
- 16.2.10.2. Products
- 16.2.10.3. SWOT Analysis
- 16.2.10.4. Recent Developments
- 16.2.10.5. Financials (Based on Availability)
- 16.2.1 Halma PLC
List of Figures
- Figure 1: Global Armored Vehicle Fire Suppression Industry Revenue Breakdown (Million, %) by Region 2024 & 2032
- Figure 2: North America Armored Vehicle Fire Suppression Industry Revenue (Million), by Country 2024 & 2032
- Figure 3: North America Armored Vehicle Fire Suppression Industry Revenue Share (%), by Country 2024 & 2032
- Figure 4: Europe Armored Vehicle Fire Suppression Industry Revenue (Million), by Country 2024 & 2032
- Figure 5: Europe Armored Vehicle Fire Suppression Industry Revenue Share (%), by Country 2024 & 2032
- Figure 6: Asia Pacific Armored Vehicle Fire Suppression Industry Revenue (Million), by Country 2024 & 2032
- Figure 7: Asia Pacific Armored Vehicle Fire Suppression Industry Revenue Share (%), by Country 2024 & 2032
- Figure 8: Latin America Armored Vehicle Fire Suppression Industry Revenue (Million), by Country 2024 & 2032
- Figure 9: Latin America Armored Vehicle Fire Suppression Industry Revenue Share (%), by Country 2024 & 2032
- Figure 10: Middle East and Africa Armored Vehicle Fire Suppression Industry Revenue (Million), by Country 2024 & 2032
- Figure 11: Middle East and Africa Armored Vehicle Fire Suppression Industry Revenue Share (%), by Country 2024 & 2032
- Figure 12: North America Armored Vehicle Fire Suppression Industry Revenue (Million), by Vehicle Type 2024 & 2032
- Figure 13: North America Armored Vehicle Fire Suppression Industry Revenue Share (%), by Vehicle Type 2024 & 2032
- Figure 14: North America Armored Vehicle Fire Suppression Industry Revenue (Million), by Country 2024 & 2032
- Figure 15: North America Armored Vehicle Fire Suppression Industry Revenue Share (%), by Country 2024 & 2032
- Figure 16: Europe Armored Vehicle Fire Suppression Industry Revenue (Million), by Vehicle Type 2024 & 2032
- Figure 17: Europe Armored Vehicle Fire Suppression Industry Revenue Share (%), by Vehicle Type 2024 & 2032
- Figure 18: Europe Armored Vehicle Fire Suppression Industry Revenue (Million), by Country 2024 & 2032
- Figure 19: Europe Armored Vehicle Fire Suppression Industry Revenue Share (%), by Country 2024 & 2032
- Figure 20: Asia Pacific Armored Vehicle Fire Suppression Industry Revenue (Million), by Vehicle Type 2024 & 2032
- Figure 21: Asia Pacific Armored Vehicle Fire Suppression Industry Revenue Share (%), by Vehicle Type 2024 & 2032
- Figure 22: Asia Pacific Armored Vehicle Fire Suppression Industry Revenue (Million), by Country 2024 & 2032
- Figure 23: Asia Pacific Armored Vehicle Fire Suppression Industry Revenue Share (%), by Country 2024 & 2032
- Figure 24: Latin America Armored Vehicle Fire Suppression Industry Revenue (Million), by Vehicle Type 2024 & 2032
- Figure 25: Latin America Armored Vehicle Fire Suppression Industry Revenue Share (%), by Vehicle Type 2024 & 2032
- Figure 26: Latin America Armored Vehicle Fire Suppression Industry Revenue (Million), by Country 2024 & 2032
- Figure 27: Latin America Armored Vehicle Fire Suppression Industry Revenue Share (%), by Country 2024 & 2032
- Figure 28: Middle East and Africa Armored Vehicle Fire Suppression Industry Revenue (Million), by Vehicle Type 2024 & 2032
- Figure 29: Middle East and Africa Armored Vehicle Fire Suppression Industry Revenue Share (%), by Vehicle Type 2024 & 2032
- Figure 30: Middle East and Africa Armored Vehicle Fire Suppression Industry Revenue (Million), by Country 2024 & 2032
- Figure 31: Middle East and Africa Armored Vehicle Fire Suppression Industry Revenue Share (%), by Country 2024 & 2032
List of Tables
- Table 1: Global Armored Vehicle Fire Suppression Industry Revenue Million Forecast, by Region 2019 & 2032
- Table 2: Global Armored Vehicle Fire Suppression Industry Revenue Million Forecast, by Vehicle Type 2019 & 2032
- Table 3: Global Armored Vehicle Fire Suppression Industry Revenue Million Forecast, by Region 2019 & 2032
- Table 4: Global Armored Vehicle Fire Suppression Industry Revenue Million Forecast, by Country 2019 & 2032
- Table 5: United States Armored Vehicle Fire Suppression Industry Revenue (Million) Forecast, by Application 2019 & 2032
- Table 6: Canada Armored Vehicle Fire Suppression Industry Revenue (Million) Forecast, by Application 2019 & 2032
- Table 7: Global Armored Vehicle Fire Suppression Industry Revenue Million Forecast, by Country 2019 & 2032
- Table 8: United Kingdom Armored Vehicle Fire Suppression Industry Revenue (Million) Forecast, by Application 2019 & 2032
- Table 9: Germany Armored Vehicle Fire Suppression Industry Revenue (Million) Forecast, by Application 2019 & 2032
- Table 10: France Armored Vehicle Fire Suppression Industry Revenue (Million) Forecast, by Application 2019 & 2032
- Table 11: Russia Armored Vehicle Fire Suppression Industry Revenue (Million) Forecast, by Application 2019 & 2032
- Table 12: Rest of Europe Armored Vehicle Fire Suppression Industry Revenue (Million) Forecast, by Application 2019 & 2032
- Table 13: Global Armored Vehicle Fire Suppression Industry Revenue Million Forecast, by Country 2019 & 2032
- Table 14: China Armored Vehicle Fire Suppression Industry Revenue (Million) Forecast, by Application 2019 & 2032
- Table 15: India Armored Vehicle Fire Suppression Industry Revenue (Million) Forecast, by Application 2019 & 2032
- Table 16: Japan Armored Vehicle Fire Suppression Industry Revenue (Million) Forecast, by Application 2019 & 2032
- Table 17: South Korea Armored Vehicle Fire Suppression Industry Revenue (Million) Forecast, by Application 2019 & 2032
- Table 18: Rest of Asia Pacific Armored Vehicle Fire Suppression Industry Revenue (Million) Forecast, by Application 2019 & 2032
- Table 19: Global Armored Vehicle Fire Suppression Industry Revenue Million Forecast, by Country 2019 & 2032
- Table 20: Brazil Armored Vehicle Fire Suppression Industry Revenue (Million) Forecast, by Application 2019 & 2032
- Table 21: Rest of Latin America Armored Vehicle Fire Suppression Industry Revenue (Million) Forecast, by Application 2019 & 2032
- Table 22: Global Armored Vehicle Fire Suppression Industry Revenue Million Forecast, by Country 2019 & 2032
- Table 23: United Arab Emirates Armored Vehicle Fire Suppression Industry Revenue (Million) Forecast, by Application 2019 & 2032
- Table 24: Saudi Arabia Armored Vehicle Fire Suppression Industry Revenue (Million) Forecast, by Application 2019 & 2032
- Table 25: Turkey Armored Vehicle Fire Suppression Industry Revenue (Million) Forecast, by Application 2019 & 2032
- Table 26: Egypt Armored Vehicle Fire Suppression Industry Revenue (Million) Forecast, by Application 2019 & 2032
- Table 27: Rest of Middle East and Africa Armored Vehicle Fire Suppression Industry Revenue (Million) Forecast, by Application 2019 & 2032
- Table 28: Global Armored Vehicle Fire Suppression Industry Revenue Million Forecast, by Vehicle Type 2019 & 2032
- Table 29: Global Armored Vehicle Fire Suppression Industry Revenue Million Forecast, by Country 2019 & 2032
- Table 30: United States Armored Vehicle Fire Suppression Industry Revenue (Million) Forecast, by Application 2019 & 2032
- Table 31: Canada Armored Vehicle Fire Suppression Industry Revenue (Million) Forecast, by Application 2019 & 2032
- Table 32: Global Armored Vehicle Fire Suppression Industry Revenue Million Forecast, by Vehicle Type 2019 & 2032
- Table 33: Global Armored Vehicle Fire Suppression Industry Revenue Million Forecast, by Country 2019 & 2032
- Table 34: United Kingdom Armored Vehicle Fire Suppression Industry Revenue (Million) Forecast, by Application 2019 & 2032
- Table 35: Germany Armored Vehicle Fire Suppression Industry Revenue (Million) Forecast, by Application 2019 & 2032
- Table 36: France Armored Vehicle Fire Suppression Industry Revenue (Million) Forecast, by Application 2019 & 2032
- Table 37: Russia Armored Vehicle Fire Suppression Industry Revenue (Million) Forecast, by Application 2019 & 2032
- Table 38: Rest of Europe Armored Vehicle Fire Suppression Industry Revenue (Million) Forecast, by Application 2019 & 2032
- Table 39: Global Armored Vehicle Fire Suppression Industry Revenue Million Forecast, by Vehicle Type 2019 & 2032
- Table 40: Global Armored Vehicle Fire Suppression Industry Revenue Million Forecast, by Country 2019 & 2032
- Table 41: China Armored Vehicle Fire Suppression Industry Revenue (Million) Forecast, by Application 2019 & 2032
- Table 42: India Armored Vehicle Fire Suppression Industry Revenue (Million) Forecast, by Application 2019 & 2032
- Table 43: Japan Armored Vehicle Fire Suppression Industry Revenue (Million) Forecast, by Application 2019 & 2032
- Table 44: South Korea Armored Vehicle Fire Suppression Industry Revenue (Million) Forecast, by Application 2019 & 2032
- Table 45: Rest of Asia Pacific Armored Vehicle Fire Suppression Industry Revenue (Million) Forecast, by Application 2019 & 2032
- Table 46: Global Armored Vehicle Fire Suppression Industry Revenue Million Forecast, by Vehicle Type 2019 & 2032
- Table 47: Global Armored Vehicle Fire Suppression Industry Revenue Million Forecast, by Country 2019 & 2032
- Table 48: Brazil Armored Vehicle Fire Suppression Industry Revenue (Million) Forecast, by Application 2019 & 2032
- Table 49: Rest of Latin America Armored Vehicle Fire Suppression Industry Revenue (Million) Forecast, by Application 2019 & 2032
- Table 50: Global Armored Vehicle Fire Suppression Industry Revenue Million Forecast, by Vehicle Type 2019 & 2032
- Table 51: Global Armored Vehicle Fire Suppression Industry Revenue Million Forecast, by Country 2019 & 2032
- Table 52: United Arab Emirates Armored Vehicle Fire Suppression Industry Revenue (Million) Forecast, by Application 2019 & 2032
- Table 53: Saudi Arabia Armored Vehicle Fire Suppression Industry Revenue (Million) Forecast, by Application 2019 & 2032
- Table 54: Turkey Armored Vehicle Fire Suppression Industry Revenue (Million) Forecast, by Application 2019 & 2032
- Table 55: Egypt Armored Vehicle Fire Suppression Industry Revenue (Million) Forecast, by Application 2019 & 2032
- Table 56: Rest of Middle East and Africa Armored Vehicle Fire Suppression Industry Revenue (Million) Forecast, by Application 2019 & 2032
Frequently Asked Questions
1. What is the projected Compound Annual Growth Rate (CAGR) of the Armored Vehicle Fire Suppression Industry?
The projected CAGR is approximately 2.31%.
2. Which companies are prominent players in the Armored Vehicle Fire Suppression Industry?
Key companies in the market include Halma PLC, Spectrex (Emerson Electric Co ), Nero Industries, Mikro-Pulssi O, Kidde-Deugra Brandschutzsysteme GmbH (RTX Corporation), N2 Towers Inc, Bulldog Direct Protective Systems Inc, ExploSpot Systems (Pty) Ltd, Fire Protection Technologies Pty Ltd, Marotta Controls Inc.
3. What are the main segments of the Armored Vehicle Fire Suppression Industry?
The market segments include Vehicle Type.
4. Can you provide details about the market size?
The market size is estimated to be USD 24.42 Million as of 2022.
5. What are some drivers contributing to market growth?
N/A
6. What are the notable trends driving market growth?
Combat Vehicles to Witness Highest Growth During the Forecast Period.
7. Are there any restraints impacting market growth?
N/A
8. Can you provide examples of recent developments in the market?
N/A
9. What pricing options are available for accessing the report?
Pricing options include single-user, multi-user, and enterprise licenses priced at USD 4750, USD 5250, and USD 8750 respectively.
10. Is the market size provided in terms of value or volume?
The market size is provided in terms of value, measured in Million.
11. Are there any specific market keywords associated with the report?
Yes, the market keyword associated with the report is "Armored Vehicle Fire Suppression Industry," which aids in identifying and referencing the specific market segment covered.
12. How do I determine which pricing option suits my needs best?
The pricing options vary based on user requirements and access needs. Individual users may opt for single-user licenses, while businesses requiring broader access may choose multi-user or enterprise licenses for cost-effective access to the report.
13. Are there any additional resources or data provided in the Armored Vehicle Fire Suppression Industry report?
While the report offers comprehensive insights, it's advisable to review the specific contents or supplementary materials provided to ascertain if additional resources or data are available.
14. How can I stay updated on further developments or reports in the Armored Vehicle Fire Suppression Industry?
To stay informed about further developments, trends, and reports in the Armored Vehicle Fire Suppression Industry, consider subscribing to industry newsletters, following relevant companies and organizations, or regularly checking reputable industry news sources and publications.
Methodology
Step 1 - Identification of Relevant Samples Size from Population Database


Step 2 - Approaches for Defining Global Market Size (Value, Volume* & Price*)

Note*: In applicable scenarios
Step 3 - Data Sources
Primary Research
- Web Analytics
- Survey Reports
- Research Institute
- Latest Research Reports
- Opinion Leaders
Secondary Research
- Annual Reports
- White Paper
- Latest Press Release
- Industry Association
- Paid Database
- Investor Presentations

Step 4 - Data Triangulation
Involves using different sources of information in order to increase the validity of a study
These sources are likely to be stakeholders in a program - participants, other researchers, program staff, other community members, and so on.
Then we put all data in single framework & apply various statistical tools to find out the dynamic on the market.
During the analysis stage, feedback from the stakeholder groups would be compared to determine areas of agreement as well as areas of divergence


