

Key Insights
The Asia-Pacific (APAC) probiotic market is experiencing substantial expansion, fueled by escalating health awareness, rising disposable incomes, and a pronounced consumer shift towards natural and functional foods. The region's demographic diversity and varied dietary patterns create significant opportunities for targeted probiotic product innovation and strategic marketing. Key growth catalysts include the increasing incidence of digestive ailments, heightened understanding of the critical role of gut health in overall well-being, and the expanding availability of probiotic-fortified foods and supplements. The APAC probiotic market is projected to reach approximately $86.01 billion by 2025, with a compound annual growth rate (CAGR) of 10.7%.
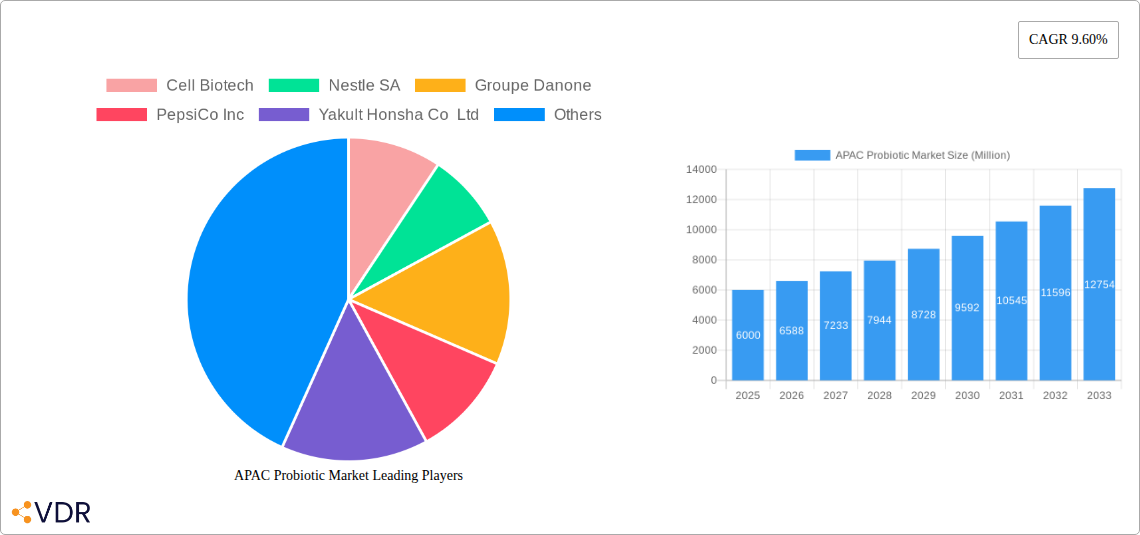
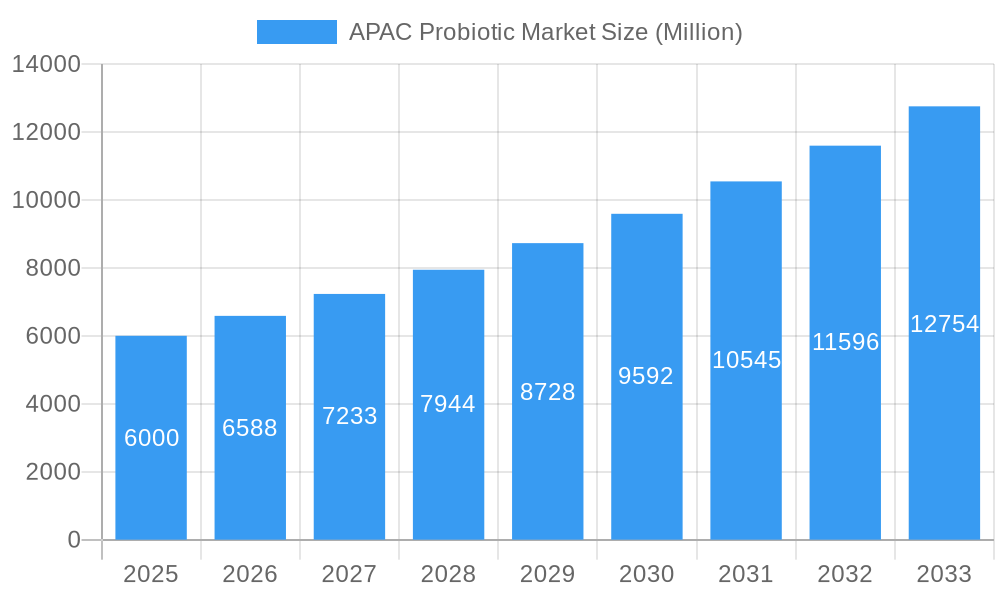
APAC Probiotic Market Market Size (In Billion)
Market expansion within APAC is further delineated by product categories, encompassing probiotic foods (both dairy and non-dairy) and dietary supplements, as well as distribution channels, including supermarkets, convenience stores, pharmacies, and online retail. The dairy-based probiotic beverage segment is anticipated to sustain robust growth, supported by established consumer habits and the seamless integration of probiotics into daily diets. Concurrently, the burgeoning demand for plant-based alternatives presents a significant growth avenue for non-dairy probiotic offerings. Online retail channels are also poised for considerable growth, propelled by increasing digital connectivity and the convenience of e-commerce. Despite existing regulatory considerations and varying levels of consumer education across APAC, the market outlook remains highly favorable, signaling considerable expansion potential.
APAC Probiotic Market Company Market Share
APAC Probiotic Market: A Comprehensive Market Report (2019-2033)
This comprehensive report provides a detailed analysis of the Asia-Pacific (APAC) probiotic market, encompassing market dynamics, growth trends, key players, and future outlook. The study period covers 2019-2033, with 2025 as the base and estimated year. This report is invaluable for industry professionals, investors, and stakeholders seeking to understand and capitalize on opportunities within this rapidly expanding market. The market is segmented by Type (Probiotic Foods, Other Probiotic Foods including Probiotic Drinks and Dairy-based Probiotic Drinks, Dietary Supplements) and Distribution Channel (Supermarkets/Hypermarkets, Convenience Stores, Pharmacies and Drug Stores, Online Retail Stores, Other Distribution Channels). The total market size is expected to reach xx Million units by 2033.
APAC Probiotic Market Dynamics & Structure
The APAC probiotic market is characterized by a moderately concentrated landscape with several multinational corporations and regional players competing for market share. Technological innovation, particularly in delivery systems and strain development, is a key driver. Stringent regulatory frameworks across different APAC nations influence product development and market access. The market faces competition from alternative health and wellness products. The increasing health-conscious population, particularly in urban centers, fuels demand. M&A activity has been moderate, with strategic acquisitions aimed at expanding product portfolios and market reach.
- Market Concentration: Moderately concentrated, with top 5 players holding xx% market share (2024).
- Technological Innovation: Focus on targeted delivery systems (e.g., microencapsulation), novel strains with enhanced efficacy, and personalized probiotic solutions.
- Regulatory Landscape: Varied across countries, impacting product registration and labeling requirements.
- Competitive Substitutes: Functional foods, prebiotics, and other dietary supplements.
- End-User Demographics: Growing middle class, increasing health awareness, and rising disposable incomes in key APAC markets.
- M&A Activity: xx deals recorded between 2019-2024, primarily focused on acquiring smaller probiotic companies with specialized strains or distribution networks.
APAC Probiotic Market Growth Trends & Insights
The APAC probiotic market has witnessed substantial growth during the historical period (2019-2024), driven by factors such as increasing health consciousness, rising disposable incomes, and growing awareness of the gut-microbiome connection. The market is expected to continue its robust expansion throughout the forecast period (2025-2033), with a projected CAGR of xx%. This growth is fueled by the increasing demand for functional foods and dietary supplements, coupled with technological advancements resulting in more effective and convenient probiotic products. Consumer behavior is shifting towards preventative healthcare, boosting the adoption of probiotics for gut health, immunity, and overall wellness. Technological disruptions, such as personalized nutrition and improved strain identification, are shaping the market landscape. Market penetration of probiotics in various product categories is increasing steadily, driven by innovation and expanded product availability across different distribution channels.
Dominant Regions, Countries, or Segments in APAC Probiotic Market
China and Japan are currently leading the APAC probiotic market, driven by strong consumer demand, robust regulatory frameworks, and a significant presence of both domestic and international players. Within product segments, probiotic drinks (including dairy-based options) currently dominate, followed by dietary supplements. Supermarkets/hypermarkets and online retail stores are the major distribution channels.
Key Drivers:
- China: Rising disposable incomes, increasing health awareness, government support for functional foods.
- Japan: Long-standing tradition of probiotic consumption, advanced technological capabilities, strong domestic players.
- Probiotic Drinks: Convenience, taste appeal, and perceived efficacy.
- Supermarkets/Hypermarkets & Online Retail: Widespread accessibility and increasing e-commerce penetration.
Dominance Factors: Large population base, high disposable incomes, favorable regulatory environments, and extensive distribution networks.
APAC Probiotic Market Product Landscape
The APAC probiotic market showcases a diverse range of products, including various strains, delivery systems (e.g., capsules, powders, liquids), and formulations tailored to specific health needs. Innovation focuses on enhancing strain stability, improving bioavailability, and developing targeted products for specific demographics (e.g., children, elderly). Unique selling propositions often emphasize clinically proven benefits, specific strain efficacy, and superior delivery mechanisms. Technological advancements involve using advanced encapsulation techniques, prebiotic blends, and synbiotics to enhance product performance.
Key Drivers, Barriers & Challenges in APAC Probiotic Market
Key Drivers:
- Growing health consciousness among consumers.
- Rising disposable incomes, particularly in emerging economies.
- Increased awareness of gut health and its connection to overall well-being.
- Technological advancements leading to improved product efficacy and convenience.
- Government support for functional foods and the development of the health and wellness sector.
Key Challenges:
- Maintaining strain viability and stability throughout the product shelf life.
- Regulatory hurdles and varying standards across different APAC countries.
- Competition from other health and wellness products.
- Educating consumers about the benefits of probiotics and addressing misconceptions.
- Supply chain complexities, especially for sourcing high-quality strains and raw materials.
Emerging Opportunities in APAP Probiotic Market
- Untapped Markets: Expanding into rural areas and less developed regions within APAC.
- Innovative Applications: Developing probiotics for specific conditions (e.g., skin health, mental well-being).
- Evolving Consumer Preferences: Meeting demand for personalized nutrition and convenient formats (e.g., single-serve pouches).
- Functional Foods Integration: Incorporating probiotics into a broader range of food and beverage products.
Growth Accelerators in the APAC Probiotic Market Industry
Long-term growth will be fueled by continuous innovation in strain development, delivery systems, and product formulations. Strategic partnerships between probiotic manufacturers, food and beverage companies, and research institutions will drive market expansion. The increasing adoption of digital marketing and e-commerce will contribute to broader market reach and consumer engagement. Government initiatives promoting health and wellness will further stimulate market growth.
Key Players Shaping the APAC Probiotic Market Market
- Cell Biotech
- Nestle SA
- Groupe Danone
- PepsiCo Inc
- Yakult Honsha Co Ltd
- Amway Corp
- Danone SA
- Now Foods
- Bio-K Plus International
- Anand Milk Union Limited
Notable Milestones in APAC Probiotic Market Sector
- Sept 2022: Nestle Health Science's Garden of Life launched two new probiotic drinks in China targeting children's growth and immune health.
- Jan 2022: Mengniu's Youyi C launched probiotic solid drinks featuring Chinese patented bacteria strains.
- Mar 2021: COSTA launched a peach probiotic latte in collaboration with NZMP in China.
In-Depth APAC Probiotic Market Market Outlook
The APAC probiotic market is poised for continued strong growth, driven by increasing health awareness, expanding product offerings, and strategic partnerships. Opportunities lie in developing innovative products, expanding into untapped markets, and capitalizing on the growing demand for personalized nutrition solutions. Companies that effectively leverage technological advancements, build strong distribution networks, and establish robust branding strategies will be well-positioned to succeed in this dynamic market.
APAC Probiotic Market Segmentation
-
1. Type
-
1.1. Probiotic Foods
- 1.1.1. Yogurt
- 1.1.2. Bakery/Breakfast Cereals
- 1.1.3. Baby Food and Infant Formula
- 1.1.4. Other Probiotic Foods
-
1.2. Probiotic Drinks
- 1.2.1. Fruit-based Probiotic Drinks
- 1.2.2. Dairy-based Probiotic Drinks
- 1.3. Dietary Supplements
-
1.1. Probiotic Foods
-
2. Distribution Channel
- 2.1. Supermarkets/Hypermarkets
- 2.2. Convenience Stores
- 2.3. Pharmacies and Drug Stores
- 2.4. Online Retail Stores
- 2.5. Other Distribution Channels
-
3. Geography
- 3.1. China
- 3.2. Japan
- 3.3. India
- 3.4. South Korea
- 3.5. Australia
- 3.6. Rest of Asia-Pacific
APAC Probiotic Market Segmentation By Geography
- 1. China
- 2. Japan
- 3. India
- 4. South Korea
- 5. Australia
- 6. Rest of Asia Pacific
APAC Probiotic Market Regional Market Share
Geographic Coverage of APAC Probiotic Market
APAC Probiotic Market REPORT HIGHLIGHTS
| Aspects | Details |
|---|---|
| Study Period | 2020-2034 |
| Base Year | 2025 |
| Estimated Year | 2026 |
| Forecast Period | 2026-2034 |
| Historical Period | 2020-2025 |
| Growth Rate | CAGR of 10.7% from 2020-2034 |
| Segmentation |
|
Table of Contents
- 1. Introduction
- 1.1. Research Scope
- 1.2. Market Segmentation
- 1.3. Research Objective
- 1.4. Definitions and Assumptions
- 2. Executive Summary
- 2.1. Market Snapshot
- 3. Market Dynamics
- 3.1. Market Drivers
- 3.2. Market Restrains
- 3.3. Market Trends
- 3.4. Market Opportunities
- 4. Market Factor Analysis
- 4.1. Porters Five Forces
- 4.1.1. Bargaining Power of Suppliers
- 4.1.2. Bargaining Power of Buyers
- 4.1.3. Threat of New Entrants
- 4.1.4. Threat of Substitutes
- 4.1.5. Competitive Rivalry
- 4.2. PESTEL analysis
- 4.3. BCG Analysis
- 4.3.1. Stars (High Growth, High Market Share)
- 4.3.2. Cash Cows (Low Growth, High Market Share)
- 4.3.3. Question Mark (High Growth, Low Market Share)
- 4.3.4. Dogs (Low Growth, Low Market Share)
- 4.4. Ansoff Matrix Analysis
- 4.5. Supply Chain Analysis
- 4.6. Regulatory Landscape
- 4.7. Current Market Potential and Opportunity Assessment (TAM–SAM–SOM Framework)
- 4.8. VDR Analyst Note
- 4.1. Porters Five Forces
- 5. Market Analysis, Insights and Forecast 2021-2033
- 5.1. Market Analysis, Insights and Forecast - by Type
- 5.1.1. Probiotic Foods
- 5.1.1.1. Yogurt
- 5.1.1.2. Bakery/Breakfast Cereals
- 5.1.1.3. Baby Food and Infant Formula
- 5.1.1.4. Other Probiotic Foods
- 5.1.2. Probiotic Drinks
- 5.1.2.1. Fruit-based Probiotic Drinks
- 5.1.2.2. Dairy-based Probiotic Drinks
- 5.1.3. Dietary Supplements
- 5.1.1. Probiotic Foods
- 5.2. Market Analysis, Insights and Forecast - by Distribution Channel
- 5.2.1. Supermarkets/Hypermarkets
- 5.2.2. Convenience Stores
- 5.2.3. Pharmacies and Drug Stores
- 5.2.4. Online Retail Stores
- 5.2.5. Other Distribution Channels
- 5.3. Market Analysis, Insights and Forecast - by Geography
- 5.3.1. China
- 5.3.2. Japan
- 5.3.3. India
- 5.3.4. South Korea
- 5.3.5. Australia
- 5.3.6. Rest of Asia-Pacific
- 5.4. Market Analysis, Insights and Forecast - by Region
- 5.4.1. China
- 5.4.2. Japan
- 5.4.3. India
- 5.4.4. South Korea
- 5.4.5. Australia
- 5.4.6. Rest of Asia Pacific
- 5.1. Market Analysis, Insights and Forecast - by Type
- 6. Global APAC Probiotic Market Analysis, Insights and Forecast, 2021-2033
- 6.1. Market Analysis, Insights and Forecast - by Type
- 6.1.1. Probiotic Foods
- 6.1.1.1. Yogurt
- 6.1.1.2. Bakery/Breakfast Cereals
- 6.1.1.3. Baby Food and Infant Formula
- 6.1.1.4. Other Probiotic Foods
- 6.1.2. Probiotic Drinks
- 6.1.2.1. Fruit-based Probiotic Drinks
- 6.1.2.2. Dairy-based Probiotic Drinks
- 6.1.3. Dietary Supplements
- 6.1.1. Probiotic Foods
- 6.2. Market Analysis, Insights and Forecast - by Distribution Channel
- 6.2.1. Supermarkets/Hypermarkets
- 6.2.2. Convenience Stores
- 6.2.3. Pharmacies and Drug Stores
- 6.2.4. Online Retail Stores
- 6.2.5. Other Distribution Channels
- 6.3. Market Analysis, Insights and Forecast - by Geography
- 6.3.1. China
- 6.3.2. Japan
- 6.3.3. India
- 6.3.4. South Korea
- 6.3.5. Australia
- 6.3.6. Rest of Asia-Pacific
- 6.1. Market Analysis, Insights and Forecast - by Type
- 7. China APAC Probiotic Market Analysis, Insights and Forecast, 2021-2033
- 7.1. Market Analysis, Insights and Forecast - by Type
- 7.1.1. Probiotic Foods
- 7.1.1.1. Yogurt
- 7.1.1.2. Bakery/Breakfast Cereals
- 7.1.1.3. Baby Food and Infant Formula
- 7.1.1.4. Other Probiotic Foods
- 7.1.2. Probiotic Drinks
- 7.1.2.1. Fruit-based Probiotic Drinks
- 7.1.2.2. Dairy-based Probiotic Drinks
- 7.1.3. Dietary Supplements
- 7.1.1. Probiotic Foods
- 7.2. Market Analysis, Insights and Forecast - by Distribution Channel
- 7.2.1. Supermarkets/Hypermarkets
- 7.2.2. Convenience Stores
- 7.2.3. Pharmacies and Drug Stores
- 7.2.4. Online Retail Stores
- 7.2.5. Other Distribution Channels
- 7.3. Market Analysis, Insights and Forecast - by Geography
- 7.3.1. China
- 7.3.2. Japan
- 7.3.3. India
- 7.3.4. South Korea
- 7.3.5. Australia
- 7.3.6. Rest of Asia-Pacific
- 7.1. Market Analysis, Insights and Forecast - by Type
- 8. Japan APAC Probiotic Market Analysis, Insights and Forecast, 2021-2033
- 8.1. Market Analysis, Insights and Forecast - by Type
- 8.1.1. Probiotic Foods
- 8.1.1.1. Yogurt
- 8.1.1.2. Bakery/Breakfast Cereals
- 8.1.1.3. Baby Food and Infant Formula
- 8.1.1.4. Other Probiotic Foods
- 8.1.2. Probiotic Drinks
- 8.1.2.1. Fruit-based Probiotic Drinks
- 8.1.2.2. Dairy-based Probiotic Drinks
- 8.1.3. Dietary Supplements
- 8.1.1. Probiotic Foods
- 8.2. Market Analysis, Insights and Forecast - by Distribution Channel
- 8.2.1. Supermarkets/Hypermarkets
- 8.2.2. Convenience Stores
- 8.2.3. Pharmacies and Drug Stores
- 8.2.4. Online Retail Stores
- 8.2.5. Other Distribution Channels
- 8.3. Market Analysis, Insights and Forecast - by Geography
- 8.3.1. China
- 8.3.2. Japan
- 8.3.3. India
- 8.3.4. South Korea
- 8.3.5. Australia
- 8.3.6. Rest of Asia-Pacific
- 8.1. Market Analysis, Insights and Forecast - by Type
- 9. India APAC Probiotic Market Analysis, Insights and Forecast, 2021-2033
- 9.1. Market Analysis, Insights and Forecast - by Type
- 9.1.1. Probiotic Foods
- 9.1.1.1. Yogurt
- 9.1.1.2. Bakery/Breakfast Cereals
- 9.1.1.3. Baby Food and Infant Formula
- 9.1.1.4. Other Probiotic Foods
- 9.1.2. Probiotic Drinks
- 9.1.2.1. Fruit-based Probiotic Drinks
- 9.1.2.2. Dairy-based Probiotic Drinks
- 9.1.3. Dietary Supplements
- 9.1.1. Probiotic Foods
- 9.2. Market Analysis, Insights and Forecast - by Distribution Channel
- 9.2.1. Supermarkets/Hypermarkets
- 9.2.2. Convenience Stores
- 9.2.3. Pharmacies and Drug Stores
- 9.2.4. Online Retail Stores
- 9.2.5. Other Distribution Channels
- 9.3. Market Analysis, Insights and Forecast - by Geography
- 9.3.1. China
- 9.3.2. Japan
- 9.3.3. India
- 9.3.4. South Korea
- 9.3.5. Australia
- 9.3.6. Rest of Asia-Pacific
- 9.1. Market Analysis, Insights and Forecast - by Type
- 10. South Korea APAC Probiotic Market Analysis, Insights and Forecast, 2021-2033
- 10.1. Market Analysis, Insights and Forecast - by Type
- 10.1.1. Probiotic Foods
- 10.1.1.1. Yogurt
- 10.1.1.2. Bakery/Breakfast Cereals
- 10.1.1.3. Baby Food and Infant Formula
- 10.1.1.4. Other Probiotic Foods
- 10.1.2. Probiotic Drinks
- 10.1.2.1. Fruit-based Probiotic Drinks
- 10.1.2.2. Dairy-based Probiotic Drinks
- 10.1.3. Dietary Supplements
- 10.1.1. Probiotic Foods
- 10.2. Market Analysis, Insights and Forecast - by Distribution Channel
- 10.2.1. Supermarkets/Hypermarkets
- 10.2.2. Convenience Stores
- 10.2.3. Pharmacies and Drug Stores
- 10.2.4. Online Retail Stores
- 10.2.5. Other Distribution Channels
- 10.3. Market Analysis, Insights and Forecast - by Geography
- 10.3.1. China
- 10.3.2. Japan
- 10.3.3. India
- 10.3.4. South Korea
- 10.3.5. Australia
- 10.3.6. Rest of Asia-Pacific
- 10.1. Market Analysis, Insights and Forecast - by Type
- 11. Australia APAC Probiotic Market Analysis, Insights and Forecast, 2021-2033
- 11.1. Market Analysis, Insights and Forecast - by Type
- 11.1.1. Probiotic Foods
- 11.1.1.1. Yogurt
- 11.1.1.2. Bakery/Breakfast Cereals
- 11.1.1.3. Baby Food and Infant Formula
- 11.1.1.4. Other Probiotic Foods
- 11.1.2. Probiotic Drinks
- 11.1.2.1. Fruit-based Probiotic Drinks
- 11.1.2.2. Dairy-based Probiotic Drinks
- 11.1.3. Dietary Supplements
- 11.1.1. Probiotic Foods
- 11.2. Market Analysis, Insights and Forecast - by Distribution Channel
- 11.2.1. Supermarkets/Hypermarkets
- 11.2.2. Convenience Stores
- 11.2.3. Pharmacies and Drug Stores
- 11.2.4. Online Retail Stores
- 11.2.5. Other Distribution Channels
- 11.3. Market Analysis, Insights and Forecast - by Geography
- 11.3.1. China
- 11.3.2. Japan
- 11.3.3. India
- 11.3.4. South Korea
- 11.3.5. Australia
- 11.3.6. Rest of Asia-Pacific
- 11.1. Market Analysis, Insights and Forecast - by Type
- 12. Rest of Asia Pacific APAC Probiotic Market Analysis, Insights and Forecast, 2021-2033
- 12.1. Market Analysis, Insights and Forecast - by Type
- 12.1.1. Probiotic Foods
- 12.1.1.1. Yogurt
- 12.1.1.2. Bakery/Breakfast Cereals
- 12.1.1.3. Baby Food and Infant Formula
- 12.1.1.4. Other Probiotic Foods
- 12.1.2. Probiotic Drinks
- 12.1.2.1. Fruit-based Probiotic Drinks
- 12.1.2.2. Dairy-based Probiotic Drinks
- 12.1.3. Dietary Supplements
- 12.1.1. Probiotic Foods
- 12.2. Market Analysis, Insights and Forecast - by Distribution Channel
- 12.2.1. Supermarkets/Hypermarkets
- 12.2.2. Convenience Stores
- 12.2.3. Pharmacies and Drug Stores
- 12.2.4. Online Retail Stores
- 12.2.5. Other Distribution Channels
- 12.3. Market Analysis, Insights and Forecast - by Geography
- 12.3.1. China
- 12.3.2. Japan
- 12.3.3. India
- 12.3.4. South Korea
- 12.3.5. Australia
- 12.3.6. Rest of Asia-Pacific
- 12.1. Market Analysis, Insights and Forecast - by Type
- 13. Competitive Analysis
- 13.1. Company Profiles
- 13.1.1 Cell Biotech
- 13.1.1.1. Company Overview
- 13.1.1.2. Products
- 13.1.1.3. Company Financials
- 13.1.1.4. SWOT Analysis
- 13.1.2 Nestle SA
- 13.1.2.1. Company Overview
- 13.1.2.2. Products
- 13.1.2.3. Company Financials
- 13.1.2.4. SWOT Analysis
- 13.1.3 Groupe Danone
- 13.1.3.1. Company Overview
- 13.1.3.2. Products
- 13.1.3.3. Company Financials
- 13.1.3.4. SWOT Analysis
- 13.1.4 PepsiCo Inc
- 13.1.4.1. Company Overview
- 13.1.4.2. Products
- 13.1.4.3. Company Financials
- 13.1.4.4. SWOT Analysis
- 13.1.5 Yakult Honsha Co Ltd
- 13.1.5.1. Company Overview
- 13.1.5.2. Products
- 13.1.5.3. Company Financials
- 13.1.5.4. SWOT Analysis
- 13.1.6 Amway Corp
- 13.1.6.1. Company Overview
- 13.1.6.2. Products
- 13.1.6.3. Company Financials
- 13.1.6.4. SWOT Analysis
- 13.1.7 Danone SA
- 13.1.7.1. Company Overview
- 13.1.7.2. Products
- 13.1.7.3. Company Financials
- 13.1.7.4. SWOT Analysis
- 13.1.8 Now Foods
- 13.1.8.1. Company Overview
- 13.1.8.2. Products
- 13.1.8.3. Company Financials
- 13.1.8.4. SWOT Analysis
- 13.1.9 Bio-K Plus International
- 13.1.9.1. Company Overview
- 13.1.9.2. Products
- 13.1.9.3. Company Financials
- 13.1.9.4. SWOT Analysis
- 13.1.10 Anand Milk Union Limited*List Not Exhaustive
- 13.1.10.1. Company Overview
- 13.1.10.2. Products
- 13.1.10.3. Company Financials
- 13.1.10.4. SWOT Analysis
- 13.1.1 Cell Biotech
- 13.2. Market Entropy
- 13.2.1 Company's Key Areas Served
- 13.2.2 Recent Developments
- 13.3. Company Market Share Analysis 2025
- 13.3.1 Top 5 Companies Market Share Analysis
- 13.3.2 Top 3 Companies Market Share Analysis
- 13.4. List of Potential Customers
- 14. Research Methodology
List of Figures
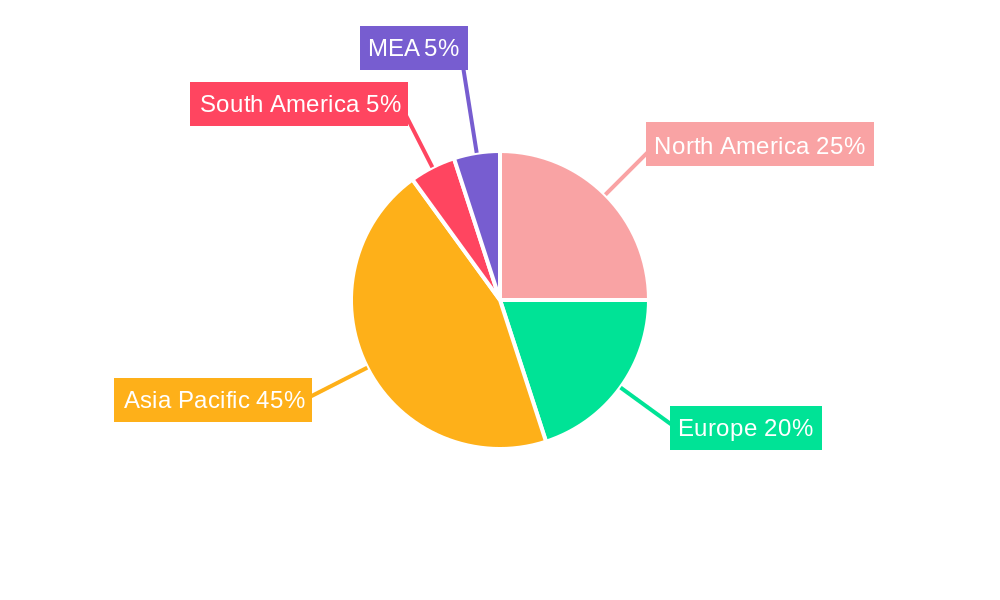
- Figure 1: Global APAC Probiotic Market Revenue Breakdown (billion, %) by Region 2025 & 2033
- Figure 2: China APAC Probiotic Market Revenue (billion), by Type 2025 & 2033
- Figure 3: China APAC Probiotic Market Revenue Share (%), by Type 2025 & 2033
- Figure 4: China APAC Probiotic Market Revenue (billion), by Distribution Channel 2025 & 2033
- Figure 5: China APAC Probiotic Market Revenue Share (%), by Distribution Channel 2025 & 2033
- Figure 6: China APAC Probiotic Market Revenue (billion), by Geography 2025 & 2033
- Figure 7: China APAC Probiotic Market Revenue Share (%), by Geography 2025 & 2033
- Figure 8: China APAC Probiotic Market Revenue (billion), by Country 2025 & 2033
- Figure 9: China APAC Probiotic Market Revenue Share (%), by Country 2025 & 2033
- Figure 10: Japan APAC Probiotic Market Revenue (billion), by Type 2025 & 2033
- Figure 11: Japan APAC Probiotic Market Revenue Share (%), by Type 2025 & 2033
- Figure 12: Japan APAC Probiotic Market Revenue (billion), by Distribution Channel 2025 & 2033
- Figure 13: Japan APAC Probiotic Market Revenue Share (%), by Distribution Channel 2025 & 2033
- Figure 14: Japan APAC Probiotic Market Revenue (billion), by Geography 2025 & 2033
- Figure 15: Japan APAC Probiotic Market Revenue Share (%), by Geography 2025 & 2033
- Figure 16: Japan APAC Probiotic Market Revenue (billion), by Country 2025 & 2033
- Figure 17: Japan APAC Probiotic Market Revenue Share (%), by Country 2025 & 2033
- Figure 18: India APAC Probiotic Market Revenue (billion), by Type 2025 & 2033
- Figure 19: India APAC Probiotic Market Revenue Share (%), by Type 2025 & 2033
- Figure 20: India APAC Probiotic Market Revenue (billion), by Distribution Channel 2025 & 2033
- Figure 21: India APAC Probiotic Market Revenue Share (%), by Distribution Channel 2025 & 2033
- Figure 22: India APAC Probiotic Market Revenue (billion), by Geography 2025 & 2033
- Figure 23: India APAC Probiotic Market Revenue Share (%), by Geography 2025 & 2033
- Figure 24: India APAC Probiotic Market Revenue (billion), by Country 2025 & 2033
- Figure 25: India APAC Probiotic Market Revenue Share (%), by Country 2025 & 2033
- Figure 26: South Korea APAC Probiotic Market Revenue (billion), by Type 2025 & 2033
- Figure 27: South Korea APAC Probiotic Market Revenue Share (%), by Type 2025 & 2033
- Figure 28: South Korea APAC Probiotic Market Revenue (billion), by Distribution Channel 2025 & 2033
- Figure 29: South Korea APAC Probiotic Market Revenue Share (%), by Distribution Channel 2025 & 2033
- Figure 30: South Korea APAC Probiotic Market Revenue (billion), by Geography 2025 & 2033
- Figure 31: South Korea APAC Probiotic Market Revenue Share (%), by Geography 2025 & 2033
- Figure 32: South Korea APAC Probiotic Market Revenue (billion), by Country 2025 & 2033
- Figure 33: South Korea APAC Probiotic Market Revenue Share (%), by Country 2025 & 2033
- Figure 34: Australia APAC Probiotic Market Revenue (billion), by Type 2025 & 2033
- Figure 35: Australia APAC Probiotic Market Revenue Share (%), by Type 2025 & 2033
- Figure 36: Australia APAC Probiotic Market Revenue (billion), by Distribution Channel 2025 & 2033
- Figure 37: Australia APAC Probiotic Market Revenue Share (%), by Distribution Channel 2025 & 2033
- Figure 38: Australia APAC Probiotic Market Revenue (billion), by Geography 2025 & 2033
- Figure 39: Australia APAC Probiotic Market Revenue Share (%), by Geography 2025 & 2033
- Figure 40: Australia APAC Probiotic Market Revenue (billion), by Country 2025 & 2033
- Figure 41: Australia APAC Probiotic Market Revenue Share (%), by Country 2025 & 2033
- Figure 42: Rest of Asia Pacific APAC Probiotic Market Revenue (billion), by Type 2025 & 2033
- Figure 43: Rest of Asia Pacific APAC Probiotic Market Revenue Share (%), by Type 2025 & 2033
- Figure 44: Rest of Asia Pacific APAC Probiotic Market Revenue (billion), by Distribution Channel 2025 & 2033
- Figure 45: Rest of Asia Pacific APAC Probiotic Market Revenue Share (%), by Distribution Channel 2025 & 2033
- Figure 46: Rest of Asia Pacific APAC Probiotic Market Revenue (billion), by Geography 2025 & 2033
- Figure 47: Rest of Asia Pacific APAC Probiotic Market Revenue Share (%), by Geography 2025 & 2033
- Figure 48: Rest of Asia Pacific APAC Probiotic Market Revenue (billion), by Country 2025 & 2033
- Figure 49: Rest of Asia Pacific APAC Probiotic Market Revenue Share (%), by Country 2025 & 2033
List of Tables
- Table 1: Global APAC Probiotic Market Revenue billion Forecast, by Type 2020 & 2033
- Table 2: Global APAC Probiotic Market Revenue billion Forecast, by Distribution Channel 2020 & 2033
- Table 3: Global APAC Probiotic Market Revenue billion Forecast, by Geography 2020 & 2033
- Table 4: Global APAC Probiotic Market Revenue billion Forecast, by Region 2020 & 2033
- Table 5: Global APAC Probiotic Market Revenue billion Forecast, by Type 2020 & 2033
- Table 6: Global APAC Probiotic Market Revenue billion Forecast, by Distribution Channel 2020 & 2033
- Table 7: Global APAC Probiotic Market Revenue billion Forecast, by Geography 2020 & 2033
- Table 8: Global APAC Probiotic Market Revenue billion Forecast, by Country 2020 & 2033
- Table 9: Global APAC Probiotic Market Revenue billion Forecast, by Type 2020 & 2033
- Table 10: Global APAC Probiotic Market Revenue billion Forecast, by Distribution Channel 2020 & 2033
- Table 11: Global APAC Probiotic Market Revenue billion Forecast, by Geography 2020 & 2033
- Table 12: Global APAC Probiotic Market Revenue billion Forecast, by Country 2020 & 2033
- Table 13: Global APAC Probiotic Market Revenue billion Forecast, by Type 2020 & 2033
- Table 14: Global APAC Probiotic Market Revenue billion Forecast, by Distribution Channel 2020 & 2033
- Table 15: Global APAC Probiotic Market Revenue billion Forecast, by Geography 2020 & 2033
- Table 16: Global APAC Probiotic Market Revenue billion Forecast, by Country 2020 & 2033
- Table 17: Global APAC Probiotic Market Revenue billion Forecast, by Type 2020 & 2033
- Table 18: Global APAC Probiotic Market Revenue billion Forecast, by Distribution Channel 2020 & 2033
- Table 19: Global APAC Probiotic Market Revenue billion Forecast, by Geography 2020 & 2033
- Table 20: Global APAC Probiotic Market Revenue billion Forecast, by Country 2020 & 2033
- Table 21: Global APAC Probiotic Market Revenue billion Forecast, by Type 2020 & 2033
- Table 22: Global APAC Probiotic Market Revenue billion Forecast, by Distribution Channel 2020 & 2033
- Table 23: Global APAC Probiotic Market Revenue billion Forecast, by Geography 2020 & 2033
- Table 24: Global APAC Probiotic Market Revenue billion Forecast, by Country 2020 & 2033
- Table 25: Global APAC Probiotic Market Revenue billion Forecast, by Type 2020 & 2033
- Table 26: Global APAC Probiotic Market Revenue billion Forecast, by Distribution Channel 2020 & 2033
- Table 27: Global APAC Probiotic Market Revenue billion Forecast, by Geography 2020 & 2033
- Table 28: Global APAC Probiotic Market Revenue billion Forecast, by Country 2020 & 2033
Frequently Asked Questions
1. What is the projected Compound Annual Growth Rate (CAGR) of the APAC Probiotic Market?
The projected CAGR is approximately 10.7%.
2. Which companies are prominent players in the APAC Probiotic Market?
Key companies in the market include Cell Biotech, Nestle SA, Groupe Danone, PepsiCo Inc, Yakult Honsha Co Ltd, Amway Corp, Danone SA, Now Foods, Bio-K Plus International, Anand Milk Union Limited*List Not Exhaustive.
3. What are the main segments of the APAC Probiotic Market?
The market segments include Type, Distribution Channel, Geography.
4. Can you provide details about the market size?
The market size is estimated to be USD 86.01 billion as of 2022.
5. What are some drivers contributing to market growth?
Growth In Foodservice Expenditure and Tourism Sector; Premiumization with the Growth of Fortified and Flavored Water.
6. What are the notable trends driving market growth?
Increasing Health Consciousness.
7. Are there any restraints impacting market growth?
Concerns Regarding Plastic Waste and the Rising Inclination Toward Tap Water.
8. Can you provide examples of recent developments in the market?
Sept 2022: Nestle Health Science's probiotics brand Garden of Life launched two new probiotic drinks targeted at kids' growth and immune health in China's offline retail market.
9. What pricing options are available for accessing the report?
Pricing options include single-user, multi-user, and enterprise licenses priced at USD 4750, USD 5250, and USD 8750 respectively.
10. Is the market size provided in terms of value or volume?
The market size is provided in terms of value, measured in billion.
11. Are there any specific market keywords associated with the report?
Yes, the market keyword associated with the report is "APAC Probiotic Market," which aids in identifying and referencing the specific market segment covered.
12. How do I determine which pricing option suits my needs best?
The pricing options vary based on user requirements and access needs. Individual users may opt for single-user licenses, while businesses requiring broader access may choose multi-user or enterprise licenses for cost-effective access to the report.
13. Are there any additional resources or data provided in the APAC Probiotic Market report?
While the report offers comprehensive insights, it's advisable to review the specific contents or supplementary materials provided to ascertain if additional resources or data are available.
14. How can I stay updated on further developments or reports in the APAC Probiotic Market?
To stay informed about further developments, trends, and reports in the APAC Probiotic Market, consider subscribing to industry newsletters, following relevant companies and organizations, or regularly checking reputable industry news sources and publications.
Methodology
Step 1 - Identification of Relevant Samples Size from Population Database


Step 2 - Approaches for Defining Global Market Size (Value, Volume* & Price*)

Note*: In applicable scenarios
Step 3 - Data Sources
Primary Research
- Web Analytics
- Survey Reports
- Research Institute
- Latest Research Reports
- Opinion Leaders
Secondary Research
- Annual Reports
- White Paper
- Latest Press Release
- Industry Association
- Paid Database
- Investor Presentations

Step 4 - Data Triangulation
Involves using different sources of information in order to increase the validity of a study
These sources are likely to be stakeholders in a program - participants, other researchers, program staff, other community members, and so on.
Then we put all data in single framework & apply various statistical tools to find out the dynamic on the market.
During the analysis stage, feedback from the stakeholder groups would be compared to determine areas of agreement as well as areas of divergence