

Key Insights
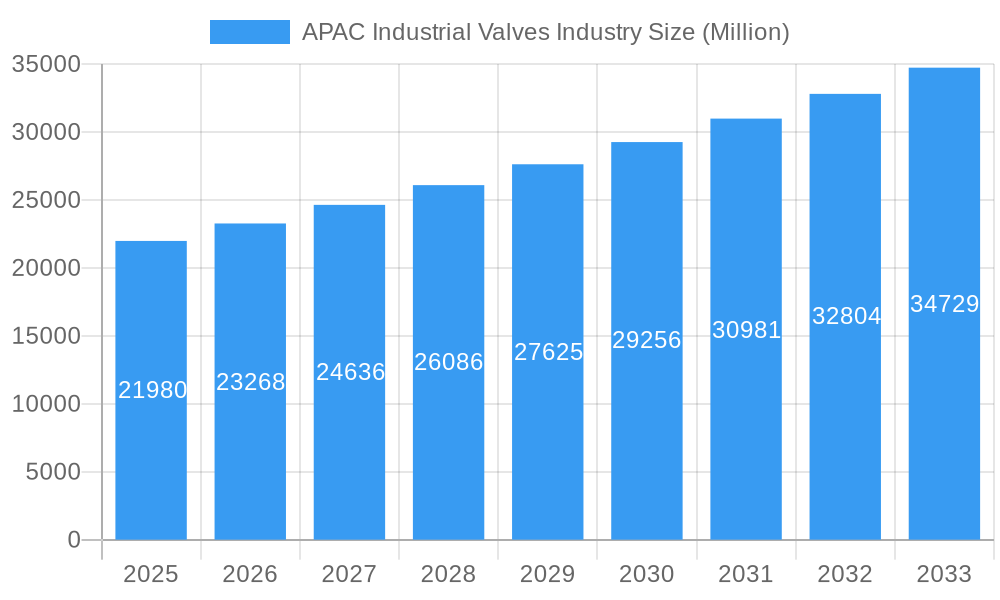
The Asia-Pacific (APAC) industrial valves market, valued at $21.98 billion in 2025, is projected to experience robust growth, driven by the region's burgeoning industrialization and infrastructure development. A compound annual growth rate (CAGR) of 5.67% from 2025 to 2033 indicates a significant expansion of this market. Key growth drivers include the increasing demand for valves in the food processing, pulp and paper, and power sectors, coupled with the expansion of water and wastewater management infrastructure, particularly desalination plants across rapidly developing economies like China and India. The rising adoption of automation and smart technologies in industrial processes further fuels demand for advanced valve solutions. While specific segment breakdowns are not fully provided, it's reasonable to expect that the downstream segments (food processing, pulp and paper, and other applications) will contribute significantly to market growth, driven by increasing production and processing needs in these industries. Similarly, within valve types, butterfly, ball, and globe valves are likely to dominate due to their versatility and cost-effectiveness. The shift towards sustainable practices may also drive demand for energy-efficient valve designs. However, potential restraints could include fluctuating raw material prices, economic downturns, and competition from regional manufacturers. Nevertheless, the long-term outlook for the APAC industrial valves market remains positive, supported by continued industrial expansion and technological advancements.
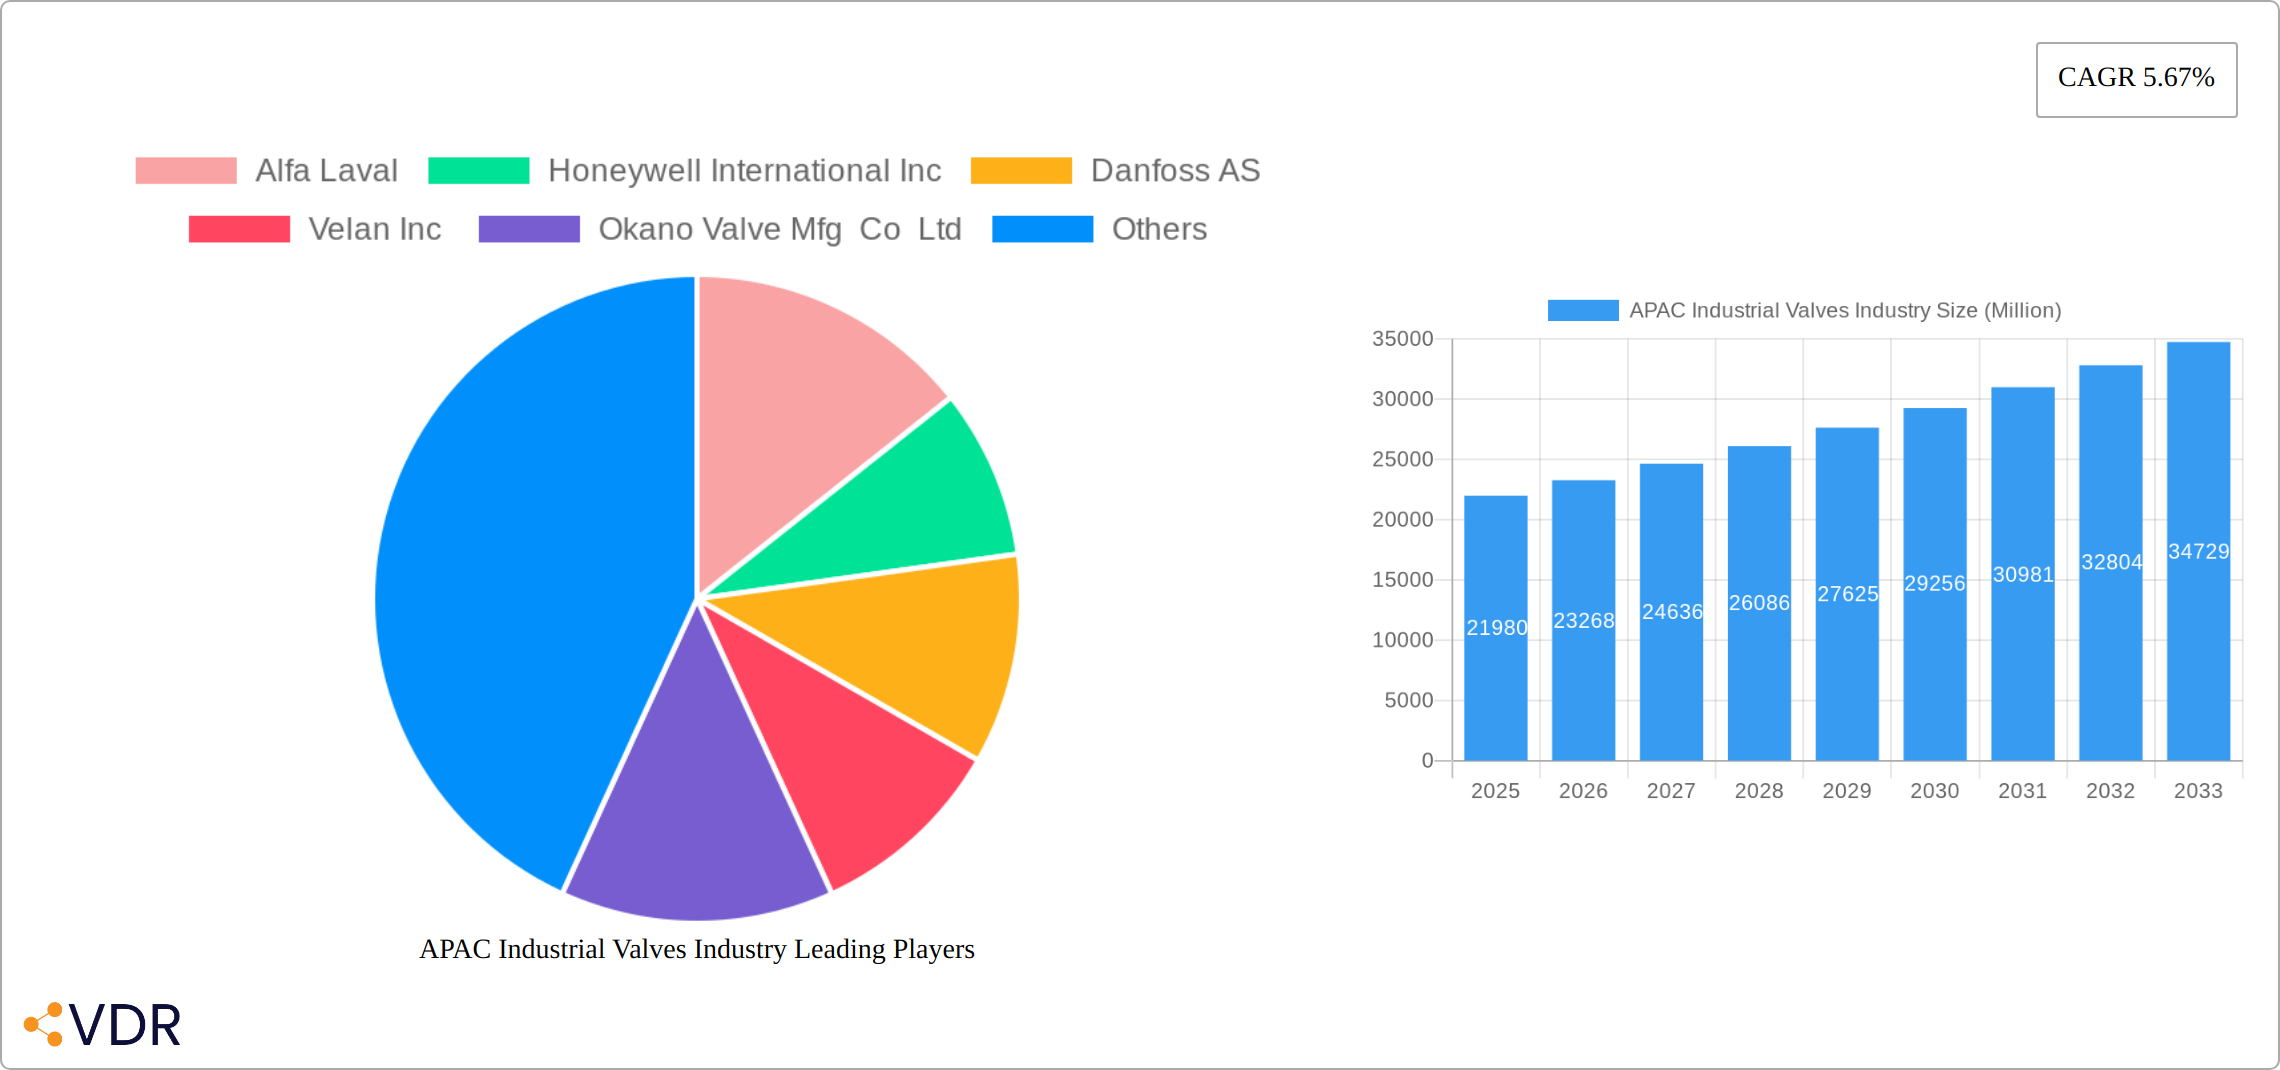
APAC Industrial Valves Industry Market Size (In Billion)
The market's competitive landscape is characterized by a mix of global and regional players. Established multinational corporations like Alfa Laval, Honeywell, and Emerson Electric, alongside regional players like Okano Valve and AVK Holding, are vying for market share. The presence of these diverse players indicates a dynamic market with both established technologies and emerging innovations. The ongoing investments in research and development by these companies are likely to lead to further advancements in valve technology, driving improved efficiency, reliability, and safety in industrial processes. Strategic partnerships, mergers, and acquisitions are expected to reshape the competitive landscape in the coming years, further contributing to market growth and innovation. The forecast period of 2025-2033 presents significant opportunities for both established and new entrants in this growing market. Understanding regional variations in demand and regulatory landscapes is crucial for successful market penetration.
APAC Industrial Valves Industry Company Market Share
APAC Industrial Valves Industry: A Comprehensive Market Report (2019-2033)
This comprehensive report provides an in-depth analysis of the Asia-Pacific (APAC) industrial valves market, encompassing market size, growth trends, competitive landscape, and future outlook. The report covers the period from 2019 to 2033, with a focus on the key segments and driving forces shaping this dynamic industry. With a base year of 2025 and an estimated year of 2025, this report offers valuable insights for industry professionals, investors, and strategic decision-makers. The market is segmented by downstream applications, valve types, products, and applications, providing a granular understanding of market dynamics. The report also highlights significant industry developments and key players, offering a complete picture of the APAC industrial valves market. The total market size in 2025 is estimated at xx Million units.
APAC Industrial Valves Industry Market Dynamics & Structure
The APAC industrial valves market is characterized by a moderately concentrated landscape, with a few major players holding significant market share. Technological innovation, driven by the demand for higher efficiency, safety, and automation, is a key driver. Stringent regulatory frameworks, especially concerning environmental compliance and safety standards, significantly influence market dynamics. The market faces competition from substitute products, particularly in specific applications. End-user demographics are diverse, spanning various industries with varying needs and preferences. M&A activity is moderate, with strategic acquisitions aimed at expanding product portfolios and geographical reach.
- Market Concentration: The top 5 players account for approximately xx% of the market share in 2025.
- Technological Innovation: Focus on smart valves, digitalization, and improved materials are key innovation drivers.
- Regulatory Landscape: Stringent environmental regulations and safety standards are shaping market trends.
- Competitive Substitutes: Alternative technologies and materials present competitive pressure in niche segments.
- End-User Demographics: Diverse industries like power, water, oil & gas, and chemicals drive demand.
- M&A Activity: xx major M&A deals were recorded between 2019 and 2024.
APAC Industrial Valves Industry Growth Trends & Insights
The APAC industrial valves market experienced significant growth during the historical period (2019-2024), driven by industrial expansion, infrastructure development, and increasing automation across various sectors. The market is projected to maintain a steady growth trajectory during the forecast period (2025-2033), fueled by ongoing investments in infrastructure projects, particularly in the power, water, and oil & gas sectors. Technological disruptions, such as the adoption of smart valves and digitalization, are further accelerating market growth. Changing consumer behavior, emphasizing sustainability and efficiency, is also influencing product demand.
- Market Size Evolution: Market size grew from xx Million units in 2019 to xx Million units in 2024, exhibiting a CAGR of xx%.
- Adoption Rates: Adoption of advanced valve technologies is increasing at a CAGR of xx% during the forecast period.
- Technological Disruptions: Smart valves and digital solutions are driving efficiency and reducing operational costs.
- Consumer Behavior Shifts: Growing emphasis on sustainability and operational efficiency are impacting purchase decisions.
Dominant Regions, Countries, or Segments in APAC Industrial Valves Industry
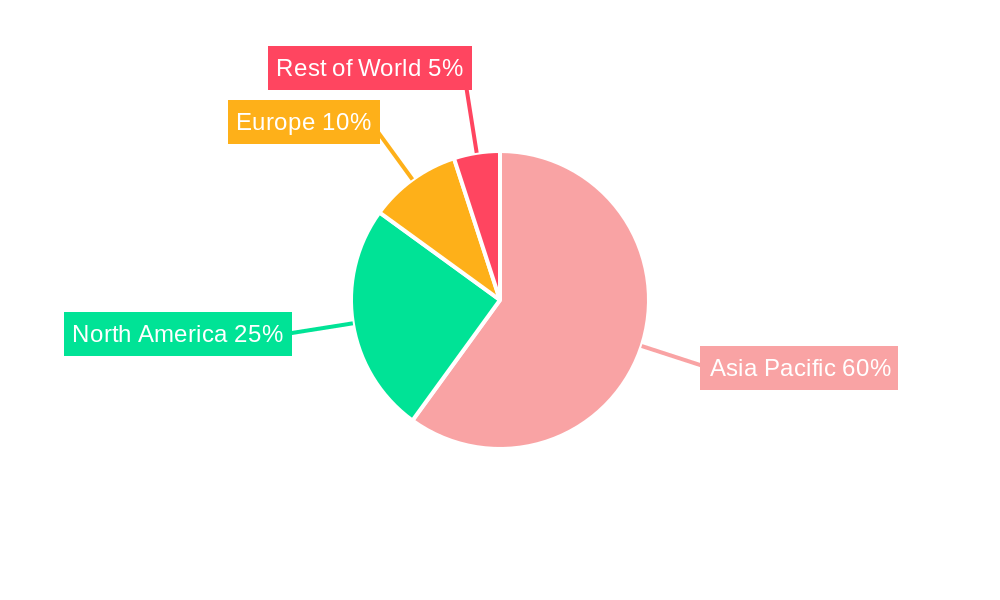
China and India are the undisputed leaders in the APAC industrial valves market, fueled by robust economic expansion, massive infrastructure development projects, and substantial investments across diverse industrial sectors. Within this dynamic market, downstream applications such as food processing, pulp and paper, and other specialized applications, alongside ball valves and quarter-turn valves, are particularly prominent, exhibiting significantly higher growth rates than other segments. Crucially, the power generation sector and water & wastewater management (including desalination) are key growth drivers, significantly impacted by large-scale investments in infrastructure projects. The increasing demand for efficient and reliable valve solutions in these sectors presents significant opportunities for market players.
- Key Growth Drivers: Robust economic growth, substantial infrastructure development, accelerating industrialization, and rising demand for efficient and reliable valve solutions in key sectors (power, water & wastewater).
- China: Maintains its position as the largest market, driven by extensive industrialization and a continuous pipeline of large-scale infrastructure projects.
- India: Demonstrates significant growth potential fueled by rapid industrial expansion and supportive government initiatives promoting infrastructure development.
- Dominant Segments: Ball valves, quarter-turn valves, and the water & wastewater management sector consistently exhibit high growth rates, attracting considerable investment and innovation.
APAC Industrial Valves Industry Product Landscape
The APAC industrial valves market boasts a diverse product landscape, encompassing a wide array of valve types (butterfly, ball, globe, gate, plug, and others), product categories (quarter-turn, multi-turn, and control valves), and applications tailored to diverse industry needs. Innovation is a key driver, focusing on enhancing performance, efficiency, and durability. There's a growing trend toward smart valves integrated with sophisticated control systems and digital platforms, offering enhanced capabilities. Unique selling propositions increasingly emphasize enhanced safety features, improved leak prevention mechanisms, and remote monitoring capabilities, catering to the evolving demands of modern industrial processes.
Key Drivers, Barriers & Challenges in APAP Industrial Valves Industry
Key Drivers:
- Increased industrialization and infrastructure development across APAC.
- Growing demand for efficient and reliable fluid control solutions.
- Adoption of smart valves and digital technologies for enhanced process control and automation.
- Stringent environmental regulations driving the adoption of eco-friendly valves.
Key Challenges & Restraints:
- Supply chain disruptions impacting material availability and manufacturing costs.
- Intense competition among established and emerging players.
- Economic fluctuations impacting investment decisions in infrastructure and industrial projects.
- Regulatory hurdles and compliance requirements vary across different APAC countries.
Emerging Opportunities in APAC Industrial Valves Industry
- Market Expansion: Significant potential exists in expanding into untapped markets across Southeast Asia and other emerging economies in the region.
- Specialized Valve Development: Developing specialized valves for niche applications, such as renewable energy (solar, wind, geothermal) and advanced manufacturing (semiconductor, pharmaceuticals), presents lucrative opportunities.
- Advanced Materials & Technologies: Integration of cutting-edge materials and technologies promises to enhance valve performance, extend lifespan, and reduce maintenance requirements.
- Digitalization & IoT Integration: Leveraging digitalization and the Internet of Things (IoT) to enable remote monitoring, predictive maintenance, and optimized operational efficiency is crucial for gaining a competitive edge.
Growth Accelerators in the APAC Industrial Valves Industry
Strategic partnerships and collaborations between valve manufacturers, technology providers, and end-users are crucial catalysts for market growth. Technological breakthroughs in materials science, automation, and digitalization are continually enhancing valve performance and expanding application possibilities. Government policies and initiatives promoting industrial development and infrastructure investment in key sectors, such as water management and renewable energy, significantly contribute to market expansion. Furthermore, increasing emphasis on environmental sustainability and the adoption of energy-efficient solutions are driving demand for advanced valve technologies.
Key Players Shaping the APAC Industrial Valves Industry Market
- Alfa Laval
- Honeywell International Inc
- Danfoss AS
- Velan Inc
- Okano Valve Mfg Co Ltd
- SAMSON AKTIENGESELLSCHAFT
- Flowserve Corporation
- The Weir Group PLC
- Georg Fischer Ltd
- Baker Hughes
- Emerson Electric Co
- CIRCOR International Inc
- AVK Holding AS
- PARKER HANNIFIN CORP
- EBRO ARMATUREN Gebr Brer GmbH
- Hitachi Metals Ltd
- ITT Inc
- NIBCO
- IMI Critical Engineering
- Crane Co
- Valvitalia SpA
- Curtiss-Wright Corporation
- Schlumberger Limited
- KITZ Corporation
Notable Milestones in APAC Industrial Valves Industry Sector
- February 2022: Emerson's inauguration of a new integrated manufacturing facility in Chennai, India, significantly boosted its production capacity for fluid control and pneumatics products. This expansion underscores Emerson's commitment to the APAC market and solidifies its regional leadership.
- March 2022: Flowserve's strategic partnership with Gradiant to target the water technology market in APAC highlights a proactive approach to capitalize on the burgeoning demand for advanced water treatment solutions.
- [Add more recent milestones here with dates and brief descriptions. Include company names and specifics wherever possible.]
In-Depth APAC Industrial Valves Industry Market Outlook
The APAC industrial valves market presents substantial long-term growth potential, driven by continuous industrialization, infrastructure development, and technological advancements. Strategic opportunities lie in focusing on niche applications, developing innovative products catering to sustainability needs, and leveraging digital technologies for improved efficiency and customer service. The market's future growth will hinge on effectively navigating supply chain challenges, adapting to evolving regulatory landscapes, and fostering strong partnerships to maintain competitiveness.
APAC Industrial Valves Industry Segmentation
-
1. Type
- 1.1. Butterfly Valve
- 1.2. Ball Valve
- 1.3. Globe Valve
- 1.4. Gate Valve
- 1.5. Plug Valve
- 1.6. Other Types
-
2. Product
- 2.1. Quarter-turn Valve
- 2.2. Multi-turn Valve
- 2.3. Other Products (Control Valves)
-
3. Application
- 3.1. Power
-
3.2. Water an
- 3.2.1. Metal, Mineral, and Mining
- 3.2.2. Other Applications
- 3.3. By Chemicals
-
3.4. Oil and Gas
- 3.4.1. Upstream
- 3.4.2. Mid-stream
- 3.4.3. Downstream
- 3.5. Food Processing
- 3.6. Pulp and Paper
-
4. Geography
- 4.1. China
- 4.2. India
- 4.3. Japan
- 4.4. South Korea
- 4.5. Malaysia
- 4.6. Thailand
- 4.7. Indonesia
- 4.8. Vietnam
- 4.9. Rest of Asia-Pacific
APAC Industrial Valves Industry Segmentation By Geography
- 1. China
- 2. India
- 3. Japan
- 4. South Korea
- 5. Malaysia
- 6. Thailand
- 7. Indonesia
- 8. Vietnam
- 9. Rest of Asia Pacific
APAC Industrial Valves Industry Regional Market Share
Geographic Coverage of APAC Industrial Valves Industry
APAC Industrial Valves Industry REPORT HIGHLIGHTS
| Aspects | Details |
|---|---|
| Study Period | 2020-2034 |
| Base Year | 2025 |
| Estimated Year | 2026 |
| Forecast Period | 2026-2034 |
| Historical Period | 2020-2025 |
| Growth Rate | CAGR of 5.67% from 2020-2034 |
| Segmentation |
|
Table of Contents
- 1. Introduction
- 1.1. Research Scope
- 1.2. Market Segmentation
- 1.3. Research Objective
- 1.4. Definitions and Assumptions
- 2. Executive Summary
- 2.1. Market Snapshot
- 3. Market Dynamics
- 3.1. Market Drivers
- 3.2. Market Restrains
- 3.3. Market Trends
- 3.4. Market Opportunities
- 4. Market Factor Analysis
- 4.1. Porters Five Forces
- 4.1.1. Bargaining Power of Suppliers
- 4.1.2. Bargaining Power of Buyers
- 4.1.3. Threat of New Entrants
- 4.1.4. Threat of Substitutes
- 4.1.5. Competitive Rivalry
- 4.2. PESTEL analysis
- 4.3. BCG Analysis
- 4.3.1. Stars (High Growth, High Market Share)
- 4.3.2. Cash Cows (Low Growth, High Market Share)
- 4.3.3. Question Mark (High Growth, Low Market Share)
- 4.3.4. Dogs (Low Growth, Low Market Share)
- 4.4. Ansoff Matrix Analysis
- 4.5. Supply Chain Analysis
- 4.6. Regulatory Landscape
- 4.7. Current Market Potential and Opportunity Assessment (TAM–SAM–SOM Framework)
- 4.8. VDR Analyst Note
- 4.1. Porters Five Forces
- 5. Market Analysis, Insights and Forecast 2021-2033
- 5.1. Market Analysis, Insights and Forecast - by Type
- 5.1.1. Butterfly Valve
- 5.1.2. Ball Valve
- 5.1.3. Globe Valve
- 5.1.4. Gate Valve
- 5.1.5. Plug Valve
- 5.1.6. Other Types
- 5.2. Market Analysis, Insights and Forecast - by Product
- 5.2.1. Quarter-turn Valve
- 5.2.2. Multi-turn Valve
- 5.2.3. Other Products (Control Valves)
- 5.3. Market Analysis, Insights and Forecast - by Application
- 5.3.1. Power
- 5.3.2. Water an
- 5.3.2.1. Metal, Mineral, and Mining
- 5.3.2.2. Other Applications
- 5.3.3. By Chemicals
- 5.3.4. Oil and Gas
- 5.3.4.1. Upstream
- 5.3.4.2. Mid-stream
- 5.3.4.3. Downstream
- 5.3.5. Food Processing
- 5.3.6. Pulp and Paper
- 5.4. Market Analysis, Insights and Forecast - by Geography
- 5.4.1. China
- 5.4.2. India
- 5.4.3. Japan
- 5.4.4. South Korea
- 5.4.5. Malaysia
- 5.4.6. Thailand
- 5.4.7. Indonesia
- 5.4.8. Vietnam
- 5.4.9. Rest of Asia-Pacific
- 5.5. Market Analysis, Insights and Forecast - by Region
- 5.5.1. China
- 5.5.2. India
- 5.5.3. Japan
- 5.5.4. South Korea
- 5.5.5. Malaysia
- 5.5.6. Thailand
- 5.5.7. Indonesia
- 5.5.8. Vietnam
- 5.5.9. Rest of Asia Pacific
- 5.1. Market Analysis, Insights and Forecast - by Type
- 6. Global APAC Industrial Valves Industry Analysis, Insights and Forecast, 2021-2033
- 6.1. Market Analysis, Insights and Forecast - by Type
- 6.1.1. Butterfly Valve
- 6.1.2. Ball Valve
- 6.1.3. Globe Valve
- 6.1.4. Gate Valve
- 6.1.5. Plug Valve
- 6.1.6. Other Types
- 6.2. Market Analysis, Insights and Forecast - by Product
- 6.2.1. Quarter-turn Valve
- 6.2.2. Multi-turn Valve
- 6.2.3. Other Products (Control Valves)
- 6.3. Market Analysis, Insights and Forecast - by Application
- 6.3.1. Power
- 6.3.2. Water an
- 6.3.2.1. Metal, Mineral, and Mining
- 6.3.2.2. Other Applications
- 6.3.3. By Chemicals
- 6.3.4. Oil and Gas
- 6.3.4.1. Upstream
- 6.3.4.2. Mid-stream
- 6.3.4.3. Downstream
- 6.3.5. Food Processing
- 6.3.6. Pulp and Paper
- 6.4. Market Analysis, Insights and Forecast - by Geography
- 6.4.1. China
- 6.4.2. India
- 6.4.3. Japan
- 6.4.4. South Korea
- 6.4.5. Malaysia
- 6.4.6. Thailand
- 6.4.7. Indonesia
- 6.4.8. Vietnam
- 6.4.9. Rest of Asia-Pacific
- 6.1. Market Analysis, Insights and Forecast - by Type
- 7. China APAC Industrial Valves Industry Analysis, Insights and Forecast, 2021-2033
- 7.1. Market Analysis, Insights and Forecast - by Type
- 7.1.1. Butterfly Valve
- 7.1.2. Ball Valve
- 7.1.3. Globe Valve
- 7.1.4. Gate Valve
- 7.1.5. Plug Valve
- 7.1.6. Other Types
- 7.2. Market Analysis, Insights and Forecast - by Product
- 7.2.1. Quarter-turn Valve
- 7.2.2. Multi-turn Valve
- 7.2.3. Other Products (Control Valves)
- 7.3. Market Analysis, Insights and Forecast - by Application
- 7.3.1. Power
- 7.3.2. Water an
- 7.3.2.1. Metal, Mineral, and Mining
- 7.3.2.2. Other Applications
- 7.3.3. By Chemicals
- 7.3.4. Oil and Gas
- 7.3.4.1. Upstream
- 7.3.4.2. Mid-stream
- 7.3.4.3. Downstream
- 7.3.5. Food Processing
- 7.3.6. Pulp and Paper
- 7.4. Market Analysis, Insights and Forecast - by Geography
- 7.4.1. China
- 7.4.2. India
- 7.4.3. Japan
- 7.4.4. South Korea
- 7.4.5. Malaysia
- 7.4.6. Thailand
- 7.4.7. Indonesia
- 7.4.8. Vietnam
- 7.4.9. Rest of Asia-Pacific
- 7.1. Market Analysis, Insights and Forecast - by Type
- 8. India APAC Industrial Valves Industry Analysis, Insights and Forecast, 2021-2033
- 8.1. Market Analysis, Insights and Forecast - by Type
- 8.1.1. Butterfly Valve
- 8.1.2. Ball Valve
- 8.1.3. Globe Valve
- 8.1.4. Gate Valve
- 8.1.5. Plug Valve
- 8.1.6. Other Types
- 8.2. Market Analysis, Insights and Forecast - by Product
- 8.2.1. Quarter-turn Valve
- 8.2.2. Multi-turn Valve
- 8.2.3. Other Products (Control Valves)
- 8.3. Market Analysis, Insights and Forecast - by Application
- 8.3.1. Power
- 8.3.2. Water an
- 8.3.2.1. Metal, Mineral, and Mining
- 8.3.2.2. Other Applications
- 8.3.3. By Chemicals
- 8.3.4. Oil and Gas
- 8.3.4.1. Upstream
- 8.3.4.2. Mid-stream
- 8.3.4.3. Downstream
- 8.3.5. Food Processing
- 8.3.6. Pulp and Paper
- 8.4. Market Analysis, Insights and Forecast - by Geography
- 8.4.1. China
- 8.4.2. India
- 8.4.3. Japan
- 8.4.4. South Korea
- 8.4.5. Malaysia
- 8.4.6. Thailand
- 8.4.7. Indonesia
- 8.4.8. Vietnam
- 8.4.9. Rest of Asia-Pacific
- 8.1. Market Analysis, Insights and Forecast - by Type
- 9. Japan APAC Industrial Valves Industry Analysis, Insights and Forecast, 2021-2033
- 9.1. Market Analysis, Insights and Forecast - by Type
- 9.1.1. Butterfly Valve
- 9.1.2. Ball Valve
- 9.1.3. Globe Valve
- 9.1.4. Gate Valve
- 9.1.5. Plug Valve
- 9.1.6. Other Types
- 9.2. Market Analysis, Insights and Forecast - by Product
- 9.2.1. Quarter-turn Valve
- 9.2.2. Multi-turn Valve
- 9.2.3. Other Products (Control Valves)
- 9.3. Market Analysis, Insights and Forecast - by Application
- 9.3.1. Power
- 9.3.2. Water an
- 9.3.2.1. Metal, Mineral, and Mining
- 9.3.2.2. Other Applications
- 9.3.3. By Chemicals
- 9.3.4. Oil and Gas
- 9.3.4.1. Upstream
- 9.3.4.2. Mid-stream
- 9.3.4.3. Downstream
- 9.3.5. Food Processing
- 9.3.6. Pulp and Paper
- 9.4. Market Analysis, Insights and Forecast - by Geography
- 9.4.1. China
- 9.4.2. India
- 9.4.3. Japan
- 9.4.4. South Korea
- 9.4.5. Malaysia
- 9.4.6. Thailand
- 9.4.7. Indonesia
- 9.4.8. Vietnam
- 9.4.9. Rest of Asia-Pacific
- 9.1. Market Analysis, Insights and Forecast - by Type
- 10. South Korea APAC Industrial Valves Industry Analysis, Insights and Forecast, 2021-2033
- 10.1. Market Analysis, Insights and Forecast - by Type
- 10.1.1. Butterfly Valve
- 10.1.2. Ball Valve
- 10.1.3. Globe Valve
- 10.1.4. Gate Valve
- 10.1.5. Plug Valve
- 10.1.6. Other Types
- 10.2. Market Analysis, Insights and Forecast - by Product
- 10.2.1. Quarter-turn Valve
- 10.2.2. Multi-turn Valve
- 10.2.3. Other Products (Control Valves)
- 10.3. Market Analysis, Insights and Forecast - by Application
- 10.3.1. Power
- 10.3.2. Water an
- 10.3.2.1. Metal, Mineral, and Mining
- 10.3.2.2. Other Applications
- 10.3.3. By Chemicals
- 10.3.4. Oil and Gas
- 10.3.4.1. Upstream
- 10.3.4.2. Mid-stream
- 10.3.4.3. Downstream
- 10.3.5. Food Processing
- 10.3.6. Pulp and Paper
- 10.4. Market Analysis, Insights and Forecast - by Geography
- 10.4.1. China
- 10.4.2. India
- 10.4.3. Japan
- 10.4.4. South Korea
- 10.4.5. Malaysia
- 10.4.6. Thailand
- 10.4.7. Indonesia
- 10.4.8. Vietnam
- 10.4.9. Rest of Asia-Pacific
- 10.1. Market Analysis, Insights and Forecast - by Type
- 11. Malaysia APAC Industrial Valves Industry Analysis, Insights and Forecast, 2021-2033
- 11.1. Market Analysis, Insights and Forecast - by Type
- 11.1.1. Butterfly Valve
- 11.1.2. Ball Valve
- 11.1.3. Globe Valve
- 11.1.4. Gate Valve
- 11.1.5. Plug Valve
- 11.1.6. Other Types
- 11.2. Market Analysis, Insights and Forecast - by Product
- 11.2.1. Quarter-turn Valve
- 11.2.2. Multi-turn Valve
- 11.2.3. Other Products (Control Valves)
- 11.3. Market Analysis, Insights and Forecast - by Application
- 11.3.1. Power
- 11.3.2. Water an
- 11.3.2.1. Metal, Mineral, and Mining
- 11.3.2.2. Other Applications
- 11.3.3. By Chemicals
- 11.3.4. Oil and Gas
- 11.3.4.1. Upstream
- 11.3.4.2. Mid-stream
- 11.3.4.3. Downstream
- 11.3.5. Food Processing
- 11.3.6. Pulp and Paper
- 11.4. Market Analysis, Insights and Forecast - by Geography
- 11.4.1. China
- 11.4.2. India
- 11.4.3. Japan
- 11.4.4. South Korea
- 11.4.5. Malaysia
- 11.4.6. Thailand
- 11.4.7. Indonesia
- 11.4.8. Vietnam
- 11.4.9. Rest of Asia-Pacific
- 11.1. Market Analysis, Insights and Forecast - by Type
- 12. Thailand APAC Industrial Valves Industry Analysis, Insights and Forecast, 2021-2033
- 12.1. Market Analysis, Insights and Forecast - by Type
- 12.1.1. Butterfly Valve
- 12.1.2. Ball Valve
- 12.1.3. Globe Valve
- 12.1.4. Gate Valve
- 12.1.5. Plug Valve
- 12.1.6. Other Types
- 12.2. Market Analysis, Insights and Forecast - by Product
- 12.2.1. Quarter-turn Valve
- 12.2.2. Multi-turn Valve
- 12.2.3. Other Products (Control Valves)
- 12.3. Market Analysis, Insights and Forecast - by Application
- 12.3.1. Power
- 12.3.2. Water an
- 12.3.2.1. Metal, Mineral, and Mining
- 12.3.2.2. Other Applications
- 12.3.3. By Chemicals
- 12.3.4. Oil and Gas
- 12.3.4.1. Upstream
- 12.3.4.2. Mid-stream
- 12.3.4.3. Downstream
- 12.3.5. Food Processing
- 12.3.6. Pulp and Paper
- 12.4. Market Analysis, Insights and Forecast - by Geography
- 12.4.1. China
- 12.4.2. India
- 12.4.3. Japan
- 12.4.4. South Korea
- 12.4.5. Malaysia
- 12.4.6. Thailand
- 12.4.7. Indonesia
- 12.4.8. Vietnam
- 12.4.9. Rest of Asia-Pacific
- 12.1. Market Analysis, Insights and Forecast - by Type
- 13. Indonesia APAC Industrial Valves Industry Analysis, Insights and Forecast, 2021-2033
- 13.1. Market Analysis, Insights and Forecast - by Type
- 13.1.1. Butterfly Valve
- 13.1.2. Ball Valve
- 13.1.3. Globe Valve
- 13.1.4. Gate Valve
- 13.1.5. Plug Valve
- 13.1.6. Other Types
- 13.2. Market Analysis, Insights and Forecast - by Product
- 13.2.1. Quarter-turn Valve
- 13.2.2. Multi-turn Valve
- 13.2.3. Other Products (Control Valves)
- 13.3. Market Analysis, Insights and Forecast - by Application
- 13.3.1. Power
- 13.3.2. Water an
- 13.3.2.1. Metal, Mineral, and Mining
- 13.3.2.2. Other Applications
- 13.3.3. By Chemicals
- 13.3.4. Oil and Gas
- 13.3.4.1. Upstream
- 13.3.4.2. Mid-stream
- 13.3.4.3. Downstream
- 13.3.5. Food Processing
- 13.3.6. Pulp and Paper
- 13.4. Market Analysis, Insights and Forecast - by Geography
- 13.4.1. China
- 13.4.2. India
- 13.4.3. Japan
- 13.4.4. South Korea
- 13.4.5. Malaysia
- 13.4.6. Thailand
- 13.4.7. Indonesia
- 13.4.8. Vietnam
- 13.4.9. Rest of Asia-Pacific
- 13.1. Market Analysis, Insights and Forecast - by Type
- 14. Vietnam APAC Industrial Valves Industry Analysis, Insights and Forecast, 2021-2033
- 14.1. Market Analysis, Insights and Forecast - by Type
- 14.1.1. Butterfly Valve
- 14.1.2. Ball Valve
- 14.1.3. Globe Valve
- 14.1.4. Gate Valve
- 14.1.5. Plug Valve
- 14.1.6. Other Types
- 14.2. Market Analysis, Insights and Forecast - by Product
- 14.2.1. Quarter-turn Valve
- 14.2.2. Multi-turn Valve
- 14.2.3. Other Products (Control Valves)
- 14.3. Market Analysis, Insights and Forecast - by Application
- 14.3.1. Power
- 14.3.2. Water an
- 14.3.2.1. Metal, Mineral, and Mining
- 14.3.2.2. Other Applications
- 14.3.3. By Chemicals
- 14.3.4. Oil and Gas
- 14.3.4.1. Upstream
- 14.3.4.2. Mid-stream
- 14.3.4.3. Downstream
- 14.3.5. Food Processing
- 14.3.6. Pulp and Paper
- 14.4. Market Analysis, Insights and Forecast - by Geography
- 14.4.1. China
- 14.4.2. India
- 14.4.3. Japan
- 14.4.4. South Korea
- 14.4.5. Malaysia
- 14.4.6. Thailand
- 14.4.7. Indonesia
- 14.4.8. Vietnam
- 14.4.9. Rest of Asia-Pacific
- 14.1. Market Analysis, Insights and Forecast - by Type
- 15. Rest of Asia Pacific APAC Industrial Valves Industry Analysis, Insights and Forecast, 2021-2033
- 15.1. Market Analysis, Insights and Forecast - by Type
- 15.1.1. Butterfly Valve
- 15.1.2. Ball Valve
- 15.1.3. Globe Valve
- 15.1.4. Gate Valve
- 15.1.5. Plug Valve
- 15.1.6. Other Types
- 15.2. Market Analysis, Insights and Forecast - by Product
- 15.2.1. Quarter-turn Valve
- 15.2.2. Multi-turn Valve
- 15.2.3. Other Products (Control Valves)
- 15.3. Market Analysis, Insights and Forecast - by Application
- 15.3.1. Power
- 15.3.2. Water an
- 15.3.2.1. Metal, Mineral, and Mining
- 15.3.2.2. Other Applications
- 15.3.3. By Chemicals
- 15.3.4. Oil and Gas
- 15.3.4.1. Upstream
- 15.3.4.2. Mid-stream
- 15.3.4.3. Downstream
- 15.3.5. Food Processing
- 15.3.6. Pulp and Paper
- 15.4. Market Analysis, Insights and Forecast - by Geography
- 15.4.1. China
- 15.4.2. India
- 15.4.3. Japan
- 15.4.4. South Korea
- 15.4.5. Malaysia
- 15.4.6. Thailand
- 15.4.7. Indonesia
- 15.4.8. Vietnam
- 15.4.9. Rest of Asia-Pacific
- 15.1. Market Analysis, Insights and Forecast - by Type
- 16. Competitive Analysis
- 16.1. Company Profiles
- 16.1.1 Alfa Laval
- 16.1.1.1. Company Overview
- 16.1.1.2. Products
- 16.1.1.3. Company Financials
- 16.1.1.4. SWOT Analysis
- 16.1.2 Honeywell International Inc
- 16.1.2.1. Company Overview
- 16.1.2.2. Products
- 16.1.2.3. Company Financials
- 16.1.2.4. SWOT Analysis
- 16.1.3 Danfoss AS
- 16.1.3.1. Company Overview
- 16.1.3.2. Products
- 16.1.3.3. Company Financials
- 16.1.3.4. SWOT Analysis
- 16.1.4 Velan Inc
- 16.1.4.1. Company Overview
- 16.1.4.2. Products
- 16.1.4.3. Company Financials
- 16.1.4.4. SWOT Analysis
- 16.1.5 Okano Valve Mfg Co Ltd
- 16.1.5.1. Company Overview
- 16.1.5.2. Products
- 16.1.5.3. Company Financials
- 16.1.5.4. SWOT Analysis
- 16.1.6 SAMSON AKTIENGESELLSCHAFT
- 16.1.6.1. Company Overview
- 16.1.6.2. Products
- 16.1.6.3. Company Financials
- 16.1.6.4. SWOT Analysis
- 16.1.7 Flowserve Corporation
- 16.1.7.1. Company Overview
- 16.1.7.2. Products
- 16.1.7.3. Company Financials
- 16.1.7.4. SWOT Analysis
- 16.1.8 The Weir Group PLC
- 16.1.8.1. Company Overview
- 16.1.8.2. Products
- 16.1.8.3. Company Financials
- 16.1.8.4. SWOT Analysis
- 16.1.9 Georg Fischer Ltd
- 16.1.9.1. Company Overview
- 16.1.9.2. Products
- 16.1.9.3. Company Financials
- 16.1.9.4. SWOT Analysis
- 16.1.10 Baker Hughes
- 16.1.10.1. Company Overview
- 16.1.10.2. Products
- 16.1.10.3. Company Financials
- 16.1.10.4. SWOT Analysis
- 16.1.11 Emerson Electric Co
- 16.1.11.1. Company Overview
- 16.1.11.2. Products
- 16.1.11.3. Company Financials
- 16.1.11.4. SWOT Analysis
- 16.1.12 CIRCOR International Inc
- 16.1.12.1. Company Overview
- 16.1.12.2. Products
- 16.1.12.3. Company Financials
- 16.1.12.4. SWOT Analysis
- 16.1.13 AVK Holding AS
- 16.1.13.1. Company Overview
- 16.1.13.2. Products
- 16.1.13.3. Company Financials
- 16.1.13.4. SWOT Analysis
- 16.1.14 PARKER HANNIFIN CORP
- 16.1.14.1. Company Overview
- 16.1.14.2. Products
- 16.1.14.3. Company Financials
- 16.1.14.4. SWOT Analysis
- 16.1.15 EBRO ARMATUREN Gebr Brer GmbH
- 16.1.15.1. Company Overview
- 16.1.15.2. Products
- 16.1.15.3. Company Financials
- 16.1.15.4. SWOT Analysis
- 16.1.16 Hitachi Metals Ltd
- 16.1.16.1. Company Overview
- 16.1.16.2. Products
- 16.1.16.3. Company Financials
- 16.1.16.4. SWOT Analysis
- 16.1.17 ITT Inc
- 16.1.17.1. Company Overview
- 16.1.17.2. Products
- 16.1.17.3. Company Financials
- 16.1.17.4. SWOT Analysis
- 16.1.18 NIBCO
- 16.1.18.1. Company Overview
- 16.1.18.2. Products
- 16.1.18.3. Company Financials
- 16.1.18.4. SWOT Analysis
- 16.1.19 IMI Critical Engineering
- 16.1.19.1. Company Overview
- 16.1.19.2. Products
- 16.1.19.3. Company Financials
- 16.1.19.4. SWOT Analysis
- 16.1.20 Crane Co
- 16.1.20.1. Company Overview
- 16.1.20.2. Products
- 16.1.20.3. Company Financials
- 16.1.20.4. SWOT Analysis
- 16.1.21 Valvitalia SpA
- 16.1.21.1. Company Overview
- 16.1.21.2. Products
- 16.1.21.3. Company Financials
- 16.1.21.4. SWOT Analysis
- 16.1.22 Curtiss-Wright Corporation
- 16.1.22.1. Company Overview
- 16.1.22.2. Products
- 16.1.22.3. Company Financials
- 16.1.22.4. SWOT Analysis
- 16.1.23 Schlumberger Limited
- 16.1.23.1. Company Overview
- 16.1.23.2. Products
- 16.1.23.3. Company Financials
- 16.1.23.4. SWOT Analysis
- 16.1.24 KITZ Corporation
- 16.1.24.1. Company Overview
- 16.1.24.2. Products
- 16.1.24.3. Company Financials
- 16.1.24.4. SWOT Analysis
- 16.1.1 Alfa Laval
- 16.2. Market Entropy
- 16.2.1 Company's Key Areas Served
- 16.2.2 Recent Developments
- 16.3. Company Market Share Analysis 2025
- 16.3.1 Top 5 Companies Market Share Analysis
- 16.3.2 Top 3 Companies Market Share Analysis
- 16.4. List of Potential Customers
- 17. Research Methodology
List of Figures
- Figure 1: Global APAC Industrial Valves Industry Revenue Breakdown (Million, %) by Region 2025 & 2033
- Figure 2: Global APAC Industrial Valves Industry Volume Breakdown (K Units, %) by Region 2025 & 2033
- Figure 3: China APAC Industrial Valves Industry Revenue (Million), by Type 2025 & 2033
- Figure 4: China APAC Industrial Valves Industry Volume (K Units), by Type 2025 & 2033
- Figure 5: China APAC Industrial Valves Industry Revenue Share (%), by Type 2025 & 2033
- Figure 6: China APAC Industrial Valves Industry Volume Share (%), by Type 2025 & 2033
- Figure 7: China APAC Industrial Valves Industry Revenue (Million), by Product 2025 & 2033
- Figure 8: China APAC Industrial Valves Industry Volume (K Units), by Product 2025 & 2033
- Figure 9: China APAC Industrial Valves Industry Revenue Share (%), by Product 2025 & 2033
- Figure 10: China APAC Industrial Valves Industry Volume Share (%), by Product 2025 & 2033
- Figure 11: China APAC Industrial Valves Industry Revenue (Million), by Application 2025 & 2033
- Figure 12: China APAC Industrial Valves Industry Volume (K Units), by Application 2025 & 2033
- Figure 13: China APAC Industrial Valves Industry Revenue Share (%), by Application 2025 & 2033
- Figure 14: China APAC Industrial Valves Industry Volume Share (%), by Application 2025 & 2033
- Figure 15: China APAC Industrial Valves Industry Revenue (Million), by Geography 2025 & 2033
- Figure 16: China APAC Industrial Valves Industry Volume (K Units), by Geography 2025 & 2033
- Figure 17: China APAC Industrial Valves Industry Revenue Share (%), by Geography 2025 & 2033
- Figure 18: China APAC Industrial Valves Industry Volume Share (%), by Geography 2025 & 2033
- Figure 19: China APAC Industrial Valves Industry Revenue (Million), by Country 2025 & 2033
- Figure 20: China APAC Industrial Valves Industry Volume (K Units), by Country 2025 & 2033
- Figure 21: China APAC Industrial Valves Industry Revenue Share (%), by Country 2025 & 2033
- Figure 22: China APAC Industrial Valves Industry Volume Share (%), by Country 2025 & 2033
- Figure 23: India APAC Industrial Valves Industry Revenue (Million), by Type 2025 & 2033
- Figure 24: India APAC Industrial Valves Industry Volume (K Units), by Type 2025 & 2033
- Figure 25: India APAC Industrial Valves Industry Revenue Share (%), by Type 2025 & 2033
- Figure 26: India APAC Industrial Valves Industry Volume Share (%), by Type 2025 & 2033
- Figure 27: India APAC Industrial Valves Industry Revenue (Million), by Product 2025 & 2033
- Figure 28: India APAC Industrial Valves Industry Volume (K Units), by Product 2025 & 2033
- Figure 29: India APAC Industrial Valves Industry Revenue Share (%), by Product 2025 & 2033
- Figure 30: India APAC Industrial Valves Industry Volume Share (%), by Product 2025 & 2033
- Figure 31: India APAC Industrial Valves Industry Revenue (Million), by Application 2025 & 2033
- Figure 32: India APAC Industrial Valves Industry Volume (K Units), by Application 2025 & 2033
- Figure 33: India APAC Industrial Valves Industry Revenue Share (%), by Application 2025 & 2033
- Figure 34: India APAC Industrial Valves Industry Volume Share (%), by Application 2025 & 2033
- Figure 35: India APAC Industrial Valves Industry Revenue (Million), by Geography 2025 & 2033
- Figure 36: India APAC Industrial Valves Industry Volume (K Units), by Geography 2025 & 2033
- Figure 37: India APAC Industrial Valves Industry Revenue Share (%), by Geography 2025 & 2033
- Figure 38: India APAC Industrial Valves Industry Volume Share (%), by Geography 2025 & 2033
- Figure 39: India APAC Industrial Valves Industry Revenue (Million), by Country 2025 & 2033
- Figure 40: India APAC Industrial Valves Industry Volume (K Units), by Country 2025 & 2033
- Figure 41: India APAC Industrial Valves Industry Revenue Share (%), by Country 2025 & 2033
- Figure 42: India APAC Industrial Valves Industry Volume Share (%), by Country 2025 & 2033
- Figure 43: Japan APAC Industrial Valves Industry Revenue (Million), by Type 2025 & 2033
- Figure 44: Japan APAC Industrial Valves Industry Volume (K Units), by Type 2025 & 2033
- Figure 45: Japan APAC Industrial Valves Industry Revenue Share (%), by Type 2025 & 2033
- Figure 46: Japan APAC Industrial Valves Industry Volume Share (%), by Type 2025 & 2033
- Figure 47: Japan APAC Industrial Valves Industry Revenue (Million), by Product 2025 & 2033
- Figure 48: Japan APAC Industrial Valves Industry Volume (K Units), by Product 2025 & 2033
- Figure 49: Japan APAC Industrial Valves Industry Revenue Share (%), by Product 2025 & 2033
- Figure 50: Japan APAC Industrial Valves Industry Volume Share (%), by Product 2025 & 2033
- Figure 51: Japan APAC Industrial Valves Industry Revenue (Million), by Application 2025 & 2033
- Figure 52: Japan APAC Industrial Valves Industry Volume (K Units), by Application 2025 & 2033
- Figure 53: Japan APAC Industrial Valves Industry Revenue Share (%), by Application 2025 & 2033
- Figure 54: Japan APAC Industrial Valves Industry Volume Share (%), by Application 2025 & 2033
- Figure 55: Japan APAC Industrial Valves Industry Revenue (Million), by Geography 2025 & 2033
- Figure 56: Japan APAC Industrial Valves Industry Volume (K Units), by Geography 2025 & 2033
- Figure 57: Japan APAC Industrial Valves Industry Revenue Share (%), by Geography 2025 & 2033
- Figure 58: Japan APAC Industrial Valves Industry Volume Share (%), by Geography 2025 & 2033
- Figure 59: Japan APAC Industrial Valves Industry Revenue (Million), by Country 2025 & 2033
- Figure 60: Japan APAC Industrial Valves Industry Volume (K Units), by Country 2025 & 2033
- Figure 61: Japan APAC Industrial Valves Industry Revenue Share (%), by Country 2025 & 2033
- Figure 62: Japan APAC Industrial Valves Industry Volume Share (%), by Country 2025 & 2033
- Figure 63: South Korea APAC Industrial Valves Industry Revenue (Million), by Type 2025 & 2033
- Figure 64: South Korea APAC Industrial Valves Industry Volume (K Units), by Type 2025 & 2033
- Figure 65: South Korea APAC Industrial Valves Industry Revenue Share (%), by Type 2025 & 2033
- Figure 66: South Korea APAC Industrial Valves Industry Volume Share (%), by Type 2025 & 2033
- Figure 67: South Korea APAC Industrial Valves Industry Revenue (Million), by Product 2025 & 2033
- Figure 68: South Korea APAC Industrial Valves Industry Volume (K Units), by Product 2025 & 2033
- Figure 69: South Korea APAC Industrial Valves Industry Revenue Share (%), by Product 2025 & 2033
- Figure 70: South Korea APAC Industrial Valves Industry Volume Share (%), by Product 2025 & 2033
- Figure 71: South Korea APAC Industrial Valves Industry Revenue (Million), by Application 2025 & 2033
- Figure 72: South Korea APAC Industrial Valves Industry Volume (K Units), by Application 2025 & 2033
- Figure 73: South Korea APAC Industrial Valves Industry Revenue Share (%), by Application 2025 & 2033
- Figure 74: South Korea APAC Industrial Valves Industry Volume Share (%), by Application 2025 & 2033
- Figure 75: South Korea APAC Industrial Valves Industry Revenue (Million), by Geography 2025 & 2033
- Figure 76: South Korea APAC Industrial Valves Industry Volume (K Units), by Geography 2025 & 2033
- Figure 77: South Korea APAC Industrial Valves Industry Revenue Share (%), by Geography 2025 & 2033
- Figure 78: South Korea APAC Industrial Valves Industry Volume Share (%), by Geography 2025 & 2033
- Figure 79: South Korea APAC Industrial Valves Industry Revenue (Million), by Country 2025 & 2033
- Figure 80: South Korea APAC Industrial Valves Industry Volume (K Units), by Country 2025 & 2033
- Figure 81: South Korea APAC Industrial Valves Industry Revenue Share (%), by Country 2025 & 2033
- Figure 82: South Korea APAC Industrial Valves Industry Volume Share (%), by Country 2025 & 2033
- Figure 83: Malaysia APAC Industrial Valves Industry Revenue (Million), by Type 2025 & 2033
- Figure 84: Malaysia APAC Industrial Valves Industry Volume (K Units), by Type 2025 & 2033
- Figure 85: Malaysia APAC Industrial Valves Industry Revenue Share (%), by Type 2025 & 2033
- Figure 86: Malaysia APAC Industrial Valves Industry Volume Share (%), by Type 2025 & 2033
- Figure 87: Malaysia APAC Industrial Valves Industry Revenue (Million), by Product 2025 & 2033
- Figure 88: Malaysia APAC Industrial Valves Industry Volume (K Units), by Product 2025 & 2033
- Figure 89: Malaysia APAC Industrial Valves Industry Revenue Share (%), by Product 2025 & 2033
- Figure 90: Malaysia APAC Industrial Valves Industry Volume Share (%), by Product 2025 & 2033
- Figure 91: Malaysia APAC Industrial Valves Industry Revenue (Million), by Application 2025 & 2033
- Figure 92: Malaysia APAC Industrial Valves Industry Volume (K Units), by Application 2025 & 2033
- Figure 93: Malaysia APAC Industrial Valves Industry Revenue Share (%), by Application 2025 & 2033
- Figure 94: Malaysia APAC Industrial Valves Industry Volume Share (%), by Application 2025 & 2033
- Figure 95: Malaysia APAC Industrial Valves Industry Revenue (Million), by Geography 2025 & 2033
- Figure 96: Malaysia APAC Industrial Valves Industry Volume (K Units), by Geography 2025 & 2033
- Figure 97: Malaysia APAC Industrial Valves Industry Revenue Share (%), by Geography 2025 & 2033
- Figure 98: Malaysia APAC Industrial Valves Industry Volume Share (%), by Geography 2025 & 2033
- Figure 99: Malaysia APAC Industrial Valves Industry Revenue (Million), by Country 2025 & 2033
- Figure 100: Malaysia APAC Industrial Valves Industry Volume (K Units), by Country 2025 & 2033
- Figure 101: Malaysia APAC Industrial Valves Industry Revenue Share (%), by Country 2025 & 2033
- Figure 102: Malaysia APAC Industrial Valves Industry Volume Share (%), by Country 2025 & 2033
- Figure 103: Thailand APAC Industrial Valves Industry Revenue (Million), by Type 2025 & 2033
- Figure 104: Thailand APAC Industrial Valves Industry Volume (K Units), by Type 2025 & 2033
- Figure 105: Thailand APAC Industrial Valves Industry Revenue Share (%), by Type 2025 & 2033
- Figure 106: Thailand APAC Industrial Valves Industry Volume Share (%), by Type 2025 & 2033
- Figure 107: Thailand APAC Industrial Valves Industry Revenue (Million), by Product 2025 & 2033
- Figure 108: Thailand APAC Industrial Valves Industry Volume (K Units), by Product 2025 & 2033
- Figure 109: Thailand APAC Industrial Valves Industry Revenue Share (%), by Product 2025 & 2033
- Figure 110: Thailand APAC Industrial Valves Industry Volume Share (%), by Product 2025 & 2033
- Figure 111: Thailand APAC Industrial Valves Industry Revenue (Million), by Application 2025 & 2033
- Figure 112: Thailand APAC Industrial Valves Industry Volume (K Units), by Application 2025 & 2033
- Figure 113: Thailand APAC Industrial Valves Industry Revenue Share (%), by Application 2025 & 2033
- Figure 114: Thailand APAC Industrial Valves Industry Volume Share (%), by Application 2025 & 2033
- Figure 115: Thailand APAC Industrial Valves Industry Revenue (Million), by Geography 2025 & 2033
- Figure 116: Thailand APAC Industrial Valves Industry Volume (K Units), by Geography 2025 & 2033
- Figure 117: Thailand APAC Industrial Valves Industry Revenue Share (%), by Geography 2025 & 2033
- Figure 118: Thailand APAC Industrial Valves Industry Volume Share (%), by Geography 2025 & 2033
- Figure 119: Thailand APAC Industrial Valves Industry Revenue (Million), by Country 2025 & 2033
- Figure 120: Thailand APAC Industrial Valves Industry Volume (K Units), by Country 2025 & 2033
- Figure 121: Thailand APAC Industrial Valves Industry Revenue Share (%), by Country 2025 & 2033
- Figure 122: Thailand APAC Industrial Valves Industry Volume Share (%), by Country 2025 & 2033
- Figure 123: Indonesia APAC Industrial Valves Industry Revenue (Million), by Type 2025 & 2033
- Figure 124: Indonesia APAC Industrial Valves Industry Volume (K Units), by Type 2025 & 2033
- Figure 125: Indonesia APAC Industrial Valves Industry Revenue Share (%), by Type 2025 & 2033
- Figure 126: Indonesia APAC Industrial Valves Industry Volume Share (%), by Type 2025 & 2033
- Figure 127: Indonesia APAC Industrial Valves Industry Revenue (Million), by Product 2025 & 2033
- Figure 128: Indonesia APAC Industrial Valves Industry Volume (K Units), by Product 2025 & 2033
- Figure 129: Indonesia APAC Industrial Valves Industry Revenue Share (%), by Product 2025 & 2033
- Figure 130: Indonesia APAC Industrial Valves Industry Volume Share (%), by Product 2025 & 2033
- Figure 131: Indonesia APAC Industrial Valves Industry Revenue (Million), by Application 2025 & 2033
- Figure 132: Indonesia APAC Industrial Valves Industry Volume (K Units), by Application 2025 & 2033
- Figure 133: Indonesia APAC Industrial Valves Industry Revenue Share (%), by Application 2025 & 2033
- Figure 134: Indonesia APAC Industrial Valves Industry Volume Share (%), by Application 2025 & 2033
- Figure 135: Indonesia APAC Industrial Valves Industry Revenue (Million), by Geography 2025 & 2033
- Figure 136: Indonesia APAC Industrial Valves Industry Volume (K Units), by Geography 2025 & 2033
- Figure 137: Indonesia APAC Industrial Valves Industry Revenue Share (%), by Geography 2025 & 2033
- Figure 138: Indonesia APAC Industrial Valves Industry Volume Share (%), by Geography 2025 & 2033
- Figure 139: Indonesia APAC Industrial Valves Industry Revenue (Million), by Country 2025 & 2033
- Figure 140: Indonesia APAC Industrial Valves Industry Volume (K Units), by Country 2025 & 2033
- Figure 141: Indonesia APAC Industrial Valves Industry Revenue Share (%), by Country 2025 & 2033
- Figure 142: Indonesia APAC Industrial Valves Industry Volume Share (%), by Country 2025 & 2033
- Figure 143: Vietnam APAC Industrial Valves Industry Revenue (Million), by Type 2025 & 2033
- Figure 144: Vietnam APAC Industrial Valves Industry Volume (K Units), by Type 2025 & 2033
- Figure 145: Vietnam APAC Industrial Valves Industry Revenue Share (%), by Type 2025 & 2033
- Figure 146: Vietnam APAC Industrial Valves Industry Volume Share (%), by Type 2025 & 2033
- Figure 147: Vietnam APAC Industrial Valves Industry Revenue (Million), by Product 2025 & 2033
- Figure 148: Vietnam APAC Industrial Valves Industry Volume (K Units), by Product 2025 & 2033
- Figure 149: Vietnam APAC Industrial Valves Industry Revenue Share (%), by Product 2025 & 2033
- Figure 150: Vietnam APAC Industrial Valves Industry Volume Share (%), by Product 2025 & 2033
- Figure 151: Vietnam APAC Industrial Valves Industry Revenue (Million), by Application 2025 & 2033
- Figure 152: Vietnam APAC Industrial Valves Industry Volume (K Units), by Application 2025 & 2033
- Figure 153: Vietnam APAC Industrial Valves Industry Revenue Share (%), by Application 2025 & 2033
- Figure 154: Vietnam APAC Industrial Valves Industry Volume Share (%), by Application 2025 & 2033
- Figure 155: Vietnam APAC Industrial Valves Industry Revenue (Million), by Geography 2025 & 2033
- Figure 156: Vietnam APAC Industrial Valves Industry Volume (K Units), by Geography 2025 & 2033
- Figure 157: Vietnam APAC Industrial Valves Industry Revenue Share (%), by Geography 2025 & 2033
- Figure 158: Vietnam APAC Industrial Valves Industry Volume Share (%), by Geography 2025 & 2033
- Figure 159: Vietnam APAC Industrial Valves Industry Revenue (Million), by Country 2025 & 2033
- Figure 160: Vietnam APAC Industrial Valves Industry Volume (K Units), by Country 2025 & 2033
- Figure 161: Vietnam APAC Industrial Valves Industry Revenue Share (%), by Country 2025 & 2033
- Figure 162: Vietnam APAC Industrial Valves Industry Volume Share (%), by Country 2025 & 2033
- Figure 163: Rest of Asia Pacific APAC Industrial Valves Industry Revenue (Million), by Type 2025 & 2033
- Figure 164: Rest of Asia Pacific APAC Industrial Valves Industry Volume (K Units), by Type 2025 & 2033
- Figure 165: Rest of Asia Pacific APAC Industrial Valves Industry Revenue Share (%), by Type 2025 & 2033
- Figure 166: Rest of Asia Pacific APAC Industrial Valves Industry Volume Share (%), by Type 2025 & 2033
- Figure 167: Rest of Asia Pacific APAC Industrial Valves Industry Revenue (Million), by Product 2025 & 2033
- Figure 168: Rest of Asia Pacific APAC Industrial Valves Industry Volume (K Units), by Product 2025 & 2033
- Figure 169: Rest of Asia Pacific APAC Industrial Valves Industry Revenue Share (%), by Product 2025 & 2033
- Figure 170: Rest of Asia Pacific APAC Industrial Valves Industry Volume Share (%), by Product 2025 & 2033
- Figure 171: Rest of Asia Pacific APAC Industrial Valves Industry Revenue (Million), by Application 2025 & 2033
- Figure 172: Rest of Asia Pacific APAC Industrial Valves Industry Volume (K Units), by Application 2025 & 2033
- Figure 173: Rest of Asia Pacific APAC Industrial Valves Industry Revenue Share (%), by Application 2025 & 2033
- Figure 174: Rest of Asia Pacific APAC Industrial Valves Industry Volume Share (%), by Application 2025 & 2033
- Figure 175: Rest of Asia Pacific APAC Industrial Valves Industry Revenue (Million), by Geography 2025 & 2033
- Figure 176: Rest of Asia Pacific APAC Industrial Valves Industry Volume (K Units), by Geography 2025 & 2033
- Figure 177: Rest of Asia Pacific APAC Industrial Valves Industry Revenue Share (%), by Geography 2025 & 2033
- Figure 178: Rest of Asia Pacific APAC Industrial Valves Industry Volume Share (%), by Geography 2025 & 2033
- Figure 179: Rest of Asia Pacific APAC Industrial Valves Industry Revenue (Million), by Country 2025 & 2033
- Figure 180: Rest of Asia Pacific APAC Industrial Valves Industry Volume (K Units), by Country 2025 & 2033
- Figure 181: Rest of Asia Pacific APAC Industrial Valves Industry Revenue Share (%), by Country 2025 & 2033
- Figure 182: Rest of Asia Pacific APAC Industrial Valves Industry Volume Share (%), by Country 2025 & 2033
List of Tables
- Table 1: Global APAC Industrial Valves Industry Revenue Million Forecast, by Type 2020 & 2033
- Table 2: Global APAC Industrial Valves Industry Volume K Units Forecast, by Type 2020 & 2033
- Table 3: Global APAC Industrial Valves Industry Revenue Million Forecast, by Product 2020 & 2033
- Table 4: Global APAC Industrial Valves Industry Volume K Units Forecast, by Product 2020 & 2033
- Table 5: Global APAC Industrial Valves Industry Revenue Million Forecast, by Application 2020 & 2033
- Table 6: Global APAC Industrial Valves Industry Volume K Units Forecast, by Application 2020 & 2033
- Table 7: Global APAC Industrial Valves Industry Revenue Million Forecast, by Geography 2020 & 2033
- Table 8: Global APAC Industrial Valves Industry Volume K Units Forecast, by Geography 2020 & 2033
- Table 9: Global APAC Industrial Valves Industry Revenue Million Forecast, by Region 2020 & 2033
- Table 10: Global APAC Industrial Valves Industry Volume K Units Forecast, by Region 2020 & 2033
- Table 11: Global APAC Industrial Valves Industry Revenue Million Forecast, by Type 2020 & 2033
- Table 12: Global APAC Industrial Valves Industry Volume K Units Forecast, by Type 2020 & 2033
- Table 13: Global APAC Industrial Valves Industry Revenue Million Forecast, by Product 2020 & 2033
- Table 14: Global APAC Industrial Valves Industry Volume K Units Forecast, by Product 2020 & 2033
- Table 15: Global APAC Industrial Valves Industry Revenue Million Forecast, by Application 2020 & 2033
- Table 16: Global APAC Industrial Valves Industry Volume K Units Forecast, by Application 2020 & 2033
- Table 17: Global APAC Industrial Valves Industry Revenue Million Forecast, by Geography 2020 & 2033
- Table 18: Global APAC Industrial Valves Industry Volume K Units Forecast, by Geography 2020 & 2033
- Table 19: Global APAC Industrial Valves Industry Revenue Million Forecast, by Country 2020 & 2033
- Table 20: Global APAC Industrial Valves Industry Volume K Units Forecast, by Country 2020 & 2033
- Table 21: Global APAC Industrial Valves Industry Revenue Million Forecast, by Type 2020 & 2033
- Table 22: Global APAC Industrial Valves Industry Volume K Units Forecast, by Type 2020 & 2033
- Table 23: Global APAC Industrial Valves Industry Revenue Million Forecast, by Product 2020 & 2033
- Table 24: Global APAC Industrial Valves Industry Volume K Units Forecast, by Product 2020 & 2033
- Table 25: Global APAC Industrial Valves Industry Revenue Million Forecast, by Application 2020 & 2033
- Table 26: Global APAC Industrial Valves Industry Volume K Units Forecast, by Application 2020 & 2033
- Table 27: Global APAC Industrial Valves Industry Revenue Million Forecast, by Geography 2020 & 2033
- Table 28: Global APAC Industrial Valves Industry Volume K Units Forecast, by Geography 2020 & 2033
- Table 29: Global APAC Industrial Valves Industry Revenue Million Forecast, by Country 2020 & 2033
- Table 30: Global APAC Industrial Valves Industry Volume K Units Forecast, by Country 2020 & 2033
- Table 31: Global APAC Industrial Valves Industry Revenue Million Forecast, by Type 2020 & 2033
- Table 32: Global APAC Industrial Valves Industry Volume K Units Forecast, by Type 2020 & 2033
- Table 33: Global APAC Industrial Valves Industry Revenue Million Forecast, by Product 2020 & 2033
- Table 34: Global APAC Industrial Valves Industry Volume K Units Forecast, by Product 2020 & 2033
- Table 35: Global APAC Industrial Valves Industry Revenue Million Forecast, by Application 2020 & 2033
- Table 36: Global APAC Industrial Valves Industry Volume K Units Forecast, by Application 2020 & 2033
- Table 37: Global APAC Industrial Valves Industry Revenue Million Forecast, by Geography 2020 & 2033
- Table 38: Global APAC Industrial Valves Industry Volume K Units Forecast, by Geography 2020 & 2033
- Table 39: Global APAC Industrial Valves Industry Revenue Million Forecast, by Country 2020 & 2033
- Table 40: Global APAC Industrial Valves Industry Volume K Units Forecast, by Country 2020 & 2033
- Table 41: Global APAC Industrial Valves Industry Revenue Million Forecast, by Type 2020 & 2033
- Table 42: Global APAC Industrial Valves Industry Volume K Units Forecast, by Type 2020 & 2033
- Table 43: Global APAC Industrial Valves Industry Revenue Million Forecast, by Product 2020 & 2033
- Table 44: Global APAC Industrial Valves Industry Volume K Units Forecast, by Product 2020 & 2033
- Table 45: Global APAC Industrial Valves Industry Revenue Million Forecast, by Application 2020 & 2033
- Table 46: Global APAC Industrial Valves Industry Volume K Units Forecast, by Application 2020 & 2033
- Table 47: Global APAC Industrial Valves Industry Revenue Million Forecast, by Geography 2020 & 2033
- Table 48: Global APAC Industrial Valves Industry Volume K Units Forecast, by Geography 2020 & 2033
- Table 49: Global APAC Industrial Valves Industry Revenue Million Forecast, by Country 2020 & 2033
- Table 50: Global APAC Industrial Valves Industry Volume K Units Forecast, by Country 2020 & 2033
- Table 51: Global APAC Industrial Valves Industry Revenue Million Forecast, by Type 2020 & 2033
- Table 52: Global APAC Industrial Valves Industry Volume K Units Forecast, by Type 2020 & 2033
- Table 53: Global APAC Industrial Valves Industry Revenue Million Forecast, by Product 2020 & 2033
- Table 54: Global APAC Industrial Valves Industry Volume K Units Forecast, by Product 2020 & 2033
- Table 55: Global APAC Industrial Valves Industry Revenue Million Forecast, by Application 2020 & 2033
- Table 56: Global APAC Industrial Valves Industry Volume K Units Forecast, by Application 2020 & 2033
- Table 57: Global APAC Industrial Valves Industry Revenue Million Forecast, by Geography 2020 & 2033
- Table 58: Global APAC Industrial Valves Industry Volume K Units Forecast, by Geography 2020 & 2033
- Table 59: Global APAC Industrial Valves Industry Revenue Million Forecast, by Country 2020 & 2033
- Table 60: Global APAC Industrial Valves Industry Volume K Units Forecast, by Country 2020 & 2033
- Table 61: Global APAC Industrial Valves Industry Revenue Million Forecast, by Type 2020 & 2033
- Table 62: Global APAC Industrial Valves Industry Volume K Units Forecast, by Type 2020 & 2033
- Table 63: Global APAC Industrial Valves Industry Revenue Million Forecast, by Product 2020 & 2033
- Table 64: Global APAC Industrial Valves Industry Volume K Units Forecast, by Product 2020 & 2033
- Table 65: Global APAC Industrial Valves Industry Revenue Million Forecast, by Application 2020 & 2033
- Table 66: Global APAC Industrial Valves Industry Volume K Units Forecast, by Application 2020 & 2033
- Table 67: Global APAC Industrial Valves Industry Revenue Million Forecast, by Geography 2020 & 2033
- Table 68: Global APAC Industrial Valves Industry Volume K Units Forecast, by Geography 2020 & 2033
- Table 69: Global APAC Industrial Valves Industry Revenue Million Forecast, by Country 2020 & 2033
- Table 70: Global APAC Industrial Valves Industry Volume K Units Forecast, by Country 2020 & 2033
- Table 71: Global APAC Industrial Valves Industry Revenue Million Forecast, by Type 2020 & 2033
- Table 72: Global APAC Industrial Valves Industry Volume K Units Forecast, by Type 2020 & 2033
- Table 73: Global APAC Industrial Valves Industry Revenue Million Forecast, by Product 2020 & 2033
- Table 74: Global APAC Industrial Valves Industry Volume K Units Forecast, by Product 2020 & 2033
- Table 75: Global APAC Industrial Valves Industry Revenue Million Forecast, by Application 2020 & 2033
- Table 76: Global APAC Industrial Valves Industry Volume K Units Forecast, by Application 2020 & 2033
- Table 77: Global APAC Industrial Valves Industry Revenue Million Forecast, by Geography 2020 & 2033
- Table 78: Global APAC Industrial Valves Industry Volume K Units Forecast, by Geography 2020 & 2033
- Table 79: Global APAC Industrial Valves Industry Revenue Million Forecast, by Country 2020 & 2033
- Table 80: Global APAC Industrial Valves Industry Volume K Units Forecast, by Country 2020 & 2033
- Table 81: Global APAC Industrial Valves Industry Revenue Million Forecast, by Type 2020 & 2033
- Table 82: Global APAC Industrial Valves Industry Volume K Units Forecast, by Type 2020 & 2033
- Table 83: Global APAC Industrial Valves Industry Revenue Million Forecast, by Product 2020 & 2033
- Table 84: Global APAC Industrial Valves Industry Volume K Units Forecast, by Product 2020 & 2033
- Table 85: Global APAC Industrial Valves Industry Revenue Million Forecast, by Application 2020 & 2033
- Table 86: Global APAC Industrial Valves Industry Volume K Units Forecast, by Application 2020 & 2033
- Table 87: Global APAC Industrial Valves Industry Revenue Million Forecast, by Geography 2020 & 2033
- Table 88: Global APAC Industrial Valves Industry Volume K Units Forecast, by Geography 2020 & 2033
- Table 89: Global APAC Industrial Valves Industry Revenue Million Forecast, by Country 2020 & 2033
- Table 90: Global APAC Industrial Valves Industry Volume K Units Forecast, by Country 2020 & 2033
- Table 91: Global APAC Industrial Valves Industry Revenue Million Forecast, by Type 2020 & 2033
- Table 92: Global APAC Industrial Valves Industry Volume K Units Forecast, by Type 2020 & 2033
- Table 93: Global APAC Industrial Valves Industry Revenue Million Forecast, by Product 2020 & 2033
- Table 94: Global APAC Industrial Valves Industry Volume K Units Forecast, by Product 2020 & 2033
- Table 95: Global APAC Industrial Valves Industry Revenue Million Forecast, by Application 2020 & 2033
- Table 96: Global APAC Industrial Valves Industry Volume K Units Forecast, by Application 2020 & 2033
- Table 97: Global APAC Industrial Valves Industry Revenue Million Forecast, by Geography 2020 & 2033
- Table 98: Global APAC Industrial Valves Industry Volume K Units Forecast, by Geography 2020 & 2033
- Table 99: Global APAC Industrial Valves Industry Revenue Million Forecast, by Country 2020 & 2033
- Table 100: Global APAC Industrial Valves Industry Volume K Units Forecast, by Country 2020 & 2033
Frequently Asked Questions
1. What is the projected Compound Annual Growth Rate (CAGR) of the APAC Industrial Valves Industry?
The projected CAGR is approximately 5.67%.
2. Which companies are prominent players in the APAC Industrial Valves Industry?
Key companies in the market include Alfa Laval, Honeywell International Inc, Danfoss AS, Velan Inc , Okano Valve Mfg Co Ltd, SAMSON AKTIENGESELLSCHAFT, Flowserve Corporation, The Weir Group PLC, Georg Fischer Ltd, Baker Hughes, Emerson Electric Co, CIRCOR International Inc, AVK Holding AS, PARKER HANNIFIN CORP, EBRO ARMATUREN Gebr Brer GmbH, Hitachi Metals Ltd, ITT Inc, NIBCO, IMI Critical Engineering, Crane Co, Valvitalia SpA, Curtiss-Wright Corporation, Schlumberger Limited, KITZ Corporation.
3. What are the main segments of the APAC Industrial Valves Industry?
The market segments include Type, Product, Application, Geography.
4. Can you provide details about the market size?
The market size is estimated to be USD 21.98 Million as of 2022.
5. What are some drivers contributing to market growth?
Increasing Demand for Valves from Water Treatment Plants; Increasing Demand for Valves in the Oil and Gas Industry; Other Drivers.
6. What are the notable trends driving market growth?
Growing Demand in the Oil and Gas Industry.
7. Are there any restraints impacting market growth?
Impact of the COVID-19 Outbreak.
8. Can you provide examples of recent developments in the market?
March 2022: Flowserve announced a partnership with Gradiant to accelerate growth in the water technology market. Gradiant develops and delivers advanced water and wastewater treatment facilities with a primary focus in the Asia Pacific.
9. What pricing options are available for accessing the report?
Pricing options include single-user, multi-user, and enterprise licenses priced at USD 4750, USD 5250, and USD 8750 respectively.
10. Is the market size provided in terms of value or volume?
The market size is provided in terms of value, measured in Million and volume, measured in K Units.
11. Are there any specific market keywords associated with the report?
Yes, the market keyword associated with the report is "APAC Industrial Valves Industry," which aids in identifying and referencing the specific market segment covered.
12. How do I determine which pricing option suits my needs best?
The pricing options vary based on user requirements and access needs. Individual users may opt for single-user licenses, while businesses requiring broader access may choose multi-user or enterprise licenses for cost-effective access to the report.
13. Are there any additional resources or data provided in the APAC Industrial Valves Industry report?
While the report offers comprehensive insights, it's advisable to review the specific contents or supplementary materials provided to ascertain if additional resources or data are available.
14. How can I stay updated on further developments or reports in the APAC Industrial Valves Industry?
To stay informed about further developments, trends, and reports in the APAC Industrial Valves Industry, consider subscribing to industry newsletters, following relevant companies and organizations, or regularly checking reputable industry news sources and publications.
Methodology
Step 1 - Identification of Relevant Samples Size from Population Database


Step 2 - Approaches for Defining Global Market Size (Value, Volume* & Price*)

Note*: In applicable scenarios
Step 3 - Data Sources
Primary Research
- Web Analytics
- Survey Reports
- Research Institute
- Latest Research Reports
- Opinion Leaders
Secondary Research
- Annual Reports
- White Paper
- Latest Press Release
- Industry Association
- Paid Database
- Investor Presentations

Step 4 - Data Triangulation
Involves using different sources of information in order to increase the validity of a study
These sources are likely to be stakeholders in a program - participants, other researchers, program staff, other community members, and so on.
Then we put all data in single framework & apply various statistical tools to find out the dynamic on the market.
During the analysis stage, feedback from the stakeholder groups would be compared to determine areas of agreement as well as areas of divergence