
Key Insights
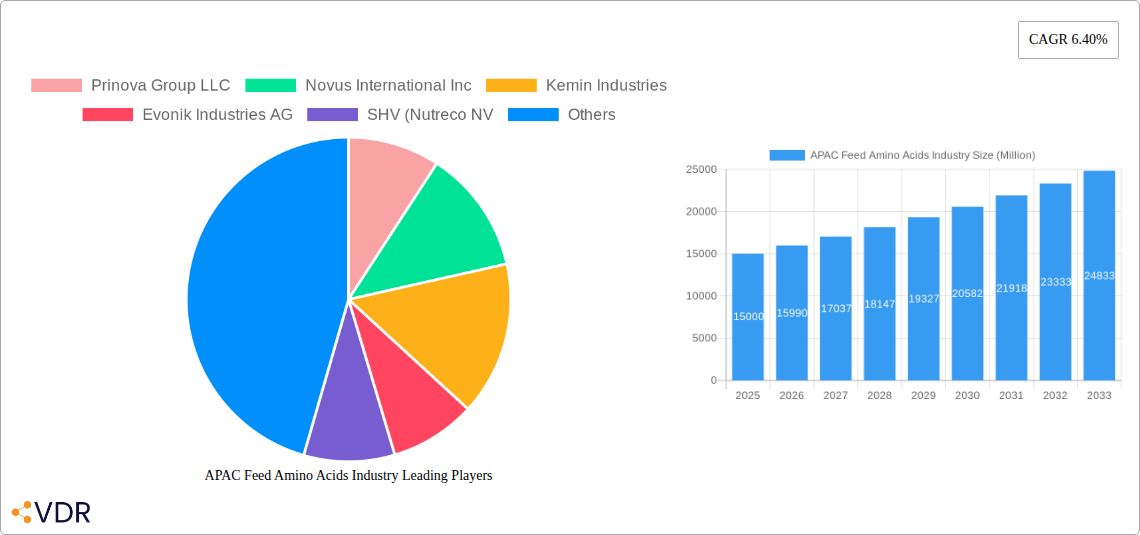
The Asia-Pacific (APAC) feed amino acids market is experiencing robust growth, driven by the increasing demand for animal protein, particularly in rapidly developing economies like China, India, and Southeast Asia. The region's expanding livestock and aquaculture sectors are key contributors to this growth, necessitating higher quantities of essential amino acids like lysine, methionine, and threonine to optimize feed efficiency and animal productivity. Furthermore, rising consumer incomes and changing dietary habits are fueling the demand for meat and seafood, indirectly bolstering the feed amino acid market. The market's segmentation reveals that swine and aquaculture contribute significantly to the overall demand, followed by other ruminants and poultry. While advancements in amino acid production technology and increasing investments in research and development contribute positively, challenges remain, including fluctuating raw material prices and stringent regulatory frameworks concerning feed additives. Competition among established global players and regional manufacturers is intense, leading to strategic partnerships, mergers and acquisitions, and a focus on innovation and product differentiation to maintain market share. Given the projected CAGR of 6.40%, the market is poised for considerable expansion, with significant opportunities for businesses focusing on sustainable and cost-effective solutions.
The forecast period of 2025-2033 presents a promising outlook for the APAC feed amino acids market. Factors like increasing awareness of the importance of balanced animal nutrition, coupled with technological innovations in feed formulation, are expected to propel market growth. However, potential restraints include potential disruptions in global supply chains, environmental concerns related to intensive animal farming, and the need for greater transparency and traceability in feed ingredient sourcing. Companies are strategically investing in improving product quality, expanding their distribution networks, and engaging in effective marketing strategies to reach farmers and feed manufacturers effectively. Geographical expansion within the APAC region, particularly focusing on emerging markets with high growth potential, remains a crucial strategy for success. Long-term market success will hinge on addressing sustainability concerns, adhering to evolving regulations, and providing value-added services to customers across diverse segments.
APAC Feed Amino Acids Industry Market Report: 2019-2033
This comprehensive report provides a detailed analysis of the Asia-Pacific (APAC) feed amino acids market, encompassing market size, growth trends, competitive landscape, and future outlook. The report covers the period from 2019 to 2033, with a base year of 2025 and a forecast period of 2025-2033. It segments the market by animal type (Aquaculture, Other Ruminants, Swine, Other Animals), sub-additive (Lysine, Methionine, Threonine, Tryptophan, Other Amino Acids), and country (Australia, China, India, Indonesia, Japan, Philippines, South Korea, Thailand, Vietnam, Rest of Asia-Pacific). Key players analyzed include Prinova Group LLC, Novus International Inc, Kemin Industries, Evonik Industries AG, SHV (Nutreco NV), Ajinomoto Co Inc, Archer Daniel Midland Co, Lonza Group Ltd, Alltech Inc, and Adisseo.
APAC Feed Amino Acids Industry Market Dynamics & Structure
The APAC feed amino acids market is characterized by moderate concentration, with several multinational corporations and regional players competing. Technological innovation, particularly in production efficiency and novel amino acid formulations, is a key driver. Stringent regulatory frameworks concerning feed safety and environmental impact influence market dynamics. The market faces competition from alternative feed supplements, and M&A activity is shaping the competitive landscape. The study period (2019-2024) witnessed xx M&A deals, resulting in a xx% market share consolidation among top players.
- Market Concentration: Moderately concentrated, with top 5 players holding xx% market share in 2024.
- Technological Innovation: Focus on improving production efficiency, developing novel amino acid formulations, and sustainable production practices.
- Regulatory Frameworks: Increasingly stringent regulations on feed safety and environmental impact.
- Competitive Substitutes: Plant-based protein sources and other feed additives pose competition.
- End-User Demographics: Driven by growing demand for animal protein in rapidly developing economies.
- M&A Trends: Significant consolidation through mergers and acquisitions to enhance market share and product portfolios.
APAC Feed Amino Acids Industry Growth Trends & Insights
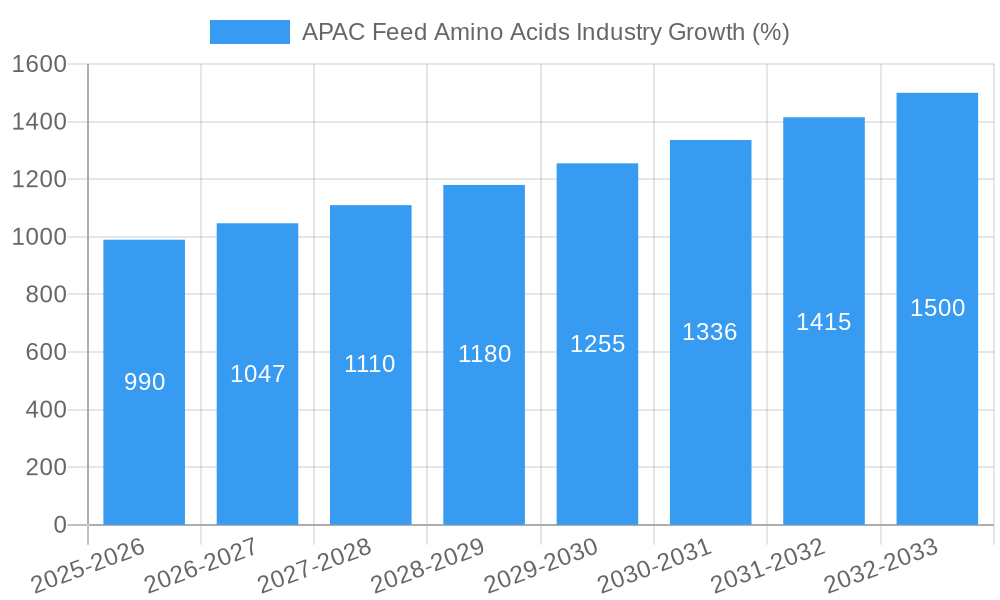
The APAC feed amino acids market experienced significant growth during the historical period (2019-2024), with a CAGR of xx%. This growth is primarily driven by increasing livestock production, rising consumer demand for animal protein, and the adoption of advanced feed formulations. Technological advancements, like precision fermentation and improved amino acid synthesis, are further enhancing market expansion. Shifting consumer preferences towards higher-quality and sustainable protein sources also fuel this expansion. The market is expected to continue its growth trajectory during the forecast period (2025-2033), with a projected CAGR of xx%, reaching a market value of xx Million by 2033. Market penetration of liquid methionine, for example, is significantly impacted by increased production capacity.
Dominant Regions, Countries, or Segments in APAC Feed Amino Acids Industry
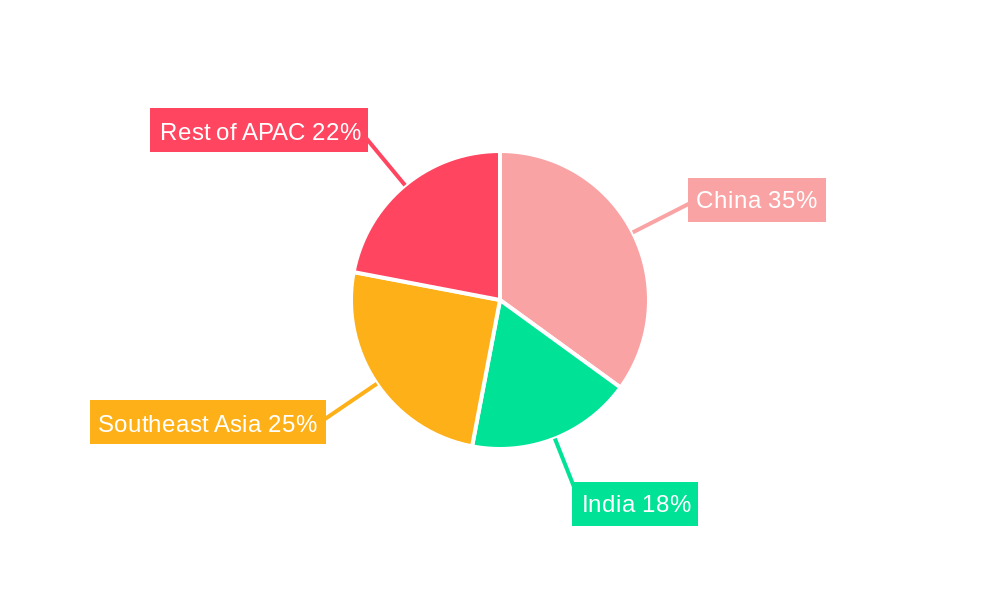
China remains the dominant market in the APAC region, accounting for xx% of the total market share in 2024, followed by India and Indonesia. The swine segment holds the largest market share amongst animal types due to the significant pig population and growing demand for pork in the region. Lysine and methionine are the dominant sub-additives, driven by their widespread application in various animal feed formulations. Growth is fueled by factors such as expanding livestock farming, rising per capita income, and government support for the animal feed industry.
Key Drivers:
- Rapidly growing livestock production in China, India, and other emerging economies.
- Increasing demand for animal protein from a burgeoning middle class.
- Government initiatives promoting livestock farming and aquaculture.
- Investment in feed technology and infrastructure.
Dominance Factors:
- Large livestock populations in China and India.
- High consumption of animal products.
- Favorable government policies supporting agricultural development.
APAC Feed Amino Acids Industry Product Landscape
The APAC feed amino acids market offers a diverse range of products, including crystalline amino acids, liquid amino acids, and premixes. Innovations focus on enhanced bioavailability, improved palatability, and specialized formulations for specific animal species. These advancements aim to optimize animal nutrition, enhance feed efficiency, and promote sustainable animal farming. Key selling propositions revolve around cost-effectiveness, improved animal performance, and environmentally friendly production methods.
Key Drivers, Barriers & Challenges in APAC Feed Amino Acids Industry
Key Drivers: The market is driven by increasing demand for animal protein, growing livestock populations, rising disposable incomes, and government support for the agriculture sector. Technological advancements in production processes and innovative product development also contribute significantly.
Key Challenges: Supply chain disruptions, fluctuating raw material prices, intense competition, and stringent regulatory requirements pose challenges. These factors can impact profitability and market access for industry participants. For instance, xx% of production was impacted by raw material shortages in 2022, leading to a xx% increase in prices.
Emerging Opportunities in APAP Feed Amino Acids Industry
Untapped markets in Southeast Asia, the growing demand for sustainable and organic feed products, and the increasing adoption of precision feeding technologies present lucrative opportunities. Furthermore, the development of specialized amino acid formulations for specific animal needs presents a promising area for growth. The rising interest in animal welfare and the focus on reducing the environmental footprint of animal farming create a demand for innovative and sustainable solutions.
Growth Accelerators in the APAC Feed Amino Acids Industry
Technological breakthroughs in amino acid production, strategic partnerships between feed manufacturers and technology providers, and expanding into new markets, particularly in Southeast Asia, will accelerate growth. Investments in research and development to improve product efficacy and sustainability will further fuel market expansion. Furthermore, the adoption of digital tools and precision agriculture practices will enhance productivity and efficiency across the value chain.
Key Players Shaping the APAC Feed Amino Acids Industry Market
- Prinova Group LLC
- Novus International Inc
- Kemin Industries
- Evonik Industries AG
- SHV (Nutreco NV)
- Ajinomoto Co Inc
- Archer Daniel Midland Co
- Lonza Group Ltd
- Alltech Inc
- Adisseo
Notable Milestones in APAC Feed Amino Acids Industry Sector
- September 2022: Adisseo commissions a new 180,000-ton liquid methionine plant in Nanjing, China, significantly boosting global liquid methionine production capacity.
- October 2022: Evonik and BASF partnership grants Evonik non-exclusive licensing rights to OpteinicsTM, a digital solution enhancing feed industry efficiency and sustainability.
- January 2023: Novus International acquires Agrivida, a biotech company, to further develop innovative feed additives.
In-Depth APAC Feed Amino Acids Industry Market Outlook
The APAC feed amino acids market exhibits substantial growth potential driven by rising demand for animal protein, technological innovation, and favorable government policies. Strategic partnerships, market expansion into less-penetrated regions, and a focus on sustainable production methods will be crucial for long-term success. The market is poised for continued expansion, with significant opportunities for companies that can adapt to evolving consumer preferences and regulatory landscapes.
APAC Feed Amino Acids Industry Segmentation
-
1. Sub Additive
- 1.1. Lysine
- 1.2. Methionine
- 1.3. Threonine
- 1.4. Tryptophan
- 1.5. Other Amino Acids
-
2. Animal
-
2.1. Aquaculture
-
2.1.1. By Sub Animal
- 2.1.1.1. Fish
- 2.1.1.2. Shrimp
- 2.1.1.3. Other Aquaculture Species
-
2.1.1. By Sub Animal
-
2.2. Poultry
- 2.2.1. Broiler
- 2.2.2. Layer
- 2.2.3. Other Poultry Birds
-
2.3. Ruminants
- 2.3.1. Beef Cattle
- 2.3.2. Dairy Cattle
- 2.3.3. Other Ruminants
- 2.4. Swine
- 2.5. Other Animals
-
2.1. Aquaculture
APAC Feed Amino Acids Industry Segmentation By Geography
-
1. North America
- 1.1. United States
- 1.2. Canada
- 1.3. Mexico
-
2. South America
- 2.1. Brazil
- 2.2. Argentina
- 2.3. Rest of South America
-
3. Europe
- 3.1. United Kingdom
- 3.2. Germany
- 3.3. France
- 3.4. Italy
- 3.5. Spain
- 3.6. Russia
- 3.7. Benelux
- 3.8. Nordics
- 3.9. Rest of Europe
-
4. Middle East & Africa
- 4.1. Turkey
- 4.2. Israel
- 4.3. GCC
- 4.4. North Africa
- 4.5. South Africa
- 4.6. Rest of Middle East & Africa
-
5. Asia Pacific
- 5.1. China
- 5.2. India
- 5.3. Japan
- 5.4. South Korea
- 5.5. ASEAN
- 5.6. Oceania
- 5.7. Rest of Asia Pacific
APAC Feed Amino Acids Industry REPORT HIGHLIGHTS
| Aspects | Details |
|---|---|
| Study Period | 2019-2033 |
| Base Year | 2024 |
| Estimated Year | 2025 |
| Forecast Period | 2025-2033 |
| Historical Period | 2019-2024 |
| Growth Rate | CAGR of 6.40% from 2019-2033 |
| Segmentation |
|
Table of Contents
- 1. Introduction
- 1.1. Research Scope
- 1.2. Market Segmentation
- 1.3. Research Methodology
- 1.4. Definitions and Assumptions
- 2. Executive Summary
- 2.1. Introduction
- 3. Market Dynamics
- 3.1. Introduction
- 3.2. Market Drivers
- 3.2.1. Growing Livestock Population; Area Under Forage Production is Increasing; Increasing Demand for Animal Products
- 3.3. Market Restrains
- 3.3.1. Competition Amongst Industries and High Input Prices; Growing Shift Toward Vegan-Based Diet
- 3.4. Market Trends
- 3.4.1. OTHER KEY INDUSTRY TRENDS COVERED IN THE REPORT
- 4. Market Factor Analysis
- 4.1. Porters Five Forces
- 4.2. Supply/Value Chain
- 4.3. PESTEL analysis
- 4.4. Market Entropy
- 4.5. Patent/Trademark Analysis
- 5. Global APAC Feed Amino Acids Industry Analysis, Insights and Forecast, 2019-2031
- 5.1. Market Analysis, Insights and Forecast - by Sub Additive
- 5.1.1. Lysine
- 5.1.2. Methionine
- 5.1.3. Threonine
- 5.1.4. Tryptophan
- 5.1.5. Other Amino Acids
- 5.2. Market Analysis, Insights and Forecast - by Animal
- 5.2.1. Aquaculture
- 5.2.1.1. By Sub Animal
- 5.2.1.1.1. Fish
- 5.2.1.1.2. Shrimp
- 5.2.1.1.3. Other Aquaculture Species
- 5.2.1.1. By Sub Animal
- 5.2.2. Poultry
- 5.2.2.1. Broiler
- 5.2.2.2. Layer
- 5.2.2.3. Other Poultry Birds
- 5.2.3. Ruminants
- 5.2.3.1. Beef Cattle
- 5.2.3.2. Dairy Cattle
- 5.2.3.3. Other Ruminants
- 5.2.4. Swine
- 5.2.5. Other Animals
- 5.2.1. Aquaculture
- 5.3. Market Analysis, Insights and Forecast - by Region
- 5.3.1. North America
- 5.3.2. South America
- 5.3.3. Europe
- 5.3.4. Middle East & Africa
- 5.3.5. Asia Pacific
- 5.1. Market Analysis, Insights and Forecast - by Sub Additive
- 6. North America APAC Feed Amino Acids Industry Analysis, Insights and Forecast, 2019-2031
- 6.1. Market Analysis, Insights and Forecast - by Sub Additive
- 6.1.1. Lysine
- 6.1.2. Methionine
- 6.1.3. Threonine
- 6.1.4. Tryptophan
- 6.1.5. Other Amino Acids
- 6.2. Market Analysis, Insights and Forecast - by Animal
- 6.2.1. Aquaculture
- 6.2.1.1. By Sub Animal
- 6.2.1.1.1. Fish
- 6.2.1.1.2. Shrimp
- 6.2.1.1.3. Other Aquaculture Species
- 6.2.1.1. By Sub Animal
- 6.2.2. Poultry
- 6.2.2.1. Broiler
- 6.2.2.2. Layer
- 6.2.2.3. Other Poultry Birds
- 6.2.3. Ruminants
- 6.2.3.1. Beef Cattle
- 6.2.3.2. Dairy Cattle
- 6.2.3.3. Other Ruminants
- 6.2.4. Swine
- 6.2.5. Other Animals
- 6.2.1. Aquaculture
- 6.1. Market Analysis, Insights and Forecast - by Sub Additive
- 7. South America APAC Feed Amino Acids Industry Analysis, Insights and Forecast, 2019-2031
- 7.1. Market Analysis, Insights and Forecast - by Sub Additive
- 7.1.1. Lysine
- 7.1.2. Methionine
- 7.1.3. Threonine
- 7.1.4. Tryptophan
- 7.1.5. Other Amino Acids
- 7.2. Market Analysis, Insights and Forecast - by Animal
- 7.2.1. Aquaculture
- 7.2.1.1. By Sub Animal
- 7.2.1.1.1. Fish
- 7.2.1.1.2. Shrimp
- 7.2.1.1.3. Other Aquaculture Species
- 7.2.1.1. By Sub Animal
- 7.2.2. Poultry
- 7.2.2.1. Broiler
- 7.2.2.2. Layer
- 7.2.2.3. Other Poultry Birds
- 7.2.3. Ruminants
- 7.2.3.1. Beef Cattle
- 7.2.3.2. Dairy Cattle
- 7.2.3.3. Other Ruminants
- 7.2.4. Swine
- 7.2.5. Other Animals
- 7.2.1. Aquaculture
- 7.1. Market Analysis, Insights and Forecast - by Sub Additive
- 8. Europe APAC Feed Amino Acids Industry Analysis, Insights and Forecast, 2019-2031
- 8.1. Market Analysis, Insights and Forecast - by Sub Additive
- 8.1.1. Lysine
- 8.1.2. Methionine
- 8.1.3. Threonine
- 8.1.4. Tryptophan
- 8.1.5. Other Amino Acids
- 8.2. Market Analysis, Insights and Forecast - by Animal
- 8.2.1. Aquaculture
- 8.2.1.1. By Sub Animal
- 8.2.1.1.1. Fish
- 8.2.1.1.2. Shrimp
- 8.2.1.1.3. Other Aquaculture Species
- 8.2.1.1. By Sub Animal
- 8.2.2. Poultry
- 8.2.2.1. Broiler
- 8.2.2.2. Layer
- 8.2.2.3. Other Poultry Birds
- 8.2.3. Ruminants
- 8.2.3.1. Beef Cattle
- 8.2.3.2. Dairy Cattle
- 8.2.3.3. Other Ruminants
- 8.2.4. Swine
- 8.2.5. Other Animals
- 8.2.1. Aquaculture
- 8.1. Market Analysis, Insights and Forecast - by Sub Additive
- 9. Middle East & Africa APAC Feed Amino Acids Industry Analysis, Insights and Forecast, 2019-2031
- 9.1. Market Analysis, Insights and Forecast - by Sub Additive
- 9.1.1. Lysine
- 9.1.2. Methionine
- 9.1.3. Threonine
- 9.1.4. Tryptophan
- 9.1.5. Other Amino Acids
- 9.2. Market Analysis, Insights and Forecast - by Animal
- 9.2.1. Aquaculture
- 9.2.1.1. By Sub Animal
- 9.2.1.1.1. Fish
- 9.2.1.1.2. Shrimp
- 9.2.1.1.3. Other Aquaculture Species
- 9.2.1.1. By Sub Animal
- 9.2.2. Poultry
- 9.2.2.1. Broiler
- 9.2.2.2. Layer
- 9.2.2.3. Other Poultry Birds
- 9.2.3. Ruminants
- 9.2.3.1. Beef Cattle
- 9.2.3.2. Dairy Cattle
- 9.2.3.3. Other Ruminants
- 9.2.4. Swine
- 9.2.5. Other Animals
- 9.2.1. Aquaculture
- 9.1. Market Analysis, Insights and Forecast - by Sub Additive
- 10. Asia Pacific APAC Feed Amino Acids Industry Analysis, Insights and Forecast, 2019-2031
- 10.1. Market Analysis, Insights and Forecast - by Sub Additive
- 10.1.1. Lysine
- 10.1.2. Methionine
- 10.1.3. Threonine
- 10.1.4. Tryptophan
- 10.1.5. Other Amino Acids
- 10.2. Market Analysis, Insights and Forecast - by Animal
- 10.2.1. Aquaculture
- 10.2.1.1. By Sub Animal
- 10.2.1.1.1. Fish
- 10.2.1.1.2. Shrimp
- 10.2.1.1.3. Other Aquaculture Species
- 10.2.1.1. By Sub Animal
- 10.2.2. Poultry
- 10.2.2.1. Broiler
- 10.2.2.2. Layer
- 10.2.2.3. Other Poultry Birds
- 10.2.3. Ruminants
- 10.2.3.1. Beef Cattle
- 10.2.3.2. Dairy Cattle
- 10.2.3.3. Other Ruminants
- 10.2.4. Swine
- 10.2.5. Other Animals
- 10.2.1. Aquaculture
- 10.1. Market Analysis, Insights and Forecast - by Sub Additive
- 11. Competitive Analysis
- 11.1. Global Market Share Analysis 2024
- 11.2. Company Profiles
- 11.2.1 Prinova Group LLC
- 11.2.1.1. Overview
- 11.2.1.2. Products
- 11.2.1.3. SWOT Analysis
- 11.2.1.4. Recent Developments
- 11.2.1.5. Financials (Based on Availability)
- 11.2.2 Novus International Inc
- 11.2.2.1. Overview
- 11.2.2.2. Products
- 11.2.2.3. SWOT Analysis
- 11.2.2.4. Recent Developments
- 11.2.2.5. Financials (Based on Availability)
- 11.2.3 Kemin Industries
- 11.2.3.1. Overview
- 11.2.3.2. Products
- 11.2.3.3. SWOT Analysis
- 11.2.3.4. Recent Developments
- 11.2.3.5. Financials (Based on Availability)
- 11.2.4 Evonik Industries AG
- 11.2.4.1. Overview
- 11.2.4.2. Products
- 11.2.4.3. SWOT Analysis
- 11.2.4.4. Recent Developments
- 11.2.4.5. Financials (Based on Availability)
- 11.2.5 SHV (Nutreco NV
- 11.2.5.1. Overview
- 11.2.5.2. Products
- 11.2.5.3. SWOT Analysis
- 11.2.5.4. Recent Developments
- 11.2.5.5. Financials (Based on Availability)
- 11.2.6 Ajinomoto Co Inc
- 11.2.6.1. Overview
- 11.2.6.2. Products
- 11.2.6.3. SWOT Analysis
- 11.2.6.4. Recent Developments
- 11.2.6.5. Financials (Based on Availability)
- 11.2.7 Archer Daniel Midland Co
- 11.2.7.1. Overview
- 11.2.7.2. Products
- 11.2.7.3. SWOT Analysis
- 11.2.7.4. Recent Developments
- 11.2.7.5. Financials (Based on Availability)
- 11.2.8 Lonza Group Ltd
- 11.2.8.1. Overview
- 11.2.8.2. Products
- 11.2.8.3. SWOT Analysis
- 11.2.8.4. Recent Developments
- 11.2.8.5. Financials (Based on Availability)
- 11.2.9 Alltech Inc
- 11.2.9.1. Overview
- 11.2.9.2. Products
- 11.2.9.3. SWOT Analysis
- 11.2.9.4. Recent Developments
- 11.2.9.5. Financials (Based on Availability)
- 11.2.10 Adisseo
- 11.2.10.1. Overview
- 11.2.10.2. Products
- 11.2.10.3. SWOT Analysis
- 11.2.10.4. Recent Developments
- 11.2.10.5. Financials (Based on Availability)
- 11.2.1 Prinova Group LLC
List of Figures
- Figure 1: Global APAC Feed Amino Acids Industry Revenue Breakdown (Million, %) by Region 2024 & 2032
- Figure 2: North America APAC Feed Amino Acids Industry Revenue (Million), by Sub Additive 2024 & 2032
- Figure 3: North America APAC Feed Amino Acids Industry Revenue Share (%), by Sub Additive 2024 & 2032
- Figure 4: North America APAC Feed Amino Acids Industry Revenue (Million), by Animal 2024 & 2032
- Figure 5: North America APAC Feed Amino Acids Industry Revenue Share (%), by Animal 2024 & 2032
- Figure 6: North America APAC Feed Amino Acids Industry Revenue (Million), by Country 2024 & 2032
- Figure 7: North America APAC Feed Amino Acids Industry Revenue Share (%), by Country 2024 & 2032
- Figure 8: South America APAC Feed Amino Acids Industry Revenue (Million), by Sub Additive 2024 & 2032
- Figure 9: South America APAC Feed Amino Acids Industry Revenue Share (%), by Sub Additive 2024 & 2032
- Figure 10: South America APAC Feed Amino Acids Industry Revenue (Million), by Animal 2024 & 2032
- Figure 11: South America APAC Feed Amino Acids Industry Revenue Share (%), by Animal 2024 & 2032
- Figure 12: South America APAC Feed Amino Acids Industry Revenue (Million), by Country 2024 & 2032
- Figure 13: South America APAC Feed Amino Acids Industry Revenue Share (%), by Country 2024 & 2032
- Figure 14: Europe APAC Feed Amino Acids Industry Revenue (Million), by Sub Additive 2024 & 2032
- Figure 15: Europe APAC Feed Amino Acids Industry Revenue Share (%), by Sub Additive 2024 & 2032
- Figure 16: Europe APAC Feed Amino Acids Industry Revenue (Million), by Animal 2024 & 2032
- Figure 17: Europe APAC Feed Amino Acids Industry Revenue Share (%), by Animal 2024 & 2032
- Figure 18: Europe APAC Feed Amino Acids Industry Revenue (Million), by Country 2024 & 2032
- Figure 19: Europe APAC Feed Amino Acids Industry Revenue Share (%), by Country 2024 & 2032
- Figure 20: Middle East & Africa APAC Feed Amino Acids Industry Revenue (Million), by Sub Additive 2024 & 2032
- Figure 21: Middle East & Africa APAC Feed Amino Acids Industry Revenue Share (%), by Sub Additive 2024 & 2032
- Figure 22: Middle East & Africa APAC Feed Amino Acids Industry Revenue (Million), by Animal 2024 & 2032
- Figure 23: Middle East & Africa APAC Feed Amino Acids Industry Revenue Share (%), by Animal 2024 & 2032
- Figure 24: Middle East & Africa APAC Feed Amino Acids Industry Revenue (Million), by Country 2024 & 2032
- Figure 25: Middle East & Africa APAC Feed Amino Acids Industry Revenue Share (%), by Country 2024 & 2032
- Figure 26: Asia Pacific APAC Feed Amino Acids Industry Revenue (Million), by Sub Additive 2024 & 2032
- Figure 27: Asia Pacific APAC Feed Amino Acids Industry Revenue Share (%), by Sub Additive 2024 & 2032
- Figure 28: Asia Pacific APAC Feed Amino Acids Industry Revenue (Million), by Animal 2024 & 2032
- Figure 29: Asia Pacific APAC Feed Amino Acids Industry Revenue Share (%), by Animal 2024 & 2032
- Figure 30: Asia Pacific APAC Feed Amino Acids Industry Revenue (Million), by Country 2024 & 2032
- Figure 31: Asia Pacific APAC Feed Amino Acids Industry Revenue Share (%), by Country 2024 & 2032
List of Tables
- Table 1: Global APAC Feed Amino Acids Industry Revenue Million Forecast, by Region 2019 & 2032
- Table 2: Global APAC Feed Amino Acids Industry Revenue Million Forecast, by Sub Additive 2019 & 2032
- Table 3: Global APAC Feed Amino Acids Industry Revenue Million Forecast, by Animal 2019 & 2032
- Table 4: Global APAC Feed Amino Acids Industry Revenue Million Forecast, by Region 2019 & 2032
- Table 5: Global APAC Feed Amino Acids Industry Revenue Million Forecast, by Sub Additive 2019 & 2032
- Table 6: Global APAC Feed Amino Acids Industry Revenue Million Forecast, by Animal 2019 & 2032
- Table 7: Global APAC Feed Amino Acids Industry Revenue Million Forecast, by Country 2019 & 2032
- Table 8: United States APAC Feed Amino Acids Industry Revenue (Million) Forecast, by Application 2019 & 2032
- Table 9: Canada APAC Feed Amino Acids Industry Revenue (Million) Forecast, by Application 2019 & 2032
- Table 10: Mexico APAC Feed Amino Acids Industry Revenue (Million) Forecast, by Application 2019 & 2032
- Table 11: Global APAC Feed Amino Acids Industry Revenue Million Forecast, by Sub Additive 2019 & 2032
- Table 12: Global APAC Feed Amino Acids Industry Revenue Million Forecast, by Animal 2019 & 2032
- Table 13: Global APAC Feed Amino Acids Industry Revenue Million Forecast, by Country 2019 & 2032
- Table 14: Brazil APAC Feed Amino Acids Industry Revenue (Million) Forecast, by Application 2019 & 2032
- Table 15: Argentina APAC Feed Amino Acids Industry Revenue (Million) Forecast, by Application 2019 & 2032
- Table 16: Rest of South America APAC Feed Amino Acids Industry Revenue (Million) Forecast, by Application 2019 & 2032
- Table 17: Global APAC Feed Amino Acids Industry Revenue Million Forecast, by Sub Additive 2019 & 2032
- Table 18: Global APAC Feed Amino Acids Industry Revenue Million Forecast, by Animal 2019 & 2032
- Table 19: Global APAC Feed Amino Acids Industry Revenue Million Forecast, by Country 2019 & 2032
- Table 20: United Kingdom APAC Feed Amino Acids Industry Revenue (Million) Forecast, by Application 2019 & 2032
- Table 21: Germany APAC Feed Amino Acids Industry Revenue (Million) Forecast, by Application 2019 & 2032
- Table 22: France APAC Feed Amino Acids Industry Revenue (Million) Forecast, by Application 2019 & 2032
- Table 23: Italy APAC Feed Amino Acids Industry Revenue (Million) Forecast, by Application 2019 & 2032
- Table 24: Spain APAC Feed Amino Acids Industry Revenue (Million) Forecast, by Application 2019 & 2032
- Table 25: Russia APAC Feed Amino Acids Industry Revenue (Million) Forecast, by Application 2019 & 2032
- Table 26: Benelux APAC Feed Amino Acids Industry Revenue (Million) Forecast, by Application 2019 & 2032
- Table 27: Nordics APAC Feed Amino Acids Industry Revenue (Million) Forecast, by Application 2019 & 2032
- Table 28: Rest of Europe APAC Feed Amino Acids Industry Revenue (Million) Forecast, by Application 2019 & 2032
- Table 29: Global APAC Feed Amino Acids Industry Revenue Million Forecast, by Sub Additive 2019 & 2032
- Table 30: Global APAC Feed Amino Acids Industry Revenue Million Forecast, by Animal 2019 & 2032
- Table 31: Global APAC Feed Amino Acids Industry Revenue Million Forecast, by Country 2019 & 2032
- Table 32: Turkey APAC Feed Amino Acids Industry Revenue (Million) Forecast, by Application 2019 & 2032
- Table 33: Israel APAC Feed Amino Acids Industry Revenue (Million) Forecast, by Application 2019 & 2032
- Table 34: GCC APAC Feed Amino Acids Industry Revenue (Million) Forecast, by Application 2019 & 2032
- Table 35: North Africa APAC Feed Amino Acids Industry Revenue (Million) Forecast, by Application 2019 & 2032
- Table 36: South Africa APAC Feed Amino Acids Industry Revenue (Million) Forecast, by Application 2019 & 2032
- Table 37: Rest of Middle East & Africa APAC Feed Amino Acids Industry Revenue (Million) Forecast, by Application 2019 & 2032
- Table 38: Global APAC Feed Amino Acids Industry Revenue Million Forecast, by Sub Additive 2019 & 2032
- Table 39: Global APAC Feed Amino Acids Industry Revenue Million Forecast, by Animal 2019 & 2032
- Table 40: Global APAC Feed Amino Acids Industry Revenue Million Forecast, by Country 2019 & 2032
- Table 41: China APAC Feed Amino Acids Industry Revenue (Million) Forecast, by Application 2019 & 2032
- Table 42: India APAC Feed Amino Acids Industry Revenue (Million) Forecast, by Application 2019 & 2032
- Table 43: Japan APAC Feed Amino Acids Industry Revenue (Million) Forecast, by Application 2019 & 2032
- Table 44: South Korea APAC Feed Amino Acids Industry Revenue (Million) Forecast, by Application 2019 & 2032
- Table 45: ASEAN APAC Feed Amino Acids Industry Revenue (Million) Forecast, by Application 2019 & 2032
- Table 46: Oceania APAC Feed Amino Acids Industry Revenue (Million) Forecast, by Application 2019 & 2032
- Table 47: Rest of Asia Pacific APAC Feed Amino Acids Industry Revenue (Million) Forecast, by Application 2019 & 2032
Frequently Asked Questions
1. What is the projected Compound Annual Growth Rate (CAGR) of the APAC Feed Amino Acids Industry?
The projected CAGR is approximately 6.40%.
2. Which companies are prominent players in the APAC Feed Amino Acids Industry?
Key companies in the market include Prinova Group LLC, Novus International Inc, Kemin Industries, Evonik Industries AG, SHV (Nutreco NV, Ajinomoto Co Inc, Archer Daniel Midland Co, Lonza Group Ltd, Alltech Inc, Adisseo.
3. What are the main segments of the APAC Feed Amino Acids Industry?
The market segments include Sub Additive, Animal.
4. Can you provide details about the market size?
The market size is estimated to be USD XX Million as of 2022.
5. What are some drivers contributing to market growth?
Growing Livestock Population; Area Under Forage Production is Increasing; Increasing Demand for Animal Products.
6. What are the notable trends driving market growth?
OTHER KEY INDUSTRY TRENDS COVERED IN THE REPORT.
7. Are there any restraints impacting market growth?
Competition Amongst Industries and High Input Prices; Growing Shift Toward Vegan-Based Diet.
8. Can you provide examples of recent developments in the market?
January 2023: Novus International acquired the Biotech company Agrivida to develop new feed additives.October 2022: The partnership between Evonik and BASF allowed Evonik certain non-exclusive licensing rights to OpteinicsTM, a digital solution to improve comprehension and reduce the environmental impact of the animal protein and feed industries.September 2022: The new 180,000-ton liquid methionine plant of Adisseo in Nanjing, China, started production. The facility is one of the largest global liquid methionine production capacities that boosted the penetration of liquid methionine manufactured by the company in the global market.
9. What pricing options are available for accessing the report?
Pricing options include single-user, multi-user, and enterprise licenses priced at USD 3800, USD 4500, and USD 5800 respectively.
10. Is the market size provided in terms of value or volume?
The market size is provided in terms of value, measured in Million.
11. Are there any specific market keywords associated with the report?
Yes, the market keyword associated with the report is "APAC Feed Amino Acids Industry," which aids in identifying and referencing the specific market segment covered.
12. How do I determine which pricing option suits my needs best?
The pricing options vary based on user requirements and access needs. Individual users may opt for single-user licenses, while businesses requiring broader access may choose multi-user or enterprise licenses for cost-effective access to the report.
13. Are there any additional resources or data provided in the APAC Feed Amino Acids Industry report?
While the report offers comprehensive insights, it's advisable to review the specific contents or supplementary materials provided to ascertain if additional resources or data are available.
14. How can I stay updated on further developments or reports in the APAC Feed Amino Acids Industry?
To stay informed about further developments, trends, and reports in the APAC Feed Amino Acids Industry, consider subscribing to industry newsletters, following relevant companies and organizations, or regularly checking reputable industry news sources and publications.
Methodology
Step 1 - Identification of Relevant Samples Size from Population Database


Step 2 - Approaches for Defining Global Market Size (Value, Volume* & Price*)

Note*: In applicable scenarios
Step 3 - Data Sources
Primary Research
- Web Analytics
- Survey Reports
- Research Institute
- Latest Research Reports
- Opinion Leaders
Secondary Research
- Annual Reports
- White Paper
- Latest Press Release
- Industry Association
- Paid Database
- Investor Presentations

Step 4 - Data Triangulation
Involves using different sources of information in order to increase the validity of a study
These sources are likely to be stakeholders in a program - participants, other researchers, program staff, other community members, and so on.
Then we put all data in single framework & apply various statistical tools to find out the dynamic on the market.
During the analysis stage, feedback from the stakeholder groups would be compared to determine areas of agreement as well as areas of divergence


