

Key Insights
The APAC Continuous Glucose Monitoring (CGM) industry is poised for exceptional growth, projected to reach $12.4 billion in 2025. This robust expansion is driven by a CAGR of 18.7% throughout the forecast period of 2025-2033. The market's dynamism is fueled by several key factors, including increasing awareness of diabetes management, a rising prevalence of diabetes across the region, and significant technological advancements in CGM devices. These innovations are leading to more accurate, user-friendly, and integrated systems, making CGM more accessible and appealing to both patients and healthcare providers. Furthermore, favorable reimbursement policies and growing health expenditure in emerging economies within APAC are contributing to higher adoption rates. The increasing adoption of wearable technology and the growing demand for remote patient monitoring solutions further bolster the market's upward trajectory.
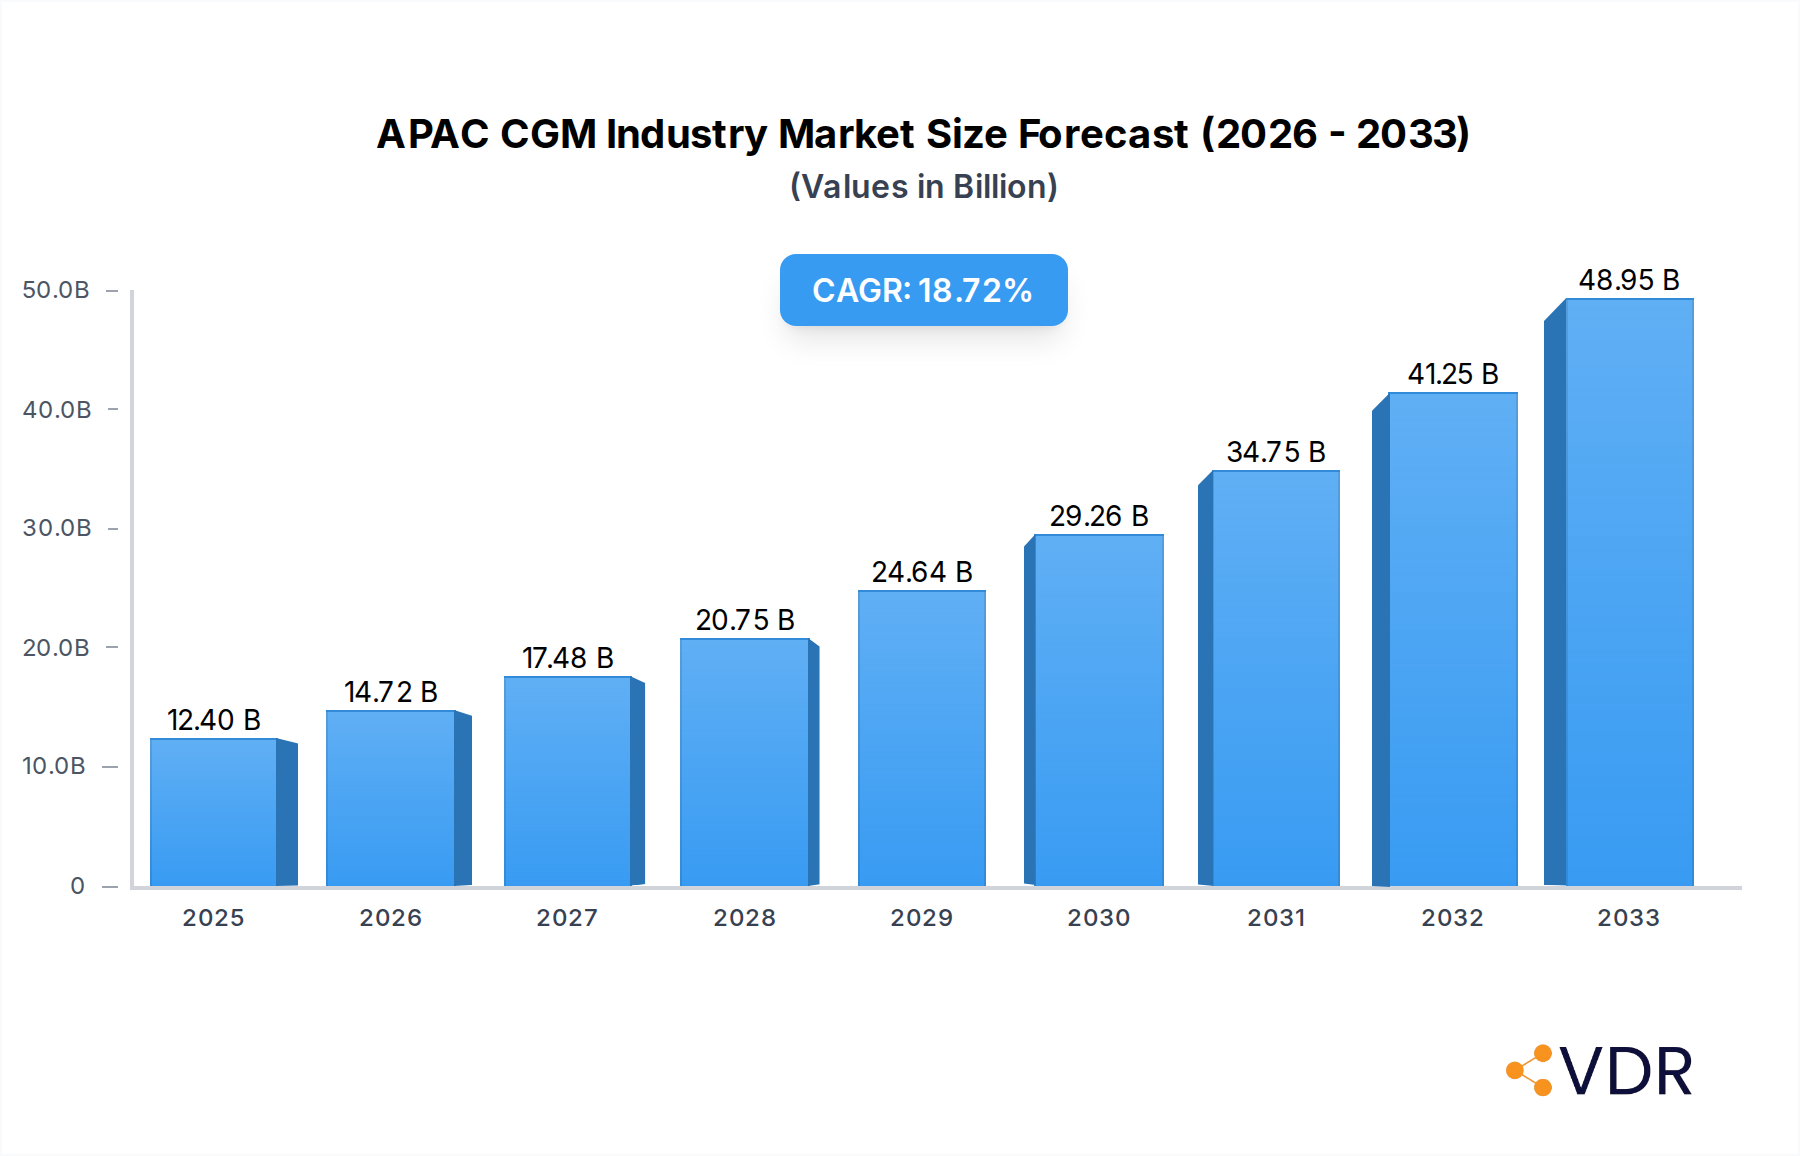
APAC CGM Industry Market Size (In Billion)
The competitive landscape features key players like Medtronics, Eversense, Abbott, Ascensia, and Dexcom, all actively innovating and expanding their presence across diverse geographies such as China, India, Japan, and South Korea. The market is segmented by components, with sensors and durables being critical. Geographically, while established markets like Japan and South Korea show strong adoption, rapidly developing nations like China and India represent substantial untapped potential due to their large populations and increasing diabetes burden. The market is expected to witness a surge in demand for integrated CGM systems that seamlessly connect with insulin pumps and other digital health platforms, enabling more personalized and proactive diabetes management strategies. The growing focus on preventive healthcare and the shift towards value-based care models are also expected to accelerate CGM adoption across the APAC region.

APAC CGM Industry Company Market Share
Unlocking the APAC Continuous Glucose Monitoring (CGM) Market: A Comprehensive Growth Forecast (2019-2033)
This in-depth report provides a critical analysis of the Asia-Pacific (APAC) Continuous Glucose Monitoring (CGM) industry, a rapidly expanding sector driven by increasing diabetes prevalence, technological advancements, and favorable reimbursement policies. With a comprehensive study period from 2019 to 2033, a base year of 2025, and a detailed forecast period from 2025 to 2033, this report offers unparalleled insights into market dynamics, growth trends, regional dominance, product innovations, key drivers, barriers, emerging opportunities, growth accelerators, and the competitive landscape. Discover the immense potential of this burgeoning market, from parent markets of diabetes care and wearable technology to child markets focused on specific sensor technologies and durable hardware.
APAC CGM Industry Market Dynamics & Structure
The APAC CGM market is characterized by a dynamic interplay of technological innovation, evolving regulatory frameworks, and a growing understanding of the benefits of continuous glucose monitoring. Market concentration is gradually shifting as established players like Abbott, Dexcom, and Medtronic compete with emerging innovators such as Eversense. Technological innovation is primarily driven by the miniaturization of sensors, improved accuracy, enhanced data analytics, and the integration of CGM systems with insulin delivery devices, fostering a market ripe for disruption. Regulatory landscapes across APAC nations are becoming more streamlined, with key markets like Japan and South Korea leading in establishing clear guidelines for CGM device approval and reimbursement, though significant variations persist across the region. Competitive product substitutes, including traditional blood glucose meters, still hold a considerable presence, but their limitations in providing real-time trends are increasingly pushing users towards CGM. End-user demographics are expanding beyond Type 1 diabetes patients to encompass individuals with Type 2 diabetes requiring intensive insulin management, as well as gestational diabetes and pre-diabetes. Mergers and acquisitions (M&A) activity, while not yet as pronounced as in Western markets, is anticipated to increase as larger companies seek to consolidate their market position and acquire innovative technologies.
- Market Concentration: Moderate to high, with key global players holding significant shares.
- Technological Innovation Drivers: Sensor accuracy, extended wear time, wireless connectivity, AI-driven insights, and smartphone integration.
- Regulatory Frameworks: Varied, with improving clarity in developed markets and developing frameworks in emerging economies.
- Competitive Product Substitutes: Traditional blood glucose meters, intermittent scanning devices.
- End-User Demographics: Growing inclusion of Type 2 diabetes, gestational diabetes, and individuals seeking proactive health management.
- M&A Trends: Anticipated to rise as market consolidation and technology acquisition become strategic imperatives.
APAC CGM Industry Growth Trends & Insights
The APAC CGM industry is poised for remarkable growth, propelled by a confluence of factors that are reshaping diabetes management across the region. The market size is projected to expand from an estimated $1.5 billion in 2024 to a substantial $5.2 billion by 2033, exhibiting a Compound Annual Growth Rate (CAGR) of approximately 15%. This impressive expansion is fueled by increasing adoption rates, which are being significantly influenced by rising diabetes prevalence rates, estimated to affect over 250 million individuals across APAC by 2030. Technological disruptions, such as the development of factory-calibrated sensors and the integration of CGM data into smartwatches and mobile health applications, are further accelerating market penetration. Consumer behavior shifts are evident, with a growing demand for personalized health solutions and a greater willingness to invest in wearable technology for chronic disease management. The accessibility of CGM devices is also improving, driven by decreasing manufacturing costs and expanding reimbursement coverage in key markets. The shift from reactive to proactive diabetes management, where individuals and healthcare providers leverage real-time data to make informed decisions, is a critical trend underpinning this growth trajectory. Furthermore, the growing awareness of the long-term complications of uncontrolled diabetes and the significant healthcare burden associated with it are compelling governments and healthcare systems to invest more in advanced diabetes management technologies like CGM. This surge in adoption is not uniform, with significant regional variations dictating the pace of growth, influenced by economic development, healthcare infrastructure, and public health initiatives.
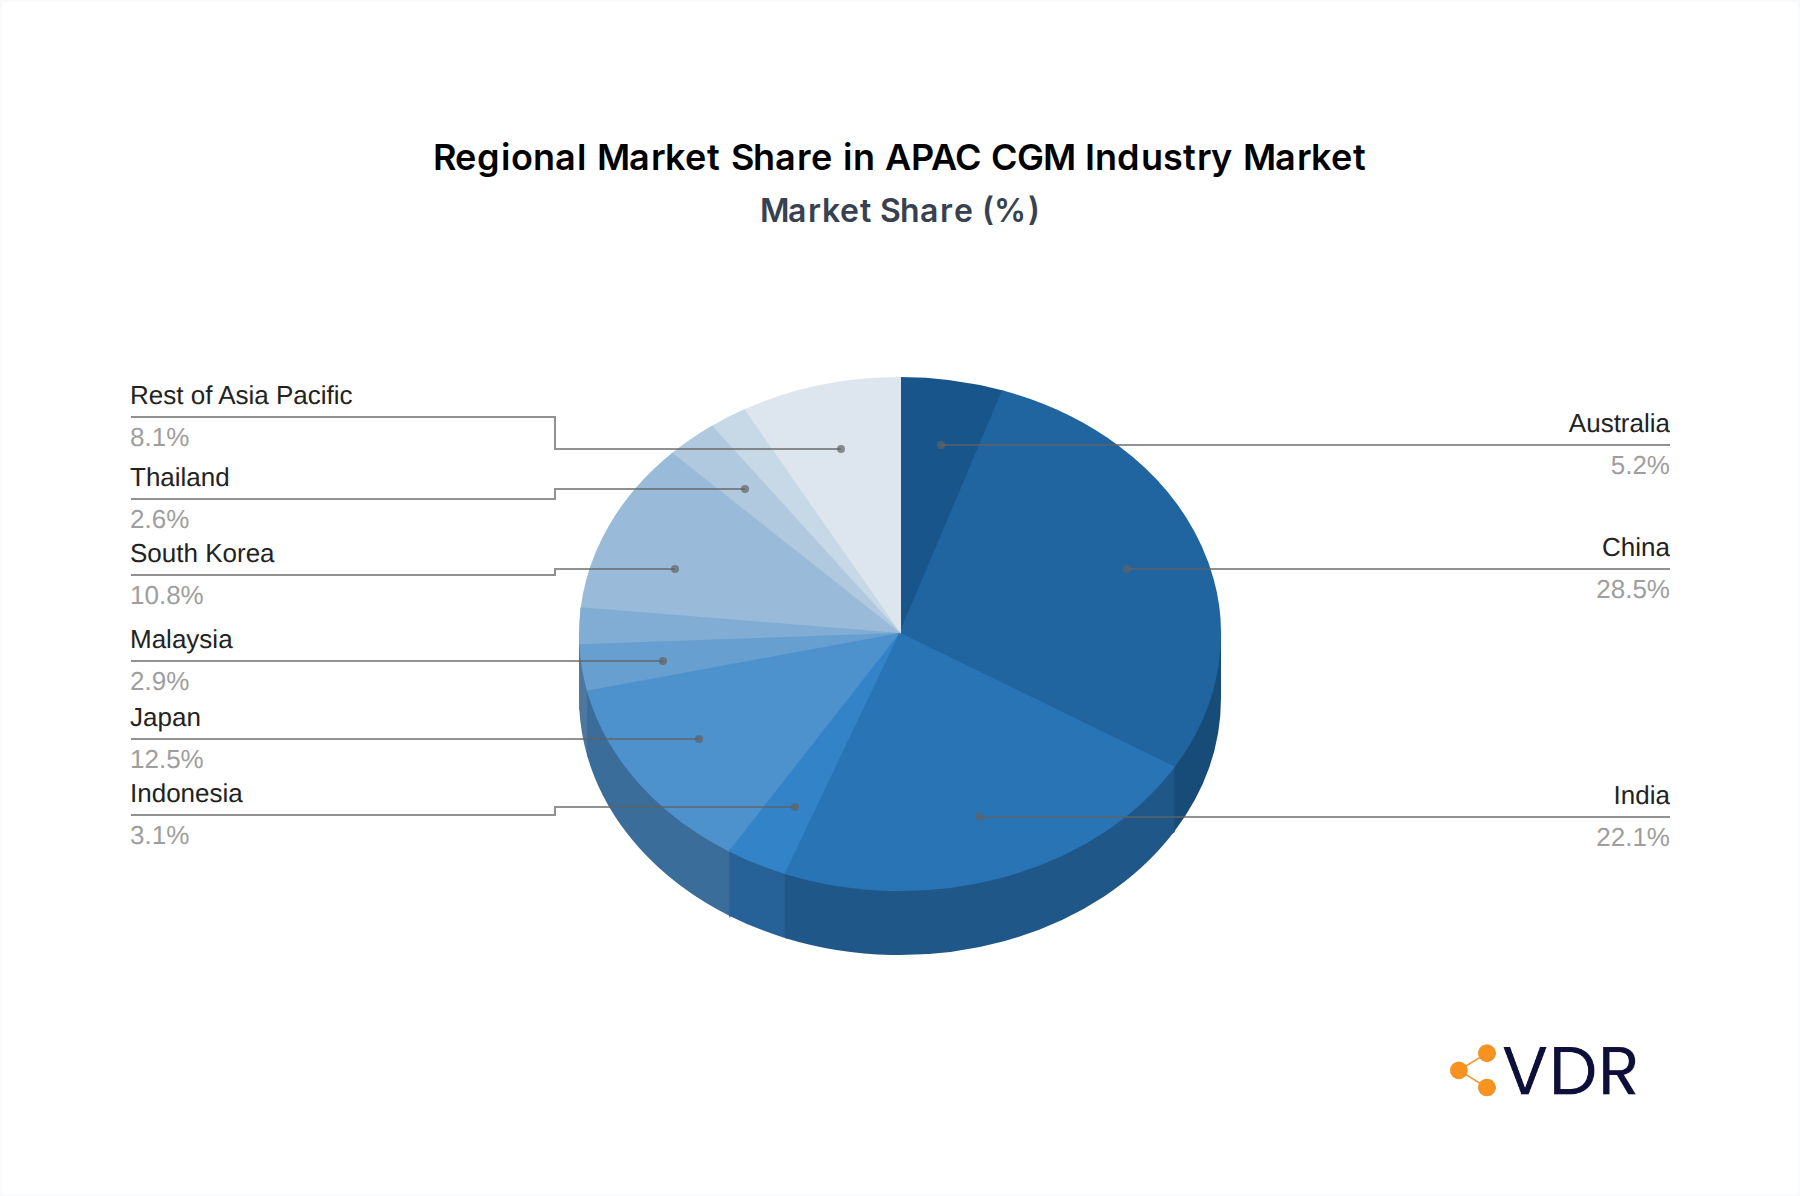
Dominant Regions, Countries, or Segments in APAC CGM Industry
Within the expansive APAC CGM market, China stands out as the dominant country, driving significant growth due to its massive population, escalating diabetes burden, and increasing government focus on digital health initiatives. The sheer scale of the Chinese market, coupled with a growing middle class that has greater disposable income for advanced healthcare solutions, positions it as a powerhouse for CGM adoption. While other regions like Japan and South Korea exhibit high adoption rates due to advanced healthcare systems and favorable reimbursement policies, China's potential for sheer volume of new users is unparalleled.
Key Drivers of Dominance in China:
- Massive Diabetes Population: China has the largest number of people with diabetes globally, creating an immense unmet need for effective management solutions.
- Government Support for Digital Health: Favorable policies and investments in e-health and telemedicine are creating an conducive environment for CGM adoption.
- Growing Middle Class: Increased disposable income allows a larger segment of the population to afford advanced medical devices.
- Rapid Technological Adoption: Chinese consumers are generally early adopters of new technologies, including wearable health devices.
- Expansion of Reimbursement Policies: Though still developing, insurance coverage for diabetes management tools is gradually expanding, making CGM more accessible.
Market Share and Growth Potential:
China's market share in the APAC CGM industry is projected to exceed 40% by 2028, with an anticipated CAGR of over 18% during the forecast period. This growth is further amplified by the expansion of its Component: Sensors segment, which is intrinsically linked to the overall CGM market. The demand for high-quality, accurate, and long-lasting sensors is a critical enabler of CGM system functionality and adoption. As China invests heavily in domestic manufacturing capabilities and research and development for medical devices, the sensor segment is expected to witness substantial growth, both in terms of volume and technological sophistication.
Japan and South Korea represent the second and third most dominant markets, respectively. Japan's dominance is bolstered by proactive reimbursement policies, such as the March 2022 expansion for Abbott's FreeStyle Libre, which has significantly broadened access to CGM for insulin-dependent individuals. South Korea, with its advanced healthcare infrastructure and high digital literacy, also demonstrates strong adoption rates.
The Rest of Asia-Pacific region, encompassing countries like India, Indonesia, and Vietnam, presents significant untapped potential. While currently holding smaller market shares, these nations are expected to witness accelerated growth due to their burgeoning economies, increasing awareness of diabetes, and the gradual implementation of supportive healthcare policies. The Component: Durables segment, referring to the reusable or long-term components of CGM systems, is crucial across all these regions, as their cost-effectiveness and patient convenience directly influence adoption rates.
APAC CGM Industry Product Landscape
The APAC CGM product landscape is rapidly evolving, characterized by a relentless pursuit of enhanced accuracy, user convenience, and seamless integration with digital health ecosystems. Innovations are centered on developing sensors with extended wear times, achieving factory calibration to eliminate the need for frequent fingerstick calibrations, and miniaturizing device footprints for discreet wear. Dexcom's G6, distributed in Japan by Terumo Corporation, exemplifies the drive for improved user experience through its factory-calibrated design and smartphone connectivity. Abbott's FreeStyle Libre system, with its expanded reimbursement in Japan, highlights the impact of strategic market access on product adoption. Performance metrics are increasingly focused on reducing mean absolute relative difference (MARD) to achieve near-blood glucose accuracy, while also emphasizing data interpretation capabilities through intuitive mobile applications that provide trend arrows and personalized alerts.
Key Drivers, Barriers & Challenges in APAC CGM Industry
Key Drivers:
- Rising Diabetes Prevalence: The escalating incidence of diabetes across APAC is the primary catalyst for CGM market growth.
- Technological Advancements: Improved sensor accuracy, extended wear life, and wireless connectivity are enhancing user experience and efficacy.
- Expanding Reimbursement Coverage: Government and private insurance policies are increasingly covering CGM devices, making them more accessible.
- Growing Health Awareness: Increased patient and physician understanding of the benefits of real-time glucose monitoring for diabetes management.
- Government Initiatives: Supportive policies promoting digital health and chronic disease management are fueling market expansion.
Barriers & Challenges:
- High Cost of Devices: Despite decreasing costs, CGM systems remain a significant financial burden for a large portion of the population in many APAC countries.
- Limited Reimbursement in Emerging Markets: In many developing nations, comprehensive reimbursement for CGM is still lacking, hindering widespread adoption.
- Technical Expertise and Training: Adequate training for both healthcare professionals and patients on using and interpreting CGM data is crucial but can be a challenge.
- Data Security and Privacy Concerns: With increasing use of connected devices, ensuring the security and privacy of sensitive patient data is paramount.
- Supply Chain Disruptions: Global supply chain vulnerabilities can impact the availability and affordability of essential CGM components.
Emerging Opportunities in APAC CGM Industry
Emerging opportunities in the APAC CGM industry are vast, fueled by untapped potential in emerging markets and evolving consumer preferences. The expansion into markets like India and Southeast Asian nations presents a significant opportunity as these regions grapple with rising diabetes rates and increasing healthcare expenditure. Innovative applications, such as integrating CGM data with personalized nutrition and exercise platforms, are gaining traction, offering a holistic approach to diabetes management. Evolving consumer preferences are leaning towards integrated wearable health solutions, creating an avenue for CGM devices to be seamlessly incorporated into smartwatches and fitness trackers, thereby increasing daily wear and accessibility. Furthermore, the development of CGM systems for non-diabetes applications, such as athletic performance monitoring and critical care settings, represents an innovative avenue for market expansion.
Growth Accelerators in the APAC CGM Industry Industry
Several catalysts are accelerating the growth of the APAC CGM industry. Technological breakthroughs, particularly in sensor miniaturization and the development of implantable or minimally invasive CGM devices, are poised to revolutionize patient comfort and usability. Strategic partnerships between established medical device manufacturers and local distributors, like the Dexcom and Terumo Corporation agreement for Japan, are crucial for expanding market reach and navigating local regulatory landscapes. Market expansion strategies focusing on tiered product offerings, catering to different economic segments, will be vital for capturing a broader consumer base. The increasing collaboration between CGM manufacturers and healthcare providers to integrate CGM data into electronic health records (EHRs) will further drive adoption by facilitating better patient care and clinical decision-making.
Key Players Shaping the APAC CGM Industry Market
- Medtronics
- Eversense
- Abbott
- Ascensia
- Dexcom
Notable Milestones in APAC CGM Industry Sector
- July 2021: Dexcom and Terumo Corporation signed an agreement for exclusively distributing Dexcom G6 across Japan.
- March 2022: Abbott announced that it received expanded reimbursement coverage in Japan for the FreeStyle Libre system. Japan's Ministry of Health, Labor, and Welfare approved the expansion of the continuous glucose monitoring (CGM) system to include all people with diabetes who use insulin at least once per day.
In-Depth APAC CGM Industry Market Outlook
The APAC CGM industry is on an upward trajectory, driven by a convergence of demographic shifts, technological innovations, and increasing healthcare investments. Growth accelerators such as advancements in sensor technology promising greater accuracy and longer wear times, coupled with strategic market expansion efforts by key players, are set to unlock unprecedented growth potential. The expanding reimbursement landscape in countries like Japan and the growing demand for integrated digital health solutions across the region are creating a fertile ground for innovation and adoption. Strategic partnerships and the increasing focus on personalized medicine will further propel the market, solidifying CGM's role as a cornerstone of modern diabetes management in APAC.
APAC CGM Industry Segmentation
-
1. Component
- 1.1. Sensors
- 1.2. Durables
-
2. Geography
- 2.1. Australia
- 2.2. China
- 2.3. India
- 2.4. Indonesia
- 2.5. Japan
- 2.6. Malaysia
- 2.7. Philippines
- 2.8. South Korea
- 2.9. Thailand
- 2.10. Vietnam
- 2.11. Rest of Asia-Pacific
APAC CGM Industry Segmentation By Geography
- 1. Australia
- 2. China
- 3. India
- 4. Indonesia
- 5. Japan
- 6. Malaysia
- 7. Philippines
- 8. South Korea
- 9. Thailand
- 10. Vietnam
- 11. Rest of Asia Pacific
APAC CGM Industry Regional Market Share
Geographic Coverage of APAC CGM Industry
APAC CGM Industry REPORT HIGHLIGHTS
| Aspects | Details |
|---|---|
| Study Period | 2020-2034 |
| Base Year | 2025 |
| Estimated Year | 2026 |
| Forecast Period | 2026-2034 |
| Historical Period | 2020-2025 |
| Growth Rate | CAGR of 18.7% from 2020-2034 |
| Segmentation |
|
Table of Contents
- 1. Introduction
- 1.1. Research Scope
- 1.2. Market Segmentation
- 1.3. Research Objective
- 1.4. Definitions and Assumptions
- 2. Executive Summary
- 2.1. Market Snapshot
- 3. Market Dynamics
- 3.1. Market Drivers
- 3.2. Market Restrains
- 3.3. Market Trends
- 3.4. Market Opportunities
- 4. Market Factor Analysis
- 4.1. Porters Five Forces
- 4.1.1. Bargaining Power of Suppliers
- 4.1.2. Bargaining Power of Buyers
- 4.1.3. Threat of New Entrants
- 4.1.4. Threat of Substitutes
- 4.1.5. Competitive Rivalry
- 4.2. PESTEL analysis
- 4.3. BCG Analysis
- 4.3.1. Stars (High Growth, High Market Share)
- 4.3.2. Cash Cows (Low Growth, High Market Share)
- 4.3.3. Question Mark (High Growth, Low Market Share)
- 4.3.4. Dogs (Low Growth, Low Market Share)
- 4.4. Ansoff Matrix Analysis
- 4.5. Supply Chain Analysis
- 4.6. Regulatory Landscape
- 4.7. Current Market Potential and Opportunity Assessment (TAM–SAM–SOM Framework)
- 4.8. VDR Analyst Note
- 4.1. Porters Five Forces
- 5. Market Analysis, Insights and Forecast 2021-2033
- 5.1. Market Analysis, Insights and Forecast - by Component
- 5.1.1. Sensors
- 5.1.2. Durables
- 5.2. Market Analysis, Insights and Forecast - by Geography
- 5.2.1. Australia
- 5.2.2. China
- 5.2.3. India
- 5.2.4. Indonesia
- 5.2.5. Japan
- 5.2.6. Malaysia
- 5.2.7. Philippines
- 5.2.8. South Korea
- 5.2.9. Thailand
- 5.2.10. Vietnam
- 5.2.11. Rest of Asia-Pacific
- 5.3. Market Analysis, Insights and Forecast - by Region
- 5.3.1. Australia
- 5.3.2. China
- 5.3.3. India
- 5.3.4. Indonesia
- 5.3.5. Japan
- 5.3.6. Malaysia
- 5.3.7. Philippines
- 5.3.8. South Korea
- 5.3.9. Thailand
- 5.3.10. Vietnam
- 5.3.11. Rest of Asia Pacific
- 5.1. Market Analysis, Insights and Forecast - by Component
- 6. Global APAC CGM Industry Analysis, Insights and Forecast, 2021-2033
- 6.1. Market Analysis, Insights and Forecast - by Component
- 6.1.1. Sensors
- 6.1.2. Durables
- 6.2. Market Analysis, Insights and Forecast - by Geography
- 6.2.1. Australia
- 6.2.2. China
- 6.2.3. India
- 6.2.4. Indonesia
- 6.2.5. Japan
- 6.2.6. Malaysia
- 6.2.7. Philippines
- 6.2.8. South Korea
- 6.2.9. Thailand
- 6.2.10. Vietnam
- 6.2.11. Rest of Asia-Pacific
- 6.1. Market Analysis, Insights and Forecast - by Component
- 7. Australia APAC CGM Industry Analysis, Insights and Forecast, 2021-2033
- 7.1. Market Analysis, Insights and Forecast - by Component
- 7.1.1. Sensors
- 7.1.2. Durables
- 7.2. Market Analysis, Insights and Forecast - by Geography
- 7.2.1. Australia
- 7.2.2. China
- 7.2.3. India
- 7.2.4. Indonesia
- 7.2.5. Japan
- 7.2.6. Malaysia
- 7.2.7. Philippines
- 7.2.8. South Korea
- 7.2.9. Thailand
- 7.2.10. Vietnam
- 7.2.11. Rest of Asia-Pacific
- 7.1. Market Analysis, Insights and Forecast - by Component
- 8. China APAC CGM Industry Analysis, Insights and Forecast, 2021-2033
- 8.1. Market Analysis, Insights and Forecast - by Component
- 8.1.1. Sensors
- 8.1.2. Durables
- 8.2. Market Analysis, Insights and Forecast - by Geography
- 8.2.1. Australia
- 8.2.2. China
- 8.2.3. India
- 8.2.4. Indonesia
- 8.2.5. Japan
- 8.2.6. Malaysia
- 8.2.7. Philippines
- 8.2.8. South Korea
- 8.2.9. Thailand
- 8.2.10. Vietnam
- 8.2.11. Rest of Asia-Pacific
- 8.1. Market Analysis, Insights and Forecast - by Component
- 9. India APAC CGM Industry Analysis, Insights and Forecast, 2021-2033
- 9.1. Market Analysis, Insights and Forecast - by Component
- 9.1.1. Sensors
- 9.1.2. Durables
- 9.2. Market Analysis, Insights and Forecast - by Geography
- 9.2.1. Australia
- 9.2.2. China
- 9.2.3. India
- 9.2.4. Indonesia
- 9.2.5. Japan
- 9.2.6. Malaysia
- 9.2.7. Philippines
- 9.2.8. South Korea
- 9.2.9. Thailand
- 9.2.10. Vietnam
- 9.2.11. Rest of Asia-Pacific
- 9.1. Market Analysis, Insights and Forecast - by Component
- 10. Indonesia APAC CGM Industry Analysis, Insights and Forecast, 2021-2033
- 10.1. Market Analysis, Insights and Forecast - by Component
- 10.1.1. Sensors
- 10.1.2. Durables
- 10.2. Market Analysis, Insights and Forecast - by Geography
- 10.2.1. Australia
- 10.2.2. China
- 10.2.3. India
- 10.2.4. Indonesia
- 10.2.5. Japan
- 10.2.6. Malaysia
- 10.2.7. Philippines
- 10.2.8. South Korea
- 10.2.9. Thailand
- 10.2.10. Vietnam
- 10.2.11. Rest of Asia-Pacific
- 10.1. Market Analysis, Insights and Forecast - by Component
- 11. Japan APAC CGM Industry Analysis, Insights and Forecast, 2021-2033
- 11.1. Market Analysis, Insights and Forecast - by Component
- 11.1.1. Sensors
- 11.1.2. Durables
- 11.2. Market Analysis, Insights and Forecast - by Geography
- 11.2.1. Australia
- 11.2.2. China
- 11.2.3. India
- 11.2.4. Indonesia
- 11.2.5. Japan
- 11.2.6. Malaysia
- 11.2.7. Philippines
- 11.2.8. South Korea
- 11.2.9. Thailand
- 11.2.10. Vietnam
- 11.2.11. Rest of Asia-Pacific
- 11.1. Market Analysis, Insights and Forecast - by Component
- 12. Malaysia APAC CGM Industry Analysis, Insights and Forecast, 2021-2033
- 12.1. Market Analysis, Insights and Forecast - by Component
- 12.1.1. Sensors
- 12.1.2. Durables
- 12.2. Market Analysis, Insights and Forecast - by Geography
- 12.2.1. Australia
- 12.2.2. China
- 12.2.3. India
- 12.2.4. Indonesia
- 12.2.5. Japan
- 12.2.6. Malaysia
- 12.2.7. Philippines
- 12.2.8. South Korea
- 12.2.9. Thailand
- 12.2.10. Vietnam
- 12.2.11. Rest of Asia-Pacific
- 12.1. Market Analysis, Insights and Forecast - by Component
- 13. Philippines APAC CGM Industry Analysis, Insights and Forecast, 2021-2033
- 13.1. Market Analysis, Insights and Forecast - by Component
- 13.1.1. Sensors
- 13.1.2. Durables
- 13.2. Market Analysis, Insights and Forecast - by Geography
- 13.2.1. Australia
- 13.2.2. China
- 13.2.3. India
- 13.2.4. Indonesia
- 13.2.5. Japan
- 13.2.6. Malaysia
- 13.2.7. Philippines
- 13.2.8. South Korea
- 13.2.9. Thailand
- 13.2.10. Vietnam
- 13.2.11. Rest of Asia-Pacific
- 13.1. Market Analysis, Insights and Forecast - by Component
- 14. South Korea APAC CGM Industry Analysis, Insights and Forecast, 2021-2033
- 14.1. Market Analysis, Insights and Forecast - by Component
- 14.1.1. Sensors
- 14.1.2. Durables
- 14.2. Market Analysis, Insights and Forecast - by Geography
- 14.2.1. Australia
- 14.2.2. China
- 14.2.3. India
- 14.2.4. Indonesia
- 14.2.5. Japan
- 14.2.6. Malaysia
- 14.2.7. Philippines
- 14.2.8. South Korea
- 14.2.9. Thailand
- 14.2.10. Vietnam
- 14.2.11. Rest of Asia-Pacific
- 14.1. Market Analysis, Insights and Forecast - by Component
- 15. Thailand APAC CGM Industry Analysis, Insights and Forecast, 2021-2033
- 15.1. Market Analysis, Insights and Forecast - by Component
- 15.1.1. Sensors
- 15.1.2. Durables
- 15.2. Market Analysis, Insights and Forecast - by Geography
- 15.2.1. Australia
- 15.2.2. China
- 15.2.3. India
- 15.2.4. Indonesia
- 15.2.5. Japan
- 15.2.6. Malaysia
- 15.2.7. Philippines
- 15.2.8. South Korea
- 15.2.9. Thailand
- 15.2.10. Vietnam
- 15.2.11. Rest of Asia-Pacific
- 15.1. Market Analysis, Insights and Forecast - by Component
- 16. Vietnam APAC CGM Industry Analysis, Insights and Forecast, 2021-2033
- 16.1. Market Analysis, Insights and Forecast - by Component
- 16.1.1. Sensors
- 16.1.2. Durables
- 16.2. Market Analysis, Insights and Forecast - by Geography
- 16.2.1. Australia
- 16.2.2. China
- 16.2.3. India
- 16.2.4. Indonesia
- 16.2.5. Japan
- 16.2.6. Malaysia
- 16.2.7. Philippines
- 16.2.8. South Korea
- 16.2.9. Thailand
- 16.2.10. Vietnam
- 16.2.11. Rest of Asia-Pacific
- 16.1. Market Analysis, Insights and Forecast - by Component
- 17. Rest of Asia Pacific APAC CGM Industry Analysis, Insights and Forecast, 2021-2033
- 17.1. Market Analysis, Insights and Forecast - by Component
- 17.1.1. Sensors
- 17.1.2. Durables
- 17.2. Market Analysis, Insights and Forecast - by Geography
- 17.2.1. Australia
- 17.2.2. China
- 17.2.3. India
- 17.2.4. Indonesia
- 17.2.5. Japan
- 17.2.6. Malaysia
- 17.2.7. Philippines
- 17.2.8. South Korea
- 17.2.9. Thailand
- 17.2.10. Vietnam
- 17.2.11. Rest of Asia-Pacific
- 17.1. Market Analysis, Insights and Forecast - by Component
- 18. Competitive Analysis
- 18.1. Company Profiles
- 18.1.1 Medtronics
- 18.1.1.1. Company Overview
- 18.1.1.2. Products
- 18.1.1.3. Company Financials
- 18.1.1.4. SWOT Analysis
- 18.1.2 Eversense
- 18.1.2.1. Company Overview
- 18.1.2.2. Products
- 18.1.2.3. Company Financials
- 18.1.2.4. SWOT Analysis
- 18.1.3 Abbott
- 18.1.3.1. Company Overview
- 18.1.3.2. Products
- 18.1.3.3. Company Financials
- 18.1.3.4. SWOT Analysis
- 18.1.4 Ascensia
- 18.1.4.1. Company Overview
- 18.1.4.2. Products
- 18.1.4.3. Company Financials
- 18.1.4.4. SWOT Analysis
- 18.1.5 Dexcom
- 18.1.5.1. Company Overview
- 18.1.5.2. Products
- 18.1.5.3. Company Financials
- 18.1.5.4. SWOT Analysis
- 18.1.1 Medtronics
- 18.2. Market Entropy
- 18.2.1 Company's Key Areas Served
- 18.2.2 Recent Developments
- 18.3. Company Market Share Analysis 2025
- 18.3.1 Top 5 Companies Market Share Analysis
- 18.3.2 Top 3 Companies Market Share Analysis
- 18.4. List of Potential Customers
- 19. Research Methodology
List of Figures
- Figure 1: Global APAC CGM Industry Revenue Breakdown (billion, %) by Region 2025 & 2033
- Figure 2: Global APAC CGM Industry Volume Breakdown (K Unit, %) by Region 2025 & 2033
- Figure 3: Australia APAC CGM Industry Revenue (billion), by Component 2025 & 2033
- Figure 4: Australia APAC CGM Industry Volume (K Unit), by Component 2025 & 2033
- Figure 5: Australia APAC CGM Industry Revenue Share (%), by Component 2025 & 2033
- Figure 6: Australia APAC CGM Industry Volume Share (%), by Component 2025 & 2033
- Figure 7: Australia APAC CGM Industry Revenue (billion), by Geography 2025 & 2033
- Figure 8: Australia APAC CGM Industry Volume (K Unit), by Geography 2025 & 2033
- Figure 9: Australia APAC CGM Industry Revenue Share (%), by Geography 2025 & 2033
- Figure 10: Australia APAC CGM Industry Volume Share (%), by Geography 2025 & 2033
- Figure 11: Australia APAC CGM Industry Revenue (billion), by Country 2025 & 2033
- Figure 12: Australia APAC CGM Industry Volume (K Unit), by Country 2025 & 2033
- Figure 13: Australia APAC CGM Industry Revenue Share (%), by Country 2025 & 2033
- Figure 14: Australia APAC CGM Industry Volume Share (%), by Country 2025 & 2033
- Figure 15: China APAC CGM Industry Revenue (billion), by Component 2025 & 2033
- Figure 16: China APAC CGM Industry Volume (K Unit), by Component 2025 & 2033
- Figure 17: China APAC CGM Industry Revenue Share (%), by Component 2025 & 2033
- Figure 18: China APAC CGM Industry Volume Share (%), by Component 2025 & 2033
- Figure 19: China APAC CGM Industry Revenue (billion), by Geography 2025 & 2033
- Figure 20: China APAC CGM Industry Volume (K Unit), by Geography 2025 & 2033
- Figure 21: China APAC CGM Industry Revenue Share (%), by Geography 2025 & 2033
- Figure 22: China APAC CGM Industry Volume Share (%), by Geography 2025 & 2033
- Figure 23: China APAC CGM Industry Revenue (billion), by Country 2025 & 2033
- Figure 24: China APAC CGM Industry Volume (K Unit), by Country 2025 & 2033
- Figure 25: China APAC CGM Industry Revenue Share (%), by Country 2025 & 2033
- Figure 26: China APAC CGM Industry Volume Share (%), by Country 2025 & 2033
- Figure 27: India APAC CGM Industry Revenue (billion), by Component 2025 & 2033
- Figure 28: India APAC CGM Industry Volume (K Unit), by Component 2025 & 2033
- Figure 29: India APAC CGM Industry Revenue Share (%), by Component 2025 & 2033
- Figure 30: India APAC CGM Industry Volume Share (%), by Component 2025 & 2033
- Figure 31: India APAC CGM Industry Revenue (billion), by Geography 2025 & 2033
- Figure 32: India APAC CGM Industry Volume (K Unit), by Geography 2025 & 2033
- Figure 33: India APAC CGM Industry Revenue Share (%), by Geography 2025 & 2033
- Figure 34: India APAC CGM Industry Volume Share (%), by Geography 2025 & 2033
- Figure 35: India APAC CGM Industry Revenue (billion), by Country 2025 & 2033
- Figure 36: India APAC CGM Industry Volume (K Unit), by Country 2025 & 2033
- Figure 37: India APAC CGM Industry Revenue Share (%), by Country 2025 & 2033
- Figure 38: India APAC CGM Industry Volume Share (%), by Country 2025 & 2033
- Figure 39: Indonesia APAC CGM Industry Revenue (billion), by Component 2025 & 2033
- Figure 40: Indonesia APAC CGM Industry Volume (K Unit), by Component 2025 & 2033
- Figure 41: Indonesia APAC CGM Industry Revenue Share (%), by Component 2025 & 2033
- Figure 42: Indonesia APAC CGM Industry Volume Share (%), by Component 2025 & 2033
- Figure 43: Indonesia APAC CGM Industry Revenue (billion), by Geography 2025 & 2033
- Figure 44: Indonesia APAC CGM Industry Volume (K Unit), by Geography 2025 & 2033
- Figure 45: Indonesia APAC CGM Industry Revenue Share (%), by Geography 2025 & 2033
- Figure 46: Indonesia APAC CGM Industry Volume Share (%), by Geography 2025 & 2033
- Figure 47: Indonesia APAC CGM Industry Revenue (billion), by Country 2025 & 2033
- Figure 48: Indonesia APAC CGM Industry Volume (K Unit), by Country 2025 & 2033
- Figure 49: Indonesia APAC CGM Industry Revenue Share (%), by Country 2025 & 2033
- Figure 50: Indonesia APAC CGM Industry Volume Share (%), by Country 2025 & 2033
- Figure 51: Japan APAC CGM Industry Revenue (billion), by Component 2025 & 2033
- Figure 52: Japan APAC CGM Industry Volume (K Unit), by Component 2025 & 2033
- Figure 53: Japan APAC CGM Industry Revenue Share (%), by Component 2025 & 2033
- Figure 54: Japan APAC CGM Industry Volume Share (%), by Component 2025 & 2033
- Figure 55: Japan APAC CGM Industry Revenue (billion), by Geography 2025 & 2033
- Figure 56: Japan APAC CGM Industry Volume (K Unit), by Geography 2025 & 2033
- Figure 57: Japan APAC CGM Industry Revenue Share (%), by Geography 2025 & 2033
- Figure 58: Japan APAC CGM Industry Volume Share (%), by Geography 2025 & 2033
- Figure 59: Japan APAC CGM Industry Revenue (billion), by Country 2025 & 2033
- Figure 60: Japan APAC CGM Industry Volume (K Unit), by Country 2025 & 2033
- Figure 61: Japan APAC CGM Industry Revenue Share (%), by Country 2025 & 2033
- Figure 62: Japan APAC CGM Industry Volume Share (%), by Country 2025 & 2033
- Figure 63: Malaysia APAC CGM Industry Revenue (billion), by Component 2025 & 2033
- Figure 64: Malaysia APAC CGM Industry Volume (K Unit), by Component 2025 & 2033
- Figure 65: Malaysia APAC CGM Industry Revenue Share (%), by Component 2025 & 2033
- Figure 66: Malaysia APAC CGM Industry Volume Share (%), by Component 2025 & 2033
- Figure 67: Malaysia APAC CGM Industry Revenue (billion), by Geography 2025 & 2033
- Figure 68: Malaysia APAC CGM Industry Volume (K Unit), by Geography 2025 & 2033
- Figure 69: Malaysia APAC CGM Industry Revenue Share (%), by Geography 2025 & 2033
- Figure 70: Malaysia APAC CGM Industry Volume Share (%), by Geography 2025 & 2033
- Figure 71: Malaysia APAC CGM Industry Revenue (billion), by Country 2025 & 2033
- Figure 72: Malaysia APAC CGM Industry Volume (K Unit), by Country 2025 & 2033
- Figure 73: Malaysia APAC CGM Industry Revenue Share (%), by Country 2025 & 2033
- Figure 74: Malaysia APAC CGM Industry Volume Share (%), by Country 2025 & 2033
- Figure 75: Philippines APAC CGM Industry Revenue (billion), by Component 2025 & 2033
- Figure 76: Philippines APAC CGM Industry Volume (K Unit), by Component 2025 & 2033
- Figure 77: Philippines APAC CGM Industry Revenue Share (%), by Component 2025 & 2033
- Figure 78: Philippines APAC CGM Industry Volume Share (%), by Component 2025 & 2033
- Figure 79: Philippines APAC CGM Industry Revenue (billion), by Geography 2025 & 2033
- Figure 80: Philippines APAC CGM Industry Volume (K Unit), by Geography 2025 & 2033
- Figure 81: Philippines APAC CGM Industry Revenue Share (%), by Geography 2025 & 2033
- Figure 82: Philippines APAC CGM Industry Volume Share (%), by Geography 2025 & 2033
- Figure 83: Philippines APAC CGM Industry Revenue (billion), by Country 2025 & 2033
- Figure 84: Philippines APAC CGM Industry Volume (K Unit), by Country 2025 & 2033
- Figure 85: Philippines APAC CGM Industry Revenue Share (%), by Country 2025 & 2033
- Figure 86: Philippines APAC CGM Industry Volume Share (%), by Country 2025 & 2033
- Figure 87: South Korea APAC CGM Industry Revenue (billion), by Component 2025 & 2033
- Figure 88: South Korea APAC CGM Industry Volume (K Unit), by Component 2025 & 2033
- Figure 89: South Korea APAC CGM Industry Revenue Share (%), by Component 2025 & 2033
- Figure 90: South Korea APAC CGM Industry Volume Share (%), by Component 2025 & 2033
- Figure 91: South Korea APAC CGM Industry Revenue (billion), by Geography 2025 & 2033
- Figure 92: South Korea APAC CGM Industry Volume (K Unit), by Geography 2025 & 2033
- Figure 93: South Korea APAC CGM Industry Revenue Share (%), by Geography 2025 & 2033
- Figure 94: South Korea APAC CGM Industry Volume Share (%), by Geography 2025 & 2033
- Figure 95: South Korea APAC CGM Industry Revenue (billion), by Country 2025 & 2033
- Figure 96: South Korea APAC CGM Industry Volume (K Unit), by Country 2025 & 2033
- Figure 97: South Korea APAC CGM Industry Revenue Share (%), by Country 2025 & 2033
- Figure 98: South Korea APAC CGM Industry Volume Share (%), by Country 2025 & 2033
- Figure 99: Thailand APAC CGM Industry Revenue (billion), by Component 2025 & 2033
- Figure 100: Thailand APAC CGM Industry Volume (K Unit), by Component 2025 & 2033
- Figure 101: Thailand APAC CGM Industry Revenue Share (%), by Component 2025 & 2033
- Figure 102: Thailand APAC CGM Industry Volume Share (%), by Component 2025 & 2033
- Figure 103: Thailand APAC CGM Industry Revenue (billion), by Geography 2025 & 2033
- Figure 104: Thailand APAC CGM Industry Volume (K Unit), by Geography 2025 & 2033
- Figure 105: Thailand APAC CGM Industry Revenue Share (%), by Geography 2025 & 2033
- Figure 106: Thailand APAC CGM Industry Volume Share (%), by Geography 2025 & 2033
- Figure 107: Thailand APAC CGM Industry Revenue (billion), by Country 2025 & 2033
- Figure 108: Thailand APAC CGM Industry Volume (K Unit), by Country 2025 & 2033
- Figure 109: Thailand APAC CGM Industry Revenue Share (%), by Country 2025 & 2033
- Figure 110: Thailand APAC CGM Industry Volume Share (%), by Country 2025 & 2033
- Figure 111: Vietnam APAC CGM Industry Revenue (billion), by Component 2025 & 2033
- Figure 112: Vietnam APAC CGM Industry Volume (K Unit), by Component 2025 & 2033
- Figure 113: Vietnam APAC CGM Industry Revenue Share (%), by Component 2025 & 2033
- Figure 114: Vietnam APAC CGM Industry Volume Share (%), by Component 2025 & 2033
- Figure 115: Vietnam APAC CGM Industry Revenue (billion), by Geography 2025 & 2033
- Figure 116: Vietnam APAC CGM Industry Volume (K Unit), by Geography 2025 & 2033
- Figure 117: Vietnam APAC CGM Industry Revenue Share (%), by Geography 2025 & 2033
- Figure 118: Vietnam APAC CGM Industry Volume Share (%), by Geography 2025 & 2033
- Figure 119: Vietnam APAC CGM Industry Revenue (billion), by Country 2025 & 2033
- Figure 120: Vietnam APAC CGM Industry Volume (K Unit), by Country 2025 & 2033
- Figure 121: Vietnam APAC CGM Industry Revenue Share (%), by Country 2025 & 2033
- Figure 122: Vietnam APAC CGM Industry Volume Share (%), by Country 2025 & 2033
- Figure 123: Rest of Asia Pacific APAC CGM Industry Revenue (billion), by Component 2025 & 2033
- Figure 124: Rest of Asia Pacific APAC CGM Industry Volume (K Unit), by Component 2025 & 2033
- Figure 125: Rest of Asia Pacific APAC CGM Industry Revenue Share (%), by Component 2025 & 2033
- Figure 126: Rest of Asia Pacific APAC CGM Industry Volume Share (%), by Component 2025 & 2033
- Figure 127: Rest of Asia Pacific APAC CGM Industry Revenue (billion), by Geography 2025 & 2033
- Figure 128: Rest of Asia Pacific APAC CGM Industry Volume (K Unit), by Geography 2025 & 2033
- Figure 129: Rest of Asia Pacific APAC CGM Industry Revenue Share (%), by Geography 2025 & 2033
- Figure 130: Rest of Asia Pacific APAC CGM Industry Volume Share (%), by Geography 2025 & 2033
- Figure 131: Rest of Asia Pacific APAC CGM Industry Revenue (billion), by Country 2025 & 2033
- Figure 132: Rest of Asia Pacific APAC CGM Industry Volume (K Unit), by Country 2025 & 2033
- Figure 133: Rest of Asia Pacific APAC CGM Industry Revenue Share (%), by Country 2025 & 2033
- Figure 134: Rest of Asia Pacific APAC CGM Industry Volume Share (%), by Country 2025 & 2033
List of Tables
- Table 1: Global APAC CGM Industry Revenue billion Forecast, by Component 2020 & 2033
- Table 2: Global APAC CGM Industry Volume K Unit Forecast, by Component 2020 & 2033
- Table 3: Global APAC CGM Industry Revenue billion Forecast, by Geography 2020 & 2033
- Table 4: Global APAC CGM Industry Volume K Unit Forecast, by Geography 2020 & 2033
- Table 5: Global APAC CGM Industry Revenue billion Forecast, by Region 2020 & 2033
- Table 6: Global APAC CGM Industry Volume K Unit Forecast, by Region 2020 & 2033
- Table 7: Global APAC CGM Industry Revenue billion Forecast, by Component 2020 & 2033
- Table 8: Global APAC CGM Industry Volume K Unit Forecast, by Component 2020 & 2033
- Table 9: Global APAC CGM Industry Revenue billion Forecast, by Geography 2020 & 2033
- Table 10: Global APAC CGM Industry Volume K Unit Forecast, by Geography 2020 & 2033
- Table 11: Global APAC CGM Industry Revenue billion Forecast, by Country 2020 & 2033
- Table 12: Global APAC CGM Industry Volume K Unit Forecast, by Country 2020 & 2033
- Table 13: Global APAC CGM Industry Revenue billion Forecast, by Component 2020 & 2033
- Table 14: Global APAC CGM Industry Volume K Unit Forecast, by Component 2020 & 2033
- Table 15: Global APAC CGM Industry Revenue billion Forecast, by Geography 2020 & 2033
- Table 16: Global APAC CGM Industry Volume K Unit Forecast, by Geography 2020 & 2033
- Table 17: Global APAC CGM Industry Revenue billion Forecast, by Country 2020 & 2033
- Table 18: Global APAC CGM Industry Volume K Unit Forecast, by Country 2020 & 2033
- Table 19: Global APAC CGM Industry Revenue billion Forecast, by Component 2020 & 2033
- Table 20: Global APAC CGM Industry Volume K Unit Forecast, by Component 2020 & 2033
- Table 21: Global APAC CGM Industry Revenue billion Forecast, by Geography 2020 & 2033
- Table 22: Global APAC CGM Industry Volume K Unit Forecast, by Geography 2020 & 2033
- Table 23: Global APAC CGM Industry Revenue billion Forecast, by Country 2020 & 2033
- Table 24: Global APAC CGM Industry Volume K Unit Forecast, by Country 2020 & 2033
- Table 25: Global APAC CGM Industry Revenue billion Forecast, by Component 2020 & 2033
- Table 26: Global APAC CGM Industry Volume K Unit Forecast, by Component 2020 & 2033
- Table 27: Global APAC CGM Industry Revenue billion Forecast, by Geography 2020 & 2033
- Table 28: Global APAC CGM Industry Volume K Unit Forecast, by Geography 2020 & 2033
- Table 29: Global APAC CGM Industry Revenue billion Forecast, by Country 2020 & 2033
- Table 30: Global APAC CGM Industry Volume K Unit Forecast, by Country 2020 & 2033
- Table 31: Global APAC CGM Industry Revenue billion Forecast, by Component 2020 & 2033
- Table 32: Global APAC CGM Industry Volume K Unit Forecast, by Component 2020 & 2033
- Table 33: Global APAC CGM Industry Revenue billion Forecast, by Geography 2020 & 2033
- Table 34: Global APAC CGM Industry Volume K Unit Forecast, by Geography 2020 & 2033
- Table 35: Global APAC CGM Industry Revenue billion Forecast, by Country 2020 & 2033
- Table 36: Global APAC CGM Industry Volume K Unit Forecast, by Country 2020 & 2033
- Table 37: Global APAC CGM Industry Revenue billion Forecast, by Component 2020 & 2033
- Table 38: Global APAC CGM Industry Volume K Unit Forecast, by Component 2020 & 2033
- Table 39: Global APAC CGM Industry Revenue billion Forecast, by Geography 2020 & 2033
- Table 40: Global APAC CGM Industry Volume K Unit Forecast, by Geography 2020 & 2033
- Table 41: Global APAC CGM Industry Revenue billion Forecast, by Country 2020 & 2033
- Table 42: Global APAC CGM Industry Volume K Unit Forecast, by Country 2020 & 2033
- Table 43: Global APAC CGM Industry Revenue billion Forecast, by Component 2020 & 2033
- Table 44: Global APAC CGM Industry Volume K Unit Forecast, by Component 2020 & 2033
- Table 45: Global APAC CGM Industry Revenue billion Forecast, by Geography 2020 & 2033
- Table 46: Global APAC CGM Industry Volume K Unit Forecast, by Geography 2020 & 2033
- Table 47: Global APAC CGM Industry Revenue billion Forecast, by Country 2020 & 2033
- Table 48: Global APAC CGM Industry Volume K Unit Forecast, by Country 2020 & 2033
- Table 49: Global APAC CGM Industry Revenue billion Forecast, by Component 2020 & 2033
- Table 50: Global APAC CGM Industry Volume K Unit Forecast, by Component 2020 & 2033
- Table 51: Global APAC CGM Industry Revenue billion Forecast, by Geography 2020 & 2033
- Table 52: Global APAC CGM Industry Volume K Unit Forecast, by Geography 2020 & 2033
- Table 53: Global APAC CGM Industry Revenue billion Forecast, by Country 2020 & 2033
- Table 54: Global APAC CGM Industry Volume K Unit Forecast, by Country 2020 & 2033
- Table 55: Global APAC CGM Industry Revenue billion Forecast, by Component 2020 & 2033
- Table 56: Global APAC CGM Industry Volume K Unit Forecast, by Component 2020 & 2033
- Table 57: Global APAC CGM Industry Revenue billion Forecast, by Geography 2020 & 2033
- Table 58: Global APAC CGM Industry Volume K Unit Forecast, by Geography 2020 & 2033
- Table 59: Global APAC CGM Industry Revenue billion Forecast, by Country 2020 & 2033
- Table 60: Global APAC CGM Industry Volume K Unit Forecast, by Country 2020 & 2033
- Table 61: Global APAC CGM Industry Revenue billion Forecast, by Component 2020 & 2033
- Table 62: Global APAC CGM Industry Volume K Unit Forecast, by Component 2020 & 2033
- Table 63: Global APAC CGM Industry Revenue billion Forecast, by Geography 2020 & 2033
- Table 64: Global APAC CGM Industry Volume K Unit Forecast, by Geography 2020 & 2033
- Table 65: Global APAC CGM Industry Revenue billion Forecast, by Country 2020 & 2033
- Table 66: Global APAC CGM Industry Volume K Unit Forecast, by Country 2020 & 2033
- Table 67: Global APAC CGM Industry Revenue billion Forecast, by Component 2020 & 2033
- Table 68: Global APAC CGM Industry Volume K Unit Forecast, by Component 2020 & 2033
- Table 69: Global APAC CGM Industry Revenue billion Forecast, by Geography 2020 & 2033
- Table 70: Global APAC CGM Industry Volume K Unit Forecast, by Geography 2020 & 2033
- Table 71: Global APAC CGM Industry Revenue billion Forecast, by Country 2020 & 2033
- Table 72: Global APAC CGM Industry Volume K Unit Forecast, by Country 2020 & 2033
Frequently Asked Questions
1. What is the projected Compound Annual Growth Rate (CAGR) of the APAC CGM Industry?
The projected CAGR is approximately 18.7%.
2. Which companies are prominent players in the APAC CGM Industry?
Key companies in the market include Medtronics, Eversense, Abbott, Ascensia, Dexcom.
3. What are the main segments of the APAC CGM Industry?
The market segments include Component, Geography.
4. Can you provide details about the market size?
The market size is estimated to be USD 12.4 billion as of 2022.
5. What are some drivers contributing to market growth?
Growing Burden of Gastrointestinal Diseases; Rising Preference of Point of Care Test.
6. What are the notable trends driving market growth?
The sensors Segment is having the highest market share in Asia-Pacific Continuous Glucose Monitoring Market..
7. Are there any restraints impacting market growth?
High Cost of Instruments.
8. Can you provide examples of recent developments in the market?
March 2022: Abbott announced that it received expanded reimbursement coverage in Japan for the FreeStyle Libre system. Japan's Ministry of Health, Labor, and Welfare approved the expansion of the continuous glucose monitoring (CGM) system to include all people with diabetes who use insulin at least once per day.
9. What pricing options are available for accessing the report?
Pricing options include single-user, multi-user, and enterprise licenses priced at USD 4750, USD 5250, and USD 8750 respectively.
10. Is the market size provided in terms of value or volume?
The market size is provided in terms of value, measured in billion and volume, measured in K Unit.
11. Are there any specific market keywords associated with the report?
Yes, the market keyword associated with the report is "APAC CGM Industry," which aids in identifying and referencing the specific market segment covered.
12. How do I determine which pricing option suits my needs best?
The pricing options vary based on user requirements and access needs. Individual users may opt for single-user licenses, while businesses requiring broader access may choose multi-user or enterprise licenses for cost-effective access to the report.
13. Are there any additional resources or data provided in the APAC CGM Industry report?
While the report offers comprehensive insights, it's advisable to review the specific contents or supplementary materials provided to ascertain if additional resources or data are available.
14. How can I stay updated on further developments or reports in the APAC CGM Industry?
To stay informed about further developments, trends, and reports in the APAC CGM Industry, consider subscribing to industry newsletters, following relevant companies and organizations, or regularly checking reputable industry news sources and publications.
Methodology
Step 1 - Identification of Relevant Samples Size from Population Database


Step 2 - Approaches for Defining Global Market Size (Value, Volume* & Price*)

Note*: In applicable scenarios
Step 3 - Data Sources
Primary Research
- Web Analytics
- Survey Reports
- Research Institute
- Latest Research Reports
- Opinion Leaders
Secondary Research
- Annual Reports
- White Paper
- Latest Press Release
- Industry Association
- Paid Database
- Investor Presentations

Step 4 - Data Triangulation
Involves using different sources of information in order to increase the validity of a study
These sources are likely to be stakeholders in a program - participants, other researchers, program staff, other community members, and so on.
Then we put all data in single framework & apply various statistical tools to find out the dynamic on the market.
During the analysis stage, feedback from the stakeholder groups would be compared to determine areas of agreement as well as areas of divergence