Key Insights
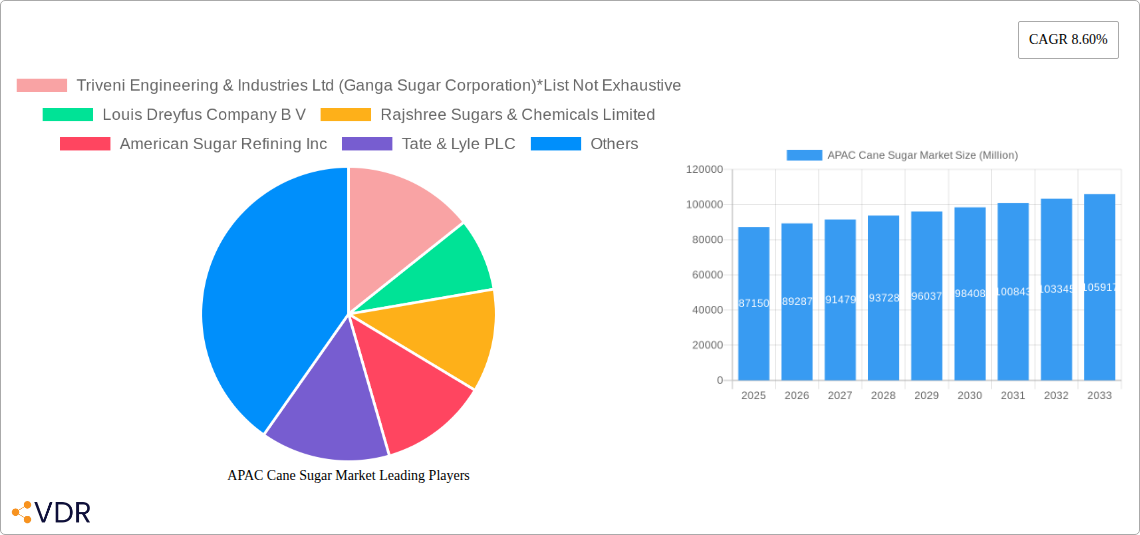
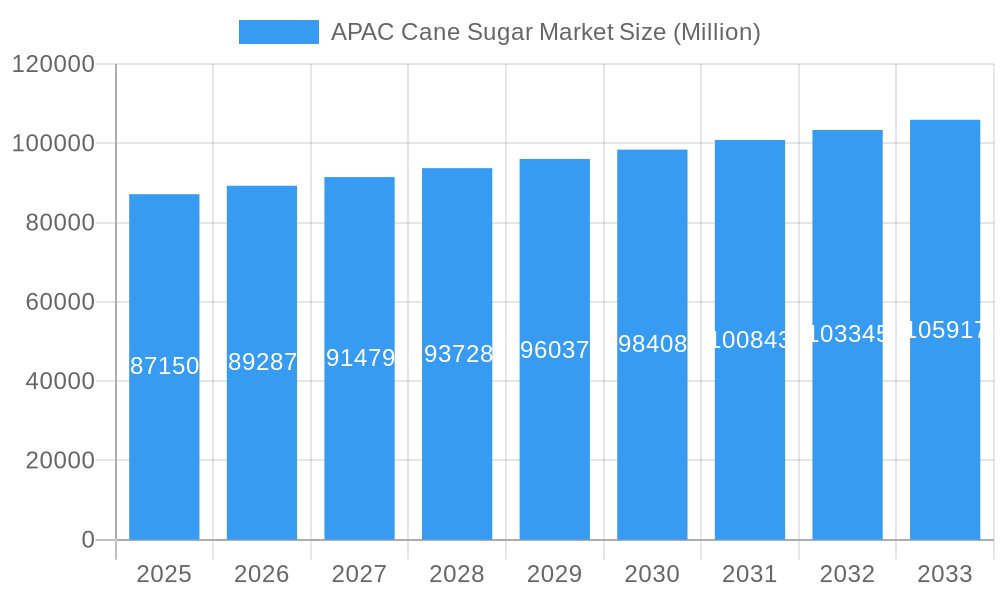
The APAC Cane Sugar Market is poised for steady growth, projected to reach USD 87.15 billion in 2025. This expansion is driven by a confluence of factors, including a growing population and increasing consumer demand for sugar-based products across various applications. The market is expected to witness a Compound Annual Growth Rate (CAGR) of 2.45% through the forecast period. A significant driver for this market is the expanding bakery and confectionery sector, where cane sugar remains a preferred ingredient due to its natural origin and desirable flavor profile. The dairy industry also contributes substantially, with increased consumption of sweetened dairy products. Furthermore, the booming beverage sector, encompassing both non-alcoholic and alcoholic drinks, continues to fuel demand for cane sugar. While organic sugar is gaining traction, conventional sugar still holds a dominant market share, catering to a wider consumer base. The prevalence of crystallized sugar as a primary form reflects its widespread use in both industrial and household applications.
APAC Cane Sugar Market Market Size (In Billion)
Emerging economies within the APAC region, particularly India and China, are anticipated to be key growth engines for the cane sugar market. These nations boast large populations with rising disposable incomes, leading to increased consumption of processed foods and beverages. The Rest of Asia-Pacific, encompassing countries like Vietnam, Thailand, and Indonesia, also presents substantial opportunities due to rapid industrialization and evolving consumer preferences. While the market benefits from strong demand, it faces certain restraints. Fluctuations in raw material prices, driven by weather patterns and agricultural policies, can impact profitability. Additionally, increasing health consciousness and a growing trend towards sugar reduction and alternative sweeteners in developed markets could pose a long-term challenge. However, the inherent versatility and affordability of cane sugar are expected to sustain its market dominance in the APAC region for the foreseeable future.
APAC Cane Sugar Market Company Market Share
This comprehensive report delves into the APAC Cane Sugar Market, a dynamic sector projected to reach USD XX billion by 2033. Analyzing the Organic Cane Sugar Market and Conventional Cane Sugar Market, this study provides unparalleled insights into growth drivers, competitive strategies, and emerging trends across the Asia-Pacific region. With a deep dive into Crystallized Sugar and Liquid Syrup forms, and applications spanning Bakery and Confectionery, Dairy, Beverages, and Other Applications, this report is an essential resource for stakeholders navigating this evolving industry.
APAC Cane Sugar Market Market Dynamics & Structure
The APAC Cane Sugar Market is characterized by moderate to high market concentration, with a few key players holding significant market share. Technological innovation, particularly in cultivation and processing, is a significant driver, focusing on yield improvement and sustainability. Regulatory frameworks, varying across countries, influence trade policies, import/export duties, and food safety standards, shaping market access and competitiveness. Competitive product substitutes, such as beet sugar and high-fructose corn syrup, present a constant challenge, necessitating innovation in cane sugar's value proposition. End-user demographics, with a growing middle class and increasing demand for processed foods and beverages, are a primary growth engine. Mergers and acquisitions (M&A) trends, while not as prevalent as in some other sectors, are present, aimed at consolidating market presence and expanding product portfolios.
- Market Concentration: Dominated by a mix of large multinational corporations and strong regional players.
- Technological Innovation Drivers: Focus on precision agriculture, advanced processing techniques for higher purity, and sustainable farming practices.
- Regulatory Frameworks: Varied policies across China, India, and other APAC nations impacting trade and production.
- Competitive Product Substitutes: Constant pressure from beet sugar and alternative sweeteners.
- End-User Demographics: Rising disposable incomes and evolving dietary habits in emerging economies are key.
- M&A Trends: Strategic acquisitions aimed at vertical integration and market expansion.
APAC Cane Sugar Market Growth Trends & Insights
The APAC Cane Sugar Market is on a robust growth trajectory, driven by a confluence of factors including increasing demand from developing economies, a growing preference for natural sweeteners, and advancements in cultivation and processing technologies. The market size is expected to witness significant expansion throughout the forecast period of 2025–2033, building upon the historical growth observed from 2019–2024. Adoption rates for organic cane sugar are on the rise, fueled by heightened consumer awareness regarding health and environmental impacts. Technological disruptions, such as improved sugarcane varieties and more efficient extraction methods, are contributing to higher yields and better quality sugar, thereby enhancing market competitiveness. Consumer behavior shifts, including a greater emphasis on traceability and sustainable sourcing, are also playing a crucial role in shaping market dynamics. This evolving landscape presents both challenges and immense opportunities for market participants aiming to capitalize on the projected USD XX billion market value by 2033. The compound annual growth rate (CAGR) for the forecast period is estimated to be between XX% and XX%, indicating a healthy expansion pace. Market penetration of premium and specialty cane sugar products is also expected to increase, driven by sophisticated marketing strategies and growing consumer sophistication. The interplay of these trends suggests a market ripe for innovation and strategic investment.
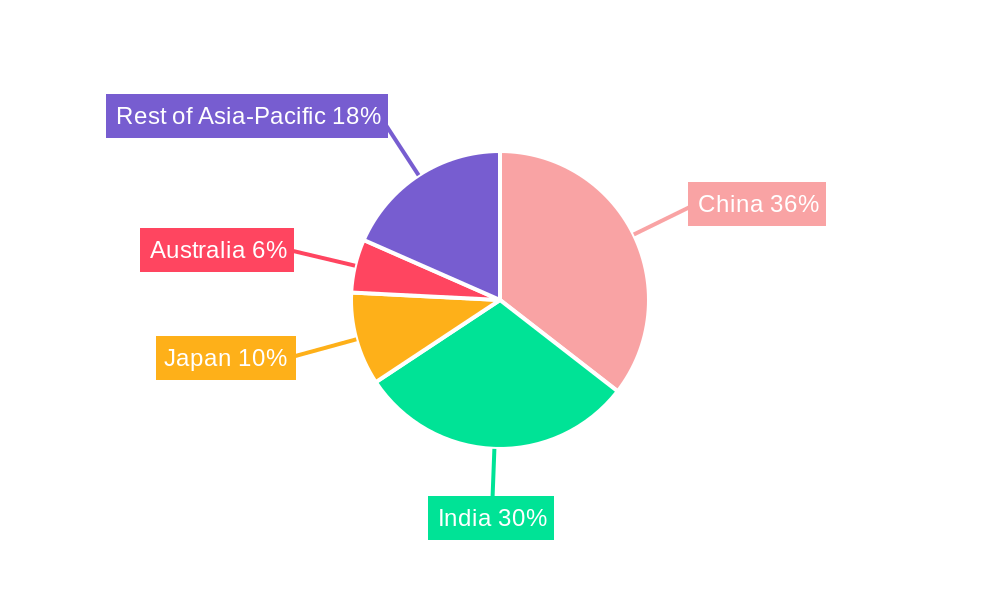
Dominant Regions, Countries, or Segments in APAC Cane Sugar Market
India stands out as a dominant force in the APAC Cane Sugar Market, driven by its extensive sugarcane cultivation, strong domestic consumption, and significant export capabilities. The Conventional Cane Sugar segment, in particular, underpins the market's substantial size due to widespread application across food and beverage industries. However, the Organic Cane Sugar segment is experiencing remarkable growth, reflecting a global trend towards healthier and sustainably sourced products. Within geographical segments, China and India are paramount due to their sheer population size and burgeoning demand for sugar in confectionery, beverages, and processed foods. Australia also holds a significant position, particularly in terms of efficient production and export.
- Dominant Segment: Conventional Cane Sugar, owing to its established presence and wide array of applications.
- Fastest Growing Segment: Organic Cane Sugar, propelled by increasing health consciousness and sustainability awareness.
- Leading Geographies:
- India: Massive domestic market, significant production capacity, and export potential.
- China: High demand from food processing industries and a growing middle class.
- Australia: Advanced agricultural practices and a key exporter of raw sugar.
- Key Drivers of Dominance:
- Economic Policies: Government support for agriculture and trade agreements.
- Infrastructure: Robust supply chain networks and processing facilities.
- Consumer Demand: Growing preference for processed foods and beverages, and increasing health awareness.
- Agricultural Productivity: Favorable climate conditions and advanced farming techniques in key regions.
APAC Cane Sugar Market Product Landscape
The APAC Cane Sugar Market product landscape is diverse, encompassing raw, refined, and specialty sugars. Innovations focus on enhancing purity, developing functional sugar derivatives, and creating value-added products like molasses and ethanol. Crystallized sugar remains the dominant form, but liquid syrup formulations are gaining traction in beverage and industrial applications. The application spectrum is broad, with bakery and confectionery, dairy, and beverages being major consumers. Performance metrics emphasize sucrose content, purity levels, and moisture control. Unique selling propositions often revolve around sustainable farming practices, organic certification, and specific crystallization characteristics tailored for different industrial needs. Technological advancements are also geared towards reducing processing costs and environmental impact.
Key Drivers, Barriers & Challenges in APAC Cane Sugar Market
Key Drivers:
- Rising Disposable Incomes: Fueling demand for processed foods and beverages across the Asia-Pacific region.
- Growing Food & Beverage Industry: Significant consumption of sugar as a key ingredient.
- Increasing Health Consciousness: Driving demand for organic and naturally sourced sweeteners.
- Government Support: Policies promoting sugarcane cultivation and sugar production in key countries like India.
- Technological Advancements: Improvements in crop yield, extraction efficiency, and processing.
Barriers & Challenges:
- Price Volatility: Fluctuations in global sugar prices impacting profitability.
- Supply Chain Disruptions: Weather-related issues, geopolitical events, and logistical challenges.
- Regulatory Hurdles: Varying import/export policies and food safety standards across countries.
- Competition from Substitutes: Pressure from beet sugar, artificial sweeteners, and other sugar alternatives.
- Environmental Concerns: Water usage, land management, and waste disposal in sugarcane cultivation.
Emerging Opportunities in the APAC Cane Sugar Market
Emerging opportunities in the APAC Cane Sugar Market lie in the burgeoning demand for specialty sugars, including organic and fair-trade certified varieties, particularly in developing economies. The expansion of the functional food and beverage sector presents avenues for sugar derivatives and low-glycemic index sweeteners. Furthermore, the increasing focus on sustainability is opening doors for innovative processing techniques that minimize environmental impact and promote circular economy principles. Untapped markets within Southeast Asia and the Pacific Islands also offer significant growth potential with targeted market penetration strategies.
Growth Accelerators in the APAC Cane Sugar Market Industry
Technological breakthroughs in sugarcane breeding for higher sugar content and disease resistance are key growth accelerators. Strategic partnerships between sugar producers and downstream food and beverage manufacturers are fostering innovation and market access. Furthermore, governments' focus on promoting value-added products like bioethanol and bioplastics derived from sugarcane presents a significant opportunity for market expansion and diversification. The increasing adoption of precision agriculture techniques in sugarcane cultivation is also enhancing yields and reducing operational costs, thereby accelerating market growth.
Key Players Shaping the APAC Cane Sugar Market Market
- Triveni Engineering & Industries Ltd (Ganga Sugar Corporation)
- Louis Dreyfus Company B V
- Rajshree Sugars & Chemicals Limited
- American Sugar Refining Inc
- Tate & Lyle PLC
- Wilmar Sugar Australia Holdings Pty Ltd
- DCM Shriram Consolidated Limited
- Global Organics Ltd
- Rana Sugars Limited
- Nanning Sugar Industry Co Ltd
Notable Milestones in APAC Cane Sugar Market Sector
- December 2021: MSM Malaysia Holdings Bhd (MSM Malaysia) and Wilmar Sugar Pty Ltd (Wilmar Sugar) inked a collaboration agreement to build a sustainable sugar supply chain, focusing on traceability and sustainability performance based on the NDPE Sugar Policy.
- November 2021: DCM Shriram Ltd announced an investment of over USD 4.22 million to expand the capacity of sugar mills, capitalizing on increased sugarcane availability and consumer preference for refined sugar.
- November 2021: The Sugar Research Institute of Fiji released a new cane variety for commercial planting, boasting high sugar content leading to better yields and increased total sugar production.
In-Depth APAC Cane Sugar Market Market Outlook
The APAC Cane Sugar Market outlook is exceptionally positive, driven by sustained demand from expanding economies and a growing preference for natural and organic sweeteners. Future market potential is bolstered by ongoing investments in research and development for improved sugarcane varieties and sustainable processing technologies. Strategic opportunities lie in catering to the evolving consumer demand for healthier food options, expanding into niche markets for specialty sugars, and leveraging governmental initiatives promoting the sugar industry and its by-products. The market is poised for continued growth, offering attractive prospects for stakeholders who can effectively navigate its dynamic landscape.
APAC Cane Sugar Market Segmentation
-
1. Category
- 1.1. Organic
- 1.2. Conventional
-
2. Form
- 2.1. Crystallized Sugar
- 2.2. Liquid Syrup
-
3. Application
- 3.1. Bakery and Confectionery
- 3.2. Dairy
- 3.3. Beverages
- 3.4. Other Applications
-
4. Geography
- 4.1. China
- 4.2. Japan
- 4.3. India
- 4.4. Australia
- 4.5. Rest of Asia-Pacific
APAC Cane Sugar Market Segmentation By Geography
- 1. China
- 2. Japan
- 3. India
- 4. Australia
- 5. Rest of Asia Pacific
APAC Cane Sugar Market Regional Market Share
Geographic Coverage of APAC Cane Sugar Market
APAC Cane Sugar Market REPORT HIGHLIGHTS
| Aspects | Details |
|---|---|
| Study Period | 2020-2034 |
| Base Year | 2025 |
| Estimated Year | 2026 |
| Forecast Period | 2026-2034 |
| Historical Period | 2020-2025 |
| Growth Rate | CAGR of 5.4% from 2020-2034 |
| Segmentation |
|
Table of Contents
- 1. Introduction
- 1.1. Research Scope
- 1.2. Market Segmentation
- 1.3. Research Objective
- 1.4. Definitions and Assumptions
- 2. Executive Summary
- 2.1. Market Snapshot
- 3. Market Dynamics
- 3.1. Market Drivers
- 3.2. Market Restrains
- 3.3. Market Trends
- 3.4. Market Opportunities
- 4. Market Factor Analysis
- 4.1. Porters Five Forces
- 4.1.1. Bargaining Power of Suppliers
- 4.1.2. Bargaining Power of Buyers
- 4.1.3. Threat of New Entrants
- 4.1.4. Threat of Substitutes
- 4.1.5. Competitive Rivalry
- 4.2. PESTEL analysis
- 4.3. BCG Analysis
- 4.3.1. Stars (High Growth, High Market Share)
- 4.3.2. Cash Cows (Low Growth, High Market Share)
- 4.3.3. Question Mark (High Growth, Low Market Share)
- 4.3.4. Dogs (Low Growth, Low Market Share)
- 4.4. Ansoff Matrix Analysis
- 4.5. Supply Chain Analysis
- 4.6. Regulatory Landscape
- 4.7. Current Market Potential and Opportunity Assessment (TAM–SAM–SOM Framework)
- 4.8. VDR Analyst Note
- 4.1. Porters Five Forces
- 5. Market Analysis, Insights and Forecast 2021-2033
- 5.1. Market Analysis, Insights and Forecast - by Category
- 5.1.1. Organic
- 5.1.2. Conventional
- 5.2. Market Analysis, Insights and Forecast - by Form
- 5.2.1. Crystallized Sugar
- 5.2.2. Liquid Syrup
- 5.3. Market Analysis, Insights and Forecast - by Application
- 5.3.1. Bakery and Confectionery
- 5.3.2. Dairy
- 5.3.3. Beverages
- 5.3.4. Other Applications
- 5.4. Market Analysis, Insights and Forecast - by Geography
- 5.4.1. China
- 5.4.2. Japan
- 5.4.3. India
- 5.4.4. Australia
- 5.4.5. Rest of Asia-Pacific
- 5.5. Market Analysis, Insights and Forecast - by Region
- 5.5.1. China
- 5.5.2. Japan
- 5.5.3. India
- 5.5.4. Australia
- 5.5.5. Rest of Asia Pacific
- 5.1. Market Analysis, Insights and Forecast - by Category
- 6. Global APAC Cane Sugar Market Analysis, Insights and Forecast, 2021-2033
- 6.1. Market Analysis, Insights and Forecast - by Category
- 6.1.1. Organic
- 6.1.2. Conventional
- 6.2. Market Analysis, Insights and Forecast - by Form
- 6.2.1. Crystallized Sugar
- 6.2.2. Liquid Syrup
- 6.3. Market Analysis, Insights and Forecast - by Application
- 6.3.1. Bakery and Confectionery
- 6.3.2. Dairy
- 6.3.3. Beverages
- 6.3.4. Other Applications
- 6.4. Market Analysis, Insights and Forecast - by Geography
- 6.4.1. China
- 6.4.2. Japan
- 6.4.3. India
- 6.4.4. Australia
- 6.4.5. Rest of Asia-Pacific
- 6.1. Market Analysis, Insights and Forecast - by Category
- 7. China APAC Cane Sugar Market Analysis, Insights and Forecast, 2021-2033
- 7.1. Market Analysis, Insights and Forecast - by Category
- 7.1.1. Organic
- 7.1.2. Conventional
- 7.2. Market Analysis, Insights and Forecast - by Form
- 7.2.1. Crystallized Sugar
- 7.2.2. Liquid Syrup
- 7.3. Market Analysis, Insights and Forecast - by Application
- 7.3.1. Bakery and Confectionery
- 7.3.2. Dairy
- 7.3.3. Beverages
- 7.3.4. Other Applications
- 7.4. Market Analysis, Insights and Forecast - by Geography
- 7.4.1. China
- 7.4.2. Japan
- 7.4.3. India
- 7.4.4. Australia
- 7.4.5. Rest of Asia-Pacific
- 7.1. Market Analysis, Insights and Forecast - by Category
- 8. Japan APAC Cane Sugar Market Analysis, Insights and Forecast, 2021-2033
- 8.1. Market Analysis, Insights and Forecast - by Category
- 8.1.1. Organic
- 8.1.2. Conventional
- 8.2. Market Analysis, Insights and Forecast - by Form
- 8.2.1. Crystallized Sugar
- 8.2.2. Liquid Syrup
- 8.3. Market Analysis, Insights and Forecast - by Application
- 8.3.1. Bakery and Confectionery
- 8.3.2. Dairy
- 8.3.3. Beverages
- 8.3.4. Other Applications
- 8.4. Market Analysis, Insights and Forecast - by Geography
- 8.4.1. China
- 8.4.2. Japan
- 8.4.3. India
- 8.4.4. Australia
- 8.4.5. Rest of Asia-Pacific
- 8.1. Market Analysis, Insights and Forecast - by Category
- 9. India APAC Cane Sugar Market Analysis, Insights and Forecast, 2021-2033
- 9.1. Market Analysis, Insights and Forecast - by Category
- 9.1.1. Organic
- 9.1.2. Conventional
- 9.2. Market Analysis, Insights and Forecast - by Form
- 9.2.1. Crystallized Sugar
- 9.2.2. Liquid Syrup
- 9.3. Market Analysis, Insights and Forecast - by Application
- 9.3.1. Bakery and Confectionery
- 9.3.2. Dairy
- 9.3.3. Beverages
- 9.3.4. Other Applications
- 9.4. Market Analysis, Insights and Forecast - by Geography
- 9.4.1. China
- 9.4.2. Japan
- 9.4.3. India
- 9.4.4. Australia
- 9.4.5. Rest of Asia-Pacific
- 9.1. Market Analysis, Insights and Forecast - by Category
- 10. Australia APAC Cane Sugar Market Analysis, Insights and Forecast, 2021-2033
- 10.1. Market Analysis, Insights and Forecast - by Category
- 10.1.1. Organic
- 10.1.2. Conventional
- 10.2. Market Analysis, Insights and Forecast - by Form
- 10.2.1. Crystallized Sugar
- 10.2.2. Liquid Syrup
- 10.3. Market Analysis, Insights and Forecast - by Application
- 10.3.1. Bakery and Confectionery
- 10.3.2. Dairy
- 10.3.3. Beverages
- 10.3.4. Other Applications
- 10.4. Market Analysis, Insights and Forecast - by Geography
- 10.4.1. China
- 10.4.2. Japan
- 10.4.3. India
- 10.4.4. Australia
- 10.4.5. Rest of Asia-Pacific
- 10.1. Market Analysis, Insights and Forecast - by Category
- 11. Rest of Asia Pacific APAC Cane Sugar Market Analysis, Insights and Forecast, 2021-2033
- 11.1. Market Analysis, Insights and Forecast - by Category
- 11.1.1. Organic
- 11.1.2. Conventional
- 11.2. Market Analysis, Insights and Forecast - by Form
- 11.2.1. Crystallized Sugar
- 11.2.2. Liquid Syrup
- 11.3. Market Analysis, Insights and Forecast - by Application
- 11.3.1. Bakery and Confectionery
- 11.3.2. Dairy
- 11.3.3. Beverages
- 11.3.4. Other Applications
- 11.4. Market Analysis, Insights and Forecast - by Geography
- 11.4.1. China
- 11.4.2. Japan
- 11.4.3. India
- 11.4.4. Australia
- 11.4.5. Rest of Asia-Pacific
- 11.1. Market Analysis, Insights and Forecast - by Category
- 12. Competitive Analysis
- 12.1. Company Profiles
- 12.1.1 Triveni Engineering & Industries Ltd (Ganga Sugar Corporation)*List Not Exhaustive
- 12.1.1.1. Company Overview
- 12.1.1.2. Products
- 12.1.1.3. Company Financials
- 12.1.1.4. SWOT Analysis
- 12.1.2 Louis Dreyfus Company B V
- 12.1.2.1. Company Overview
- 12.1.2.2. Products
- 12.1.2.3. Company Financials
- 12.1.2.4. SWOT Analysis
- 12.1.3 Rajshree Sugars & Chemicals Limited
- 12.1.3.1. Company Overview
- 12.1.3.2. Products
- 12.1.3.3. Company Financials
- 12.1.3.4. SWOT Analysis
- 12.1.4 American Sugar Refining Inc
- 12.1.4.1. Company Overview
- 12.1.4.2. Products
- 12.1.4.3. Company Financials
- 12.1.4.4. SWOT Analysis
- 12.1.5 Tate & Lyle PLC
- 12.1.5.1. Company Overview
- 12.1.5.2. Products
- 12.1.5.3. Company Financials
- 12.1.5.4. SWOT Analysis
- 12.1.6 Wilmar Sugar Australia Holdings Pty Ltd
- 12.1.6.1. Company Overview
- 12.1.6.2. Products
- 12.1.6.3. Company Financials
- 12.1.6.4. SWOT Analysis
- 12.1.7 DCM Shriram Consolidated Limited
- 12.1.7.1. Company Overview
- 12.1.7.2. Products
- 12.1.7.3. Company Financials
- 12.1.7.4. SWOT Analysis
- 12.1.8 Global Organics Ltd
- 12.1.8.1. Company Overview
- 12.1.8.2. Products
- 12.1.8.3. Company Financials
- 12.1.8.4. SWOT Analysis
- 12.1.9 Rana Sugars Limited
- 12.1.9.1. Company Overview
- 12.1.9.2. Products
- 12.1.9.3. Company Financials
- 12.1.9.4. SWOT Analysis
- 12.1.10 Nanning Sugar Industry Co Ltd
- 12.1.10.1. Company Overview
- 12.1.10.2. Products
- 12.1.10.3. Company Financials
- 12.1.10.4. SWOT Analysis
- 12.1.1 Triveni Engineering & Industries Ltd (Ganga Sugar Corporation)*List Not Exhaustive
- 12.2. Market Entropy
- 12.2.1 Company's Key Areas Served
- 12.2.2 Recent Developments
- 12.3. Company Market Share Analysis 2025
- 12.3.1 Top 5 Companies Market Share Analysis
- 12.3.2 Top 3 Companies Market Share Analysis
- 12.4. List of Potential Customers
- 13. Research Methodology
List of Figures
- Figure 1: Global APAC Cane Sugar Market Revenue Breakdown (billion, %) by Region 2025 & 2033
- Figure 2: Global APAC Cane Sugar Market Volume Breakdown (k tons, %) by Region 2025 & 2033
- Figure 3: China APAC Cane Sugar Market Revenue (billion), by Category 2025 & 2033
- Figure 4: China APAC Cane Sugar Market Volume (k tons), by Category 2025 & 2033
- Figure 5: China APAC Cane Sugar Market Revenue Share (%), by Category 2025 & 2033
- Figure 6: China APAC Cane Sugar Market Volume Share (%), by Category 2025 & 2033
- Figure 7: China APAC Cane Sugar Market Revenue (billion), by Form 2025 & 2033
- Figure 8: China APAC Cane Sugar Market Volume (k tons), by Form 2025 & 2033
- Figure 9: China APAC Cane Sugar Market Revenue Share (%), by Form 2025 & 2033
- Figure 10: China APAC Cane Sugar Market Volume Share (%), by Form 2025 & 2033
- Figure 11: China APAC Cane Sugar Market Revenue (billion), by Application 2025 & 2033
- Figure 12: China APAC Cane Sugar Market Volume (k tons), by Application 2025 & 2033
- Figure 13: China APAC Cane Sugar Market Revenue Share (%), by Application 2025 & 2033
- Figure 14: China APAC Cane Sugar Market Volume Share (%), by Application 2025 & 2033
- Figure 15: China APAC Cane Sugar Market Revenue (billion), by Geography 2025 & 2033
- Figure 16: China APAC Cane Sugar Market Volume (k tons), by Geography 2025 & 2033
- Figure 17: China APAC Cane Sugar Market Revenue Share (%), by Geography 2025 & 2033
- Figure 18: China APAC Cane Sugar Market Volume Share (%), by Geography 2025 & 2033
- Figure 19: China APAC Cane Sugar Market Revenue (billion), by Country 2025 & 2033
- Figure 20: China APAC Cane Sugar Market Volume (k tons), by Country 2025 & 2033
- Figure 21: China APAC Cane Sugar Market Revenue Share (%), by Country 2025 & 2033
- Figure 22: China APAC Cane Sugar Market Volume Share (%), by Country 2025 & 2033
- Figure 23: Japan APAC Cane Sugar Market Revenue (billion), by Category 2025 & 2033
- Figure 24: Japan APAC Cane Sugar Market Volume (k tons), by Category 2025 & 2033
- Figure 25: Japan APAC Cane Sugar Market Revenue Share (%), by Category 2025 & 2033
- Figure 26: Japan APAC Cane Sugar Market Volume Share (%), by Category 2025 & 2033
- Figure 27: Japan APAC Cane Sugar Market Revenue (billion), by Form 2025 & 2033
- Figure 28: Japan APAC Cane Sugar Market Volume (k tons), by Form 2025 & 2033
- Figure 29: Japan APAC Cane Sugar Market Revenue Share (%), by Form 2025 & 2033
- Figure 30: Japan APAC Cane Sugar Market Volume Share (%), by Form 2025 & 2033
- Figure 31: Japan APAC Cane Sugar Market Revenue (billion), by Application 2025 & 2033
- Figure 32: Japan APAC Cane Sugar Market Volume (k tons), by Application 2025 & 2033
- Figure 33: Japan APAC Cane Sugar Market Revenue Share (%), by Application 2025 & 2033
- Figure 34: Japan APAC Cane Sugar Market Volume Share (%), by Application 2025 & 2033
- Figure 35: Japan APAC Cane Sugar Market Revenue (billion), by Geography 2025 & 2033
- Figure 36: Japan APAC Cane Sugar Market Volume (k tons), by Geography 2025 & 2033
- Figure 37: Japan APAC Cane Sugar Market Revenue Share (%), by Geography 2025 & 2033
- Figure 38: Japan APAC Cane Sugar Market Volume Share (%), by Geography 2025 & 2033
- Figure 39: Japan APAC Cane Sugar Market Revenue (billion), by Country 2025 & 2033
- Figure 40: Japan APAC Cane Sugar Market Volume (k tons), by Country 2025 & 2033
- Figure 41: Japan APAC Cane Sugar Market Revenue Share (%), by Country 2025 & 2033
- Figure 42: Japan APAC Cane Sugar Market Volume Share (%), by Country 2025 & 2033
- Figure 43: India APAC Cane Sugar Market Revenue (billion), by Category 2025 & 2033
- Figure 44: India APAC Cane Sugar Market Volume (k tons), by Category 2025 & 2033
- Figure 45: India APAC Cane Sugar Market Revenue Share (%), by Category 2025 & 2033
- Figure 46: India APAC Cane Sugar Market Volume Share (%), by Category 2025 & 2033
- Figure 47: India APAC Cane Sugar Market Revenue (billion), by Form 2025 & 2033
- Figure 48: India APAC Cane Sugar Market Volume (k tons), by Form 2025 & 2033
- Figure 49: India APAC Cane Sugar Market Revenue Share (%), by Form 2025 & 2033
- Figure 50: India APAC Cane Sugar Market Volume Share (%), by Form 2025 & 2033
- Figure 51: India APAC Cane Sugar Market Revenue (billion), by Application 2025 & 2033
- Figure 52: India APAC Cane Sugar Market Volume (k tons), by Application 2025 & 2033
- Figure 53: India APAC Cane Sugar Market Revenue Share (%), by Application 2025 & 2033
- Figure 54: India APAC Cane Sugar Market Volume Share (%), by Application 2025 & 2033
- Figure 55: India APAC Cane Sugar Market Revenue (billion), by Geography 2025 & 2033
- Figure 56: India APAC Cane Sugar Market Volume (k tons), by Geography 2025 & 2033
- Figure 57: India APAC Cane Sugar Market Revenue Share (%), by Geography 2025 & 2033
- Figure 58: India APAC Cane Sugar Market Volume Share (%), by Geography 2025 & 2033
- Figure 59: India APAC Cane Sugar Market Revenue (billion), by Country 2025 & 2033
- Figure 60: India APAC Cane Sugar Market Volume (k tons), by Country 2025 & 2033
- Figure 61: India APAC Cane Sugar Market Revenue Share (%), by Country 2025 & 2033
- Figure 62: India APAC Cane Sugar Market Volume Share (%), by Country 2025 & 2033
- Figure 63: Australia APAC Cane Sugar Market Revenue (billion), by Category 2025 & 2033
- Figure 64: Australia APAC Cane Sugar Market Volume (k tons), by Category 2025 & 2033
- Figure 65: Australia APAC Cane Sugar Market Revenue Share (%), by Category 2025 & 2033
- Figure 66: Australia APAC Cane Sugar Market Volume Share (%), by Category 2025 & 2033
- Figure 67: Australia APAC Cane Sugar Market Revenue (billion), by Form 2025 & 2033
- Figure 68: Australia APAC Cane Sugar Market Volume (k tons), by Form 2025 & 2033
- Figure 69: Australia APAC Cane Sugar Market Revenue Share (%), by Form 2025 & 2033
- Figure 70: Australia APAC Cane Sugar Market Volume Share (%), by Form 2025 & 2033
- Figure 71: Australia APAC Cane Sugar Market Revenue (billion), by Application 2025 & 2033
- Figure 72: Australia APAC Cane Sugar Market Volume (k tons), by Application 2025 & 2033
- Figure 73: Australia APAC Cane Sugar Market Revenue Share (%), by Application 2025 & 2033
- Figure 74: Australia APAC Cane Sugar Market Volume Share (%), by Application 2025 & 2033
- Figure 75: Australia APAC Cane Sugar Market Revenue (billion), by Geography 2025 & 2033
- Figure 76: Australia APAC Cane Sugar Market Volume (k tons), by Geography 2025 & 2033
- Figure 77: Australia APAC Cane Sugar Market Revenue Share (%), by Geography 2025 & 2033
- Figure 78: Australia APAC Cane Sugar Market Volume Share (%), by Geography 2025 & 2033
- Figure 79: Australia APAC Cane Sugar Market Revenue (billion), by Country 2025 & 2033
- Figure 80: Australia APAC Cane Sugar Market Volume (k tons), by Country 2025 & 2033
- Figure 81: Australia APAC Cane Sugar Market Revenue Share (%), by Country 2025 & 2033
- Figure 82: Australia APAC Cane Sugar Market Volume Share (%), by Country 2025 & 2033
- Figure 83: Rest of Asia Pacific APAC Cane Sugar Market Revenue (billion), by Category 2025 & 2033
- Figure 84: Rest of Asia Pacific APAC Cane Sugar Market Volume (k tons), by Category 2025 & 2033
- Figure 85: Rest of Asia Pacific APAC Cane Sugar Market Revenue Share (%), by Category 2025 & 2033
- Figure 86: Rest of Asia Pacific APAC Cane Sugar Market Volume Share (%), by Category 2025 & 2033
- Figure 87: Rest of Asia Pacific APAC Cane Sugar Market Revenue (billion), by Form 2025 & 2033
- Figure 88: Rest of Asia Pacific APAC Cane Sugar Market Volume (k tons), by Form 2025 & 2033
- Figure 89: Rest of Asia Pacific APAC Cane Sugar Market Revenue Share (%), by Form 2025 & 2033
- Figure 90: Rest of Asia Pacific APAC Cane Sugar Market Volume Share (%), by Form 2025 & 2033
- Figure 91: Rest of Asia Pacific APAC Cane Sugar Market Revenue (billion), by Application 2025 & 2033
- Figure 92: Rest of Asia Pacific APAC Cane Sugar Market Volume (k tons), by Application 2025 & 2033
- Figure 93: Rest of Asia Pacific APAC Cane Sugar Market Revenue Share (%), by Application 2025 & 2033
- Figure 94: Rest of Asia Pacific APAC Cane Sugar Market Volume Share (%), by Application 2025 & 2033
- Figure 95: Rest of Asia Pacific APAC Cane Sugar Market Revenue (billion), by Geography 2025 & 2033
- Figure 96: Rest of Asia Pacific APAC Cane Sugar Market Volume (k tons), by Geography 2025 & 2033
- Figure 97: Rest of Asia Pacific APAC Cane Sugar Market Revenue Share (%), by Geography 2025 & 2033
- Figure 98: Rest of Asia Pacific APAC Cane Sugar Market Volume Share (%), by Geography 2025 & 2033
- Figure 99: Rest of Asia Pacific APAC Cane Sugar Market Revenue (billion), by Country 2025 & 2033
- Figure 100: Rest of Asia Pacific APAC Cane Sugar Market Volume (k tons), by Country 2025 & 2033
- Figure 101: Rest of Asia Pacific APAC Cane Sugar Market Revenue Share (%), by Country 2025 & 2033
- Figure 102: Rest of Asia Pacific APAC Cane Sugar Market Volume Share (%), by Country 2025 & 2033
List of Tables
- Table 1: Global APAC Cane Sugar Market Revenue billion Forecast, by Category 2020 & 2033
- Table 2: Global APAC Cane Sugar Market Volume k tons Forecast, by Category 2020 & 2033
- Table 3: Global APAC Cane Sugar Market Revenue billion Forecast, by Form 2020 & 2033
- Table 4: Global APAC Cane Sugar Market Volume k tons Forecast, by Form 2020 & 2033
- Table 5: Global APAC Cane Sugar Market Revenue billion Forecast, by Application 2020 & 2033
- Table 6: Global APAC Cane Sugar Market Volume k tons Forecast, by Application 2020 & 2033
- Table 7: Global APAC Cane Sugar Market Revenue billion Forecast, by Geography 2020 & 2033
- Table 8: Global APAC Cane Sugar Market Volume k tons Forecast, by Geography 2020 & 2033
- Table 9: Global APAC Cane Sugar Market Revenue billion Forecast, by Region 2020 & 2033
- Table 10: Global APAC Cane Sugar Market Volume k tons Forecast, by Region 2020 & 2033
- Table 11: Global APAC Cane Sugar Market Revenue billion Forecast, by Category 2020 & 2033
- Table 12: Global APAC Cane Sugar Market Volume k tons Forecast, by Category 2020 & 2033
- Table 13: Global APAC Cane Sugar Market Revenue billion Forecast, by Form 2020 & 2033
- Table 14: Global APAC Cane Sugar Market Volume k tons Forecast, by Form 2020 & 2033
- Table 15: Global APAC Cane Sugar Market Revenue billion Forecast, by Application 2020 & 2033
- Table 16: Global APAC Cane Sugar Market Volume k tons Forecast, by Application 2020 & 2033
- Table 17: Global APAC Cane Sugar Market Revenue billion Forecast, by Geography 2020 & 2033
- Table 18: Global APAC Cane Sugar Market Volume k tons Forecast, by Geography 2020 & 2033
- Table 19: Global APAC Cane Sugar Market Revenue billion Forecast, by Country 2020 & 2033
- Table 20: Global APAC Cane Sugar Market Volume k tons Forecast, by Country 2020 & 2033
- Table 21: Global APAC Cane Sugar Market Revenue billion Forecast, by Category 2020 & 2033
- Table 22: Global APAC Cane Sugar Market Volume k tons Forecast, by Category 2020 & 2033
- Table 23: Global APAC Cane Sugar Market Revenue billion Forecast, by Form 2020 & 2033
- Table 24: Global APAC Cane Sugar Market Volume k tons Forecast, by Form 2020 & 2033
- Table 25: Global APAC Cane Sugar Market Revenue billion Forecast, by Application 2020 & 2033
- Table 26: Global APAC Cane Sugar Market Volume k tons Forecast, by Application 2020 & 2033
- Table 27: Global APAC Cane Sugar Market Revenue billion Forecast, by Geography 2020 & 2033
- Table 28: Global APAC Cane Sugar Market Volume k tons Forecast, by Geography 2020 & 2033
- Table 29: Global APAC Cane Sugar Market Revenue billion Forecast, by Country 2020 & 2033
- Table 30: Global APAC Cane Sugar Market Volume k tons Forecast, by Country 2020 & 2033
- Table 31: Global APAC Cane Sugar Market Revenue billion Forecast, by Category 2020 & 2033
- Table 32: Global APAC Cane Sugar Market Volume k tons Forecast, by Category 2020 & 2033
- Table 33: Global APAC Cane Sugar Market Revenue billion Forecast, by Form 2020 & 2033
- Table 34: Global APAC Cane Sugar Market Volume k tons Forecast, by Form 2020 & 2033
- Table 35: Global APAC Cane Sugar Market Revenue billion Forecast, by Application 2020 & 2033
- Table 36: Global APAC Cane Sugar Market Volume k tons Forecast, by Application 2020 & 2033
- Table 37: Global APAC Cane Sugar Market Revenue billion Forecast, by Geography 2020 & 2033
- Table 38: Global APAC Cane Sugar Market Volume k tons Forecast, by Geography 2020 & 2033
- Table 39: Global APAC Cane Sugar Market Revenue billion Forecast, by Country 2020 & 2033
- Table 40: Global APAC Cane Sugar Market Volume k tons Forecast, by Country 2020 & 2033
- Table 41: Global APAC Cane Sugar Market Revenue billion Forecast, by Category 2020 & 2033
- Table 42: Global APAC Cane Sugar Market Volume k tons Forecast, by Category 2020 & 2033
- Table 43: Global APAC Cane Sugar Market Revenue billion Forecast, by Form 2020 & 2033
- Table 44: Global APAC Cane Sugar Market Volume k tons Forecast, by Form 2020 & 2033
- Table 45: Global APAC Cane Sugar Market Revenue billion Forecast, by Application 2020 & 2033
- Table 46: Global APAC Cane Sugar Market Volume k tons Forecast, by Application 2020 & 2033
- Table 47: Global APAC Cane Sugar Market Revenue billion Forecast, by Geography 2020 & 2033
- Table 48: Global APAC Cane Sugar Market Volume k tons Forecast, by Geography 2020 & 2033
- Table 49: Global APAC Cane Sugar Market Revenue billion Forecast, by Country 2020 & 2033
- Table 50: Global APAC Cane Sugar Market Volume k tons Forecast, by Country 2020 & 2033
- Table 51: Global APAC Cane Sugar Market Revenue billion Forecast, by Category 2020 & 2033
- Table 52: Global APAC Cane Sugar Market Volume k tons Forecast, by Category 2020 & 2033
- Table 53: Global APAC Cane Sugar Market Revenue billion Forecast, by Form 2020 & 2033
- Table 54: Global APAC Cane Sugar Market Volume k tons Forecast, by Form 2020 & 2033
- Table 55: Global APAC Cane Sugar Market Revenue billion Forecast, by Application 2020 & 2033
- Table 56: Global APAC Cane Sugar Market Volume k tons Forecast, by Application 2020 & 2033
- Table 57: Global APAC Cane Sugar Market Revenue billion Forecast, by Geography 2020 & 2033
- Table 58: Global APAC Cane Sugar Market Volume k tons Forecast, by Geography 2020 & 2033
- Table 59: Global APAC Cane Sugar Market Revenue billion Forecast, by Country 2020 & 2033
- Table 60: Global APAC Cane Sugar Market Volume k tons Forecast, by Country 2020 & 2033
Frequently Asked Questions
1. What is the projected Compound Annual Growth Rate (CAGR) of the APAC Cane Sugar Market?
The projected CAGR is approximately 5.4%.
2. Which companies are prominent players in the APAC Cane Sugar Market?
Key companies in the market include Triveni Engineering & Industries Ltd (Ganga Sugar Corporation)*List Not Exhaustive, Louis Dreyfus Company B V, Rajshree Sugars & Chemicals Limited, American Sugar Refining Inc, Tate & Lyle PLC, Wilmar Sugar Australia Holdings Pty Ltd, DCM Shriram Consolidated Limited, Global Organics Ltd, Rana Sugars Limited, Nanning Sugar Industry Co Ltd.
3. What are the main segments of the APAC Cane Sugar Market?
The market segments include Category, Form, Application, Geography.
4. Can you provide details about the market size?
The market size is estimated to be USD 39.5 billion as of 2022.
5. What are some drivers contributing to market growth?
Growing Awareness About Insect & Other Alternative Proteins; Increasing Applications Surge Demand for Insect Protein.
6. What are the notable trends driving market growth?
Increased Trade of Organic Cane Sugar.
7. Are there any restraints impacting market growth?
Augmenting Market Penetration of Other Proteins.
8. Can you provide examples of recent developments in the market?
December 2021: MSM Malaysia Holdings Bhd (MSM Malaysia) and Wilmar Sugar Pty Ltd (Wilmar Sugar) inked a collaboration agreement to build a sustainable sugar supply chain. MSM Malaysia and Wilmar Sugar will embark on joint efforts to assist and support each other to pilot an approach to enable sustainable raw sugar sourcing within both companies' joint supply chains by focusing on traceability reporting of sugar supplies and monitoring sustainability performance based on the NDPE Sugar Policy.
9. What pricing options are available for accessing the report?
Pricing options include single-user, multi-user, and enterprise licenses priced at USD 4750, USD 5250, and USD 8750 respectively.
10. Is the market size provided in terms of value or volume?
The market size is provided in terms of value, measured in billion and volume, measured in k tons.
11. Are there any specific market keywords associated with the report?
Yes, the market keyword associated with the report is "APAC Cane Sugar Market," which aids in identifying and referencing the specific market segment covered.
12. How do I determine which pricing option suits my needs best?
The pricing options vary based on user requirements and access needs. Individual users may opt for single-user licenses, while businesses requiring broader access may choose multi-user or enterprise licenses for cost-effective access to the report.
13. Are there any additional resources or data provided in the APAC Cane Sugar Market report?
While the report offers comprehensive insights, it's advisable to review the specific contents or supplementary materials provided to ascertain if additional resources or data are available.
14. How can I stay updated on further developments or reports in the APAC Cane Sugar Market?
To stay informed about further developments, trends, and reports in the APAC Cane Sugar Market, consider subscribing to industry newsletters, following relevant companies and organizations, or regularly checking reputable industry news sources and publications.
Methodology
Step 1 - Identification of Relevant Samples Size from Population Database


Step 2 - Approaches for Defining Global Market Size (Value, Volume* & Price*)

Note*: In applicable scenarios
Step 3 - Data Sources
Primary Research
- Web Analytics
- Survey Reports
- Research Institute
- Latest Research Reports
- Opinion Leaders
Secondary Research
- Annual Reports
- White Paper
- Latest Press Release
- Industry Association
- Paid Database
- Investor Presentations

Step 4 - Data Triangulation
Involves using different sources of information in order to increase the validity of a study
These sources are likely to be stakeholders in a program - participants, other researchers, program staff, other community members, and so on.
Then we put all data in single framework & apply various statistical tools to find out the dynamic on the market.
During the analysis stage, feedback from the stakeholder groups would be compared to determine areas of agreement as well as areas of divergence

