

Key Insights
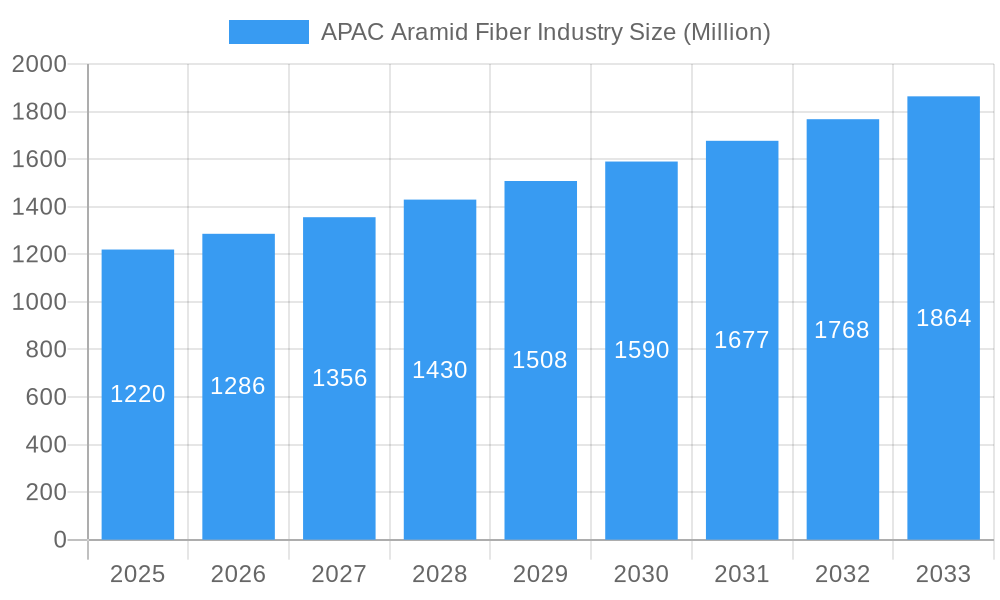
The APAC aramid fiber market, valued at $1.22 billion in 2025, is projected to experience robust growth, exceeding a 5% compound annual growth rate (CAGR) through 2033. This expansion is driven by several key factors. Firstly, the increasing demand for high-performance materials in diverse applications such as aerospace, automotive, and protective apparel fuels market growth. The region's burgeoning industrialization and infrastructure development projects further contribute to this demand. Secondly, technological advancements in aramid fiber production, leading to enhanced properties like improved strength-to-weight ratios and heat resistance, are driving adoption across various sectors. Government initiatives promoting the use of advanced materials in key industries also contribute positively to market expansion. Competitive pricing strategies from leading players like DuPont, Teijin Aramid, and Toray Industries are also making aramid fibers more accessible to a wider range of applications.
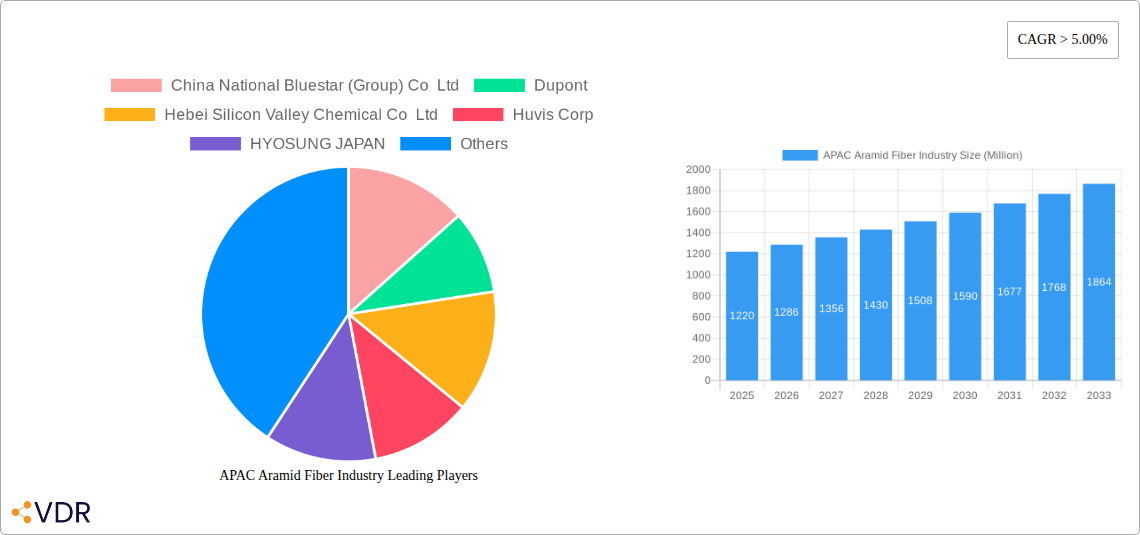
APAC Aramid Fiber Industry Market Size (In Billion)
However, the market faces some challenges. Fluctuations in raw material prices, particularly para-aramid, can impact profitability. Furthermore, the development and adoption of alternative high-performance materials, such as carbon fiber and ultra-high-molecular-weight polyethylene (UHMWPE), present competitive pressures. Stringent environmental regulations concerning the manufacturing processes of aramid fibers also pose a potential restraint on market growth. Despite these challenges, the long-term outlook for the APAC aramid fiber market remains positive, fueled by ongoing technological innovations, increasing industrial activity, and growing demand from diverse end-use sectors. The market is segmented by fiber type (para-aramid, meta-aramid), application (protective apparel, aerospace, industrial, automotive), and country (China, Japan, South Korea, India, etc.). The dominance of established players alongside emerging regional manufacturers indicates a dynamic and competitive landscape, characterized by innovation and expansion.
APAC Aramid Fiber Industry Company Market Share
APAC Aramid Fiber Industry Market Report: 2019-2033
This comprehensive report provides a detailed analysis of the Asia-Pacific (APAC) aramid fiber industry, encompassing market dynamics, growth trends, key players, and future outlook. Covering the period from 2019 to 2033, with a base year of 2025, this study offers invaluable insights for industry professionals, investors, and strategic decision-makers. The report segments the market into various categories (specific segments not detailed in prompt, will be represented as xx) providing a granular understanding of the market structure.
APAC Aramid Fiber Industry Market Dynamics & Structure
This section analyzes the APAC aramid fiber market's competitive landscape, technological advancements, regulatory environment, and market trends. The market is characterized by a moderate level of concentration, with key players holding significant market share. However, the emergence of new entrants and technological innovations is fostering increased competition. The market structure is influenced by factors such as economies of scale, technological capabilities, and access to raw materials. M&A activity has been moderate in recent years (xx deals in the last 5 years), driven primarily by strategic consolidation and expansion into new markets.
- Market Concentration: Moderate, with top 5 players holding xx% market share in 2025.
- Technological Innovation: Driven by advancements in fiber production techniques and the development of high-performance materials for specialized applications.
- Regulatory Frameworks: Vary across APAC countries, impacting manufacturing costs and product standards.
- Competitive Substitutes: Include other high-strength fibers like carbon fiber and UHMWPE, posing a competitive threat to aramid fiber.
- End-User Demographics: Driven by growth in aerospace, defense, automotive, and industrial sectors.
- M&A Trends: Moderate activity focused on consolidation and expansion into new geographical markets and applications.
APAC Aramid Fiber Industry Growth Trends & Insights
The APAC aramid fiber market exhibited a CAGR of xx% during the historical period (2019-2024) and is projected to grow at a CAGR of xx% during the forecast period (2025-2033). Market size is estimated at $xx Million in 2025 and is forecast to reach $xx Million by 2033. This growth is fueled by increasing demand from diverse end-use industries, particularly in the aerospace, automotive, and protective apparel segments. Technological advancements, such as the development of lighter and stronger aramid fibers, are further driving market expansion. Consumer preference for high-performance materials and increasing awareness of safety standards are also contributing to market growth. The market penetration rate is expected to increase from xx% in 2025 to xx% by 2033. The adoption of advanced manufacturing technologies is accelerating industry transformation and driving innovation. Technological disruptions are leading to improved fiber properties, cost reductions, and increased efficiency.
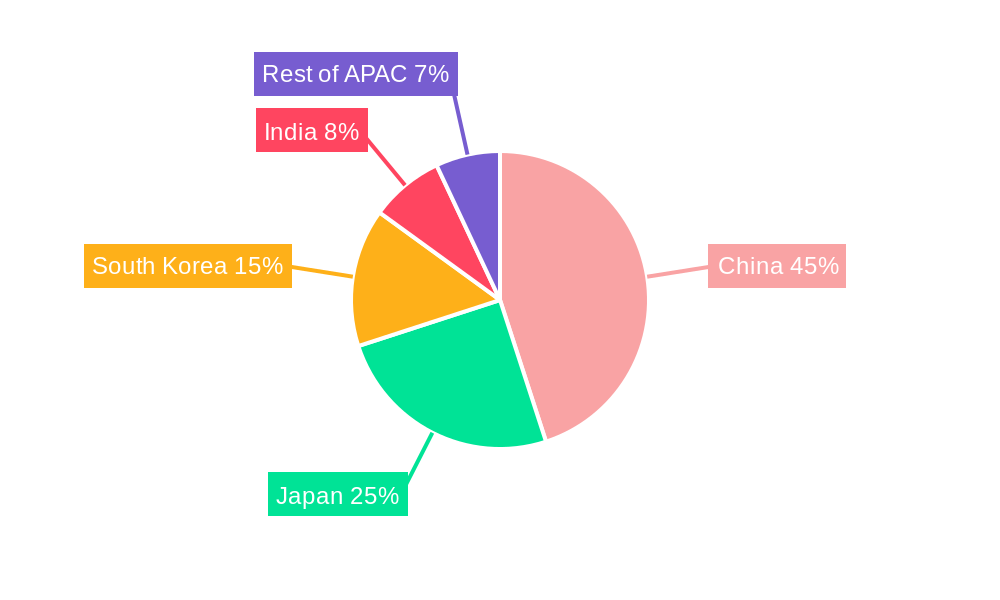
Dominant Regions, Countries, or Segments in APAC Aramid Fiber Industry
China dominates the APAC aramid fiber market, accounting for xx% of the regional market share in 2025, driven by robust industrial growth and a large domestic demand. Other key markets include Japan, South Korea, and India, each contributing significantly to the regional market volume. The growth in these regions is fueled by government initiatives to support infrastructure development, coupled with expansion of manufacturing capacities and technological advancements.
- Key Drivers:
- Strong industrial growth in China and India.
- Favorable government policies and infrastructure development initiatives.
- Increasing adoption of aramid fiber in diverse industries.
- Dominance Factors: China's large manufacturing base, established supply chains, and low production costs contribute significantly to its market dominance. Japan and South Korea benefit from technological leadership and advanced manufacturing capabilities.
APAC Aramid Fiber Industry Product Landscape
The APAC aramid fiber market offers a diverse range of products with varying properties and applications. Innovations focus on enhancing fiber strength, durability, and heat resistance. High-performance aramid fibers find applications in aerospace components, bulletproof vests, automotive parts, and industrial reinforcement materials. Key product differentiators include tensile strength, modulus, heat resistance, and ease of processing. Technological advancements are geared toward optimizing fiber properties, processing efficiency, and cost reduction.
Key Drivers, Barriers & Challenges in APAC Aramid Fiber Industry
Key Drivers: Increasing demand from various end-use industries, technological innovations improving fiber properties and production efficiency, government support for infrastructure development.
Key Challenges: Fluctuations in raw material prices, intense competition from substitute materials, environmental concerns associated with fiber production, and supply chain disruptions. The impact of these challenges on market growth is estimated at approximately xx% reduction in the growth rate for the forecast period.
Emerging Opportunities in APAC Aramid Fiber Industry
Emerging opportunities include expansion into new applications like advanced composites for renewable energy infrastructure, development of biodegradable aramid fibers, and increased use in specialized protective equipment. Untapped markets in Southeast Asia and other emerging economies present significant growth potential.
Growth Accelerators in the APAC Aramid Fiber Industry
Technological breakthroughs in fiber production, strategic collaborations between manufacturers and end-users, and expansion into high-growth markets are key catalysts driving long-term market growth. The development of sustainable manufacturing processes will also play a significant role.
Key Players Shaping the APAC Aramid Fiber Industry Market
- China National Bluestar (Group) Co Ltd
- Dupont
- Hebei Silicon Valley Chemical Co Ltd
- Huvis Corp
- HYOSUNG JAPAN
- KERMEL
- Kolon Industries Inc
- Shanghai J&S New Materials Co ltd
- Teijin Aramid
- TORAY INDUSTRIES INC
- X-FIPER New Material Co Ltd
- Yantai Tayho Advanced Materials Co Ltd
- (List Not Exhaustive)
Notable Milestones in APAC Aramid Fiber Industry Sector
- 2022: Teijin Aramid launched a new high-strength aramid fiber for aerospace applications.
- 2023: A major merger between two significant players in the Chinese aramid fiber market. (Specifics not available)
- (Further milestones will be detailed in the complete report)
In-Depth APAC Aramid Fiber Industry Market Outlook
The APAC aramid fiber market is poised for robust growth driven by increasing demand from various end-use sectors and continuous technological innovations. Strategic partnerships, expansion into high-growth markets, and development of sustainable manufacturing processes will be crucial for maximizing future market potential. The industry will face challenges related to raw material costs and competition from substitute materials, but continued technological advancements and innovation should mitigate these challenges.
APAC Aramid Fiber Industry Segmentation
-
1. Product Type
- 1.1. Para-aramid
- 1.2. Meta-aramid
-
2. End-user Industry
- 2.1. Aerospace and Defense
- 2.2. Automotive
- 2.3. Electrical and Electronics
- 2.4. Sporting Goods
- 2.5. Other En
-
3. Geography
-
3.1. Asia-Pacific
- 3.1.1. China
- 3.1.2. India
- 3.1.3. Japan
- 3.1.4. South Korea
- 3.1.5. Malaysia
- 3.1.6. Thailand
- 3.1.7. Indonesia
- 3.1.8. Vietnam
- 3.1.9. Rest of Asia-Pacific
-
3.1. Asia-Pacific
APAC Aramid Fiber Industry Segmentation By Geography
-
1. Asia Pacific
- 1.1. China
- 1.2. India
- 1.3. Japan
- 1.4. South Korea
- 1.5. Malaysia
- 1.6. Thailand
- 1.7. Indonesia
- 1.8. Vietnam
- 1.9. Rest of Asia Pacific
APAC Aramid Fiber Industry Regional Market Share
Geographic Coverage of APAC Aramid Fiber Industry
APAC Aramid Fiber Industry REPORT HIGHLIGHTS
| Aspects | Details |
|---|---|
| Study Period | 2020-2034 |
| Base Year | 2025 |
| Estimated Year | 2026 |
| Forecast Period | 2026-2034 |
| Historical Period | 2020-2025 |
| Growth Rate | CAGR of > 5.00% from 2020-2034 |
| Segmentation |
|
Table of Contents
- 1. Introduction
- 1.1. Research Scope
- 1.2. Market Segmentation
- 1.3. Research Objective
- 1.4. Definitions and Assumptions
- 2. Executive Summary
- 2.1. Market Snapshot
- 3. Market Dynamics
- 3.1. Market Drivers
- 3.2. Market Restrains
- 3.3. Market Trends
- 3.4. Market Opportunities
- 4. Market Factor Analysis
- 4.1. Porters Five Forces
- 4.1.1. Bargaining Power of Suppliers
- 4.1.2. Bargaining Power of Buyers
- 4.1.3. Threat of New Entrants
- 4.1.4. Threat of Substitutes
- 4.1.5. Competitive Rivalry
- 4.2. PESTEL analysis
- 4.3. BCG Analysis
- 4.3.1. Stars (High Growth, High Market Share)
- 4.3.2. Cash Cows (Low Growth, High Market Share)
- 4.3.3. Question Mark (High Growth, Low Market Share)
- 4.3.4. Dogs (Low Growth, Low Market Share)
- 4.4. Ansoff Matrix Analysis
- 4.5. Supply Chain Analysis
- 4.6. Regulatory Landscape
- 4.7. Current Market Potential and Opportunity Assessment (TAM–SAM–SOM Framework)
- 4.8. VDR Analyst Note
- 4.1. Porters Five Forces
- 5. Market Analysis, Insights and Forecast 2021-2033
- 5.1. Market Analysis, Insights and Forecast - by Product Type
- 5.1.1. Para-aramid
- 5.1.2. Meta-aramid
- 5.2. Market Analysis, Insights and Forecast - by End-user Industry
- 5.2.1. Aerospace and Defense
- 5.2.2. Automotive
- 5.2.3. Electrical and Electronics
- 5.2.4. Sporting Goods
- 5.2.5. Other En
- 5.3. Market Analysis, Insights and Forecast - by Geography
- 5.3.1. Asia-Pacific
- 5.3.1.1. China
- 5.3.1.2. India
- 5.3.1.3. Japan
- 5.3.1.4. South Korea
- 5.3.1.5. Malaysia
- 5.3.1.6. Thailand
- 5.3.1.7. Indonesia
- 5.3.1.8. Vietnam
- 5.3.1.9. Rest of Asia-Pacific
- 5.3.1. Asia-Pacific
- 5.4. Market Analysis, Insights and Forecast - by Region
- 5.4.1. Asia Pacific
- 5.1. Market Analysis, Insights and Forecast - by Product Type
- 6. Global APAC Aramid Fiber Industry Analysis, Insights and Forecast, 2021-2033
- 6.1. Market Analysis, Insights and Forecast - by Product Type
- 6.1.1. Para-aramid
- 6.1.2. Meta-aramid
- 6.2. Market Analysis, Insights and Forecast - by End-user Industry
- 6.2.1. Aerospace and Defense
- 6.2.2. Automotive
- 6.2.3. Electrical and Electronics
- 6.2.4. Sporting Goods
- 6.2.5. Other En
- 6.3. Market Analysis, Insights and Forecast - by Geography
- 6.3.1. Asia-Pacific
- 6.3.1.1. China
- 6.3.1.2. India
- 6.3.1.3. Japan
- 6.3.1.4. South Korea
- 6.3.1.5. Malaysia
- 6.3.1.6. Thailand
- 6.3.1.7. Indonesia
- 6.3.1.8. Vietnam
- 6.3.1.9. Rest of Asia-Pacific
- 6.3.1. Asia-Pacific
- 6.1. Market Analysis, Insights and Forecast - by Product Type
- 7. Competitive Analysis
- 7.1. Company Profiles
- 7.1.1 China National Bluestar (Group) Co Ltd
- 7.1.1.1. Company Overview
- 7.1.1.2. Products
- 7.1.1.3. Company Financials
- 7.1.1.4. SWOT Analysis
- 7.1.2 Dupont
- 7.1.2.1. Company Overview
- 7.1.2.2. Products
- 7.1.2.3. Company Financials
- 7.1.2.4. SWOT Analysis
- 7.1.3 Hebei Silicon Valley Chemical Co Ltd
- 7.1.3.1. Company Overview
- 7.1.3.2. Products
- 7.1.3.3. Company Financials
- 7.1.3.4. SWOT Analysis
- 7.1.4 Huvis Corp
- 7.1.4.1. Company Overview
- 7.1.4.2. Products
- 7.1.4.3. Company Financials
- 7.1.4.4. SWOT Analysis
- 7.1.5 HYOSUNG JAPAN
- 7.1.5.1. Company Overview
- 7.1.5.2. Products
- 7.1.5.3. Company Financials
- 7.1.5.4. SWOT Analysis
- 7.1.6 KERMEL
- 7.1.6.1. Company Overview
- 7.1.6.2. Products
- 7.1.6.3. Company Financials
- 7.1.6.4. SWOT Analysis
- 7.1.7 Kolon Industries Inc
- 7.1.7.1. Company Overview
- 7.1.7.2. Products
- 7.1.7.3. Company Financials
- 7.1.7.4. SWOT Analysis
- 7.1.8 Shanghai J&S New Materials Co ltd
- 7.1.8.1. Company Overview
- 7.1.8.2. Products
- 7.1.8.3. Company Financials
- 7.1.8.4. SWOT Analysis
- 7.1.9 Teijin Aramid
- 7.1.9.1. Company Overview
- 7.1.9.2. Products
- 7.1.9.3. Company Financials
- 7.1.9.4. SWOT Analysis
- 7.1.10 TORAY INDUSTRIES INC
- 7.1.10.1. Company Overview
- 7.1.10.2. Products
- 7.1.10.3. Company Financials
- 7.1.10.4. SWOT Analysis
- 7.1.11 X-FIPER New Material Co Ltd
- 7.1.11.1. Company Overview
- 7.1.11.2. Products
- 7.1.11.3. Company Financials
- 7.1.11.4. SWOT Analysis
- 7.1.12 Yantai Tayho Advanced Materials Co Ltd *List Not Exhaustive
- 7.1.12.1. Company Overview
- 7.1.12.2. Products
- 7.1.12.3. Company Financials
- 7.1.12.4. SWOT Analysis
- 7.1.1 China National Bluestar (Group) Co Ltd
- 7.2. Market Entropy
- 7.2.1 Company's Key Areas Served
- 7.2.2 Recent Developments
- 7.3. Company Market Share Analysis 2025
- 7.3.1 Top 5 Companies Market Share Analysis
- 7.3.2 Top 3 Companies Market Share Analysis
- 7.4. List of Potential Customers
- 8. Research Methodology
List of Figures
- Figure 1: Global APAC Aramid Fiber Industry Revenue Breakdown (Million, %) by Region 2025 & 2033
- Figure 2: Global APAC Aramid Fiber Industry Volume Breakdown (Billion, %) by Region 2025 & 2033
- Figure 3: Asia Pacific APAC Aramid Fiber Industry Revenue (Million), by Product Type 2025 & 2033
- Figure 4: Asia Pacific APAC Aramid Fiber Industry Volume (Billion), by Product Type 2025 & 2033
- Figure 5: Asia Pacific APAC Aramid Fiber Industry Revenue Share (%), by Product Type 2025 & 2033
- Figure 6: Asia Pacific APAC Aramid Fiber Industry Volume Share (%), by Product Type 2025 & 2033
- Figure 7: Asia Pacific APAC Aramid Fiber Industry Revenue (Million), by End-user Industry 2025 & 2033
- Figure 8: Asia Pacific APAC Aramid Fiber Industry Volume (Billion), by End-user Industry 2025 & 2033
- Figure 9: Asia Pacific APAC Aramid Fiber Industry Revenue Share (%), by End-user Industry 2025 & 2033
- Figure 10: Asia Pacific APAC Aramid Fiber Industry Volume Share (%), by End-user Industry 2025 & 2033
- Figure 11: Asia Pacific APAC Aramid Fiber Industry Revenue (Million), by Geography 2025 & 2033
- Figure 12: Asia Pacific APAC Aramid Fiber Industry Volume (Billion), by Geography 2025 & 2033
- Figure 13: Asia Pacific APAC Aramid Fiber Industry Revenue Share (%), by Geography 2025 & 2033
- Figure 14: Asia Pacific APAC Aramid Fiber Industry Volume Share (%), by Geography 2025 & 2033
- Figure 15: Asia Pacific APAC Aramid Fiber Industry Revenue (Million), by Country 2025 & 2033
- Figure 16: Asia Pacific APAC Aramid Fiber Industry Volume (Billion), by Country 2025 & 2033
- Figure 17: Asia Pacific APAC Aramid Fiber Industry Revenue Share (%), by Country 2025 & 2033
- Figure 18: Asia Pacific APAC Aramid Fiber Industry Volume Share (%), by Country 2025 & 2033
List of Tables
- Table 1: Global APAC Aramid Fiber Industry Revenue Million Forecast, by Product Type 2020 & 2033
- Table 2: Global APAC Aramid Fiber Industry Volume Billion Forecast, by Product Type 2020 & 2033
- Table 3: Global APAC Aramid Fiber Industry Revenue Million Forecast, by End-user Industry 2020 & 2033
- Table 4: Global APAC Aramid Fiber Industry Volume Billion Forecast, by End-user Industry 2020 & 2033
- Table 5: Global APAC Aramid Fiber Industry Revenue Million Forecast, by Geography 2020 & 2033
- Table 6: Global APAC Aramid Fiber Industry Volume Billion Forecast, by Geography 2020 & 2033
- Table 7: Global APAC Aramid Fiber Industry Revenue Million Forecast, by Region 2020 & 2033
- Table 8: Global APAC Aramid Fiber Industry Volume Billion Forecast, by Region 2020 & 2033
- Table 9: Global APAC Aramid Fiber Industry Revenue Million Forecast, by Product Type 2020 & 2033
- Table 10: Global APAC Aramid Fiber Industry Volume Billion Forecast, by Product Type 2020 & 2033
- Table 11: Global APAC Aramid Fiber Industry Revenue Million Forecast, by End-user Industry 2020 & 2033
- Table 12: Global APAC Aramid Fiber Industry Volume Billion Forecast, by End-user Industry 2020 & 2033
- Table 13: Global APAC Aramid Fiber Industry Revenue Million Forecast, by Geography 2020 & 2033
- Table 14: Global APAC Aramid Fiber Industry Volume Billion Forecast, by Geography 2020 & 2033
- Table 15: Global APAC Aramid Fiber Industry Revenue Million Forecast, by Country 2020 & 2033
- Table 16: Global APAC Aramid Fiber Industry Volume Billion Forecast, by Country 2020 & 2033
- Table 17: China APAC Aramid Fiber Industry Revenue (Million) Forecast, by Application 2020 & 2033
- Table 18: China APAC Aramid Fiber Industry Volume (Billion) Forecast, by Application 2020 & 2033
- Table 19: India APAC Aramid Fiber Industry Revenue (Million) Forecast, by Application 2020 & 2033
- Table 20: India APAC Aramid Fiber Industry Volume (Billion) Forecast, by Application 2020 & 2033
- Table 21: Japan APAC Aramid Fiber Industry Revenue (Million) Forecast, by Application 2020 & 2033
- Table 22: Japan APAC Aramid Fiber Industry Volume (Billion) Forecast, by Application 2020 & 2033
- Table 23: South Korea APAC Aramid Fiber Industry Revenue (Million) Forecast, by Application 2020 & 2033
- Table 24: South Korea APAC Aramid Fiber Industry Volume (Billion) Forecast, by Application 2020 & 2033
- Table 25: Malaysia APAC Aramid Fiber Industry Revenue (Million) Forecast, by Application 2020 & 2033
- Table 26: Malaysia APAC Aramid Fiber Industry Volume (Billion) Forecast, by Application 2020 & 2033
- Table 27: Thailand APAC Aramid Fiber Industry Revenue (Million) Forecast, by Application 2020 & 2033
- Table 28: Thailand APAC Aramid Fiber Industry Volume (Billion) Forecast, by Application 2020 & 2033
- Table 29: Indonesia APAC Aramid Fiber Industry Revenue (Million) Forecast, by Application 2020 & 2033
- Table 30: Indonesia APAC Aramid Fiber Industry Volume (Billion) Forecast, by Application 2020 & 2033
- Table 31: Vietnam APAC Aramid Fiber Industry Revenue (Million) Forecast, by Application 2020 & 2033
- Table 32: Vietnam APAC Aramid Fiber Industry Volume (Billion) Forecast, by Application 2020 & 2033
- Table 33: Rest of Asia Pacific APAC Aramid Fiber Industry Revenue (Million) Forecast, by Application 2020 & 2033
- Table 34: Rest of Asia Pacific APAC Aramid Fiber Industry Volume (Billion) Forecast, by Application 2020 & 2033
Frequently Asked Questions
1. What is the projected Compound Annual Growth Rate (CAGR) of the APAC Aramid Fiber Industry?
The projected CAGR is approximately > 5.00%.
2. Which companies are prominent players in the APAC Aramid Fiber Industry?
Key companies in the market include China National Bluestar (Group) Co Ltd, Dupont, Hebei Silicon Valley Chemical Co Ltd, Huvis Corp, HYOSUNG JAPAN, KERMEL, Kolon Industries Inc, Shanghai J&S New Materials Co ltd, Teijin Aramid, TORAY INDUSTRIES INC, X-FIPER New Material Co Ltd, Yantai Tayho Advanced Materials Co Ltd *List Not Exhaustive.
3. What are the main segments of the APAC Aramid Fiber Industry?
The market segments include Product Type, End-user Industry, Geography.
4. Can you provide details about the market size?
The market size is estimated to be USD 1.22 Million as of 2022.
5. What are some drivers contributing to market growth?
The Increase in Demand for Light Weight Materials in Automotive Industry; The Rising Defense Expenditure of India and China; The Increase in Usage of Aramid Fibers as a Potential Substitute for Steel Materials.
6. What are the notable trends driving market growth?
Aerospace and Defense End-User Industry to Dominated the Market.
7. Are there any restraints impacting market growth?
The Increase in Demand for Light Weight Materials in Automotive Industry; The Rising Defense Expenditure of India and China; The Increase in Usage of Aramid Fibers as a Potential Substitute for Steel Materials.
8. Can you provide examples of recent developments in the market?
The recent developments pertaining to the major players in the market are being covered in the complete study.
9. What pricing options are available for accessing the report?
Pricing options include single-user, multi-user, and enterprise licenses priced at USD 4750, USD 5250, and USD 8750 respectively.
10. Is the market size provided in terms of value or volume?
The market size is provided in terms of value, measured in Million and volume, measured in Billion.
11. Are there any specific market keywords associated with the report?
Yes, the market keyword associated with the report is "APAC Aramid Fiber Industry," which aids in identifying and referencing the specific market segment covered.
12. How do I determine which pricing option suits my needs best?
The pricing options vary based on user requirements and access needs. Individual users may opt for single-user licenses, while businesses requiring broader access may choose multi-user or enterprise licenses for cost-effective access to the report.
13. Are there any additional resources or data provided in the APAC Aramid Fiber Industry report?
While the report offers comprehensive insights, it's advisable to review the specific contents or supplementary materials provided to ascertain if additional resources or data are available.
14. How can I stay updated on further developments or reports in the APAC Aramid Fiber Industry?
To stay informed about further developments, trends, and reports in the APAC Aramid Fiber Industry, consider subscribing to industry newsletters, following relevant companies and organizations, or regularly checking reputable industry news sources and publications.
Methodology
Step 1 - Identification of Relevant Samples Size from Population Database


Step 2 - Approaches for Defining Global Market Size (Value, Volume* & Price*)

Note*: In applicable scenarios
Step 3 - Data Sources
Primary Research
- Web Analytics
- Survey Reports
- Research Institute
- Latest Research Reports
- Opinion Leaders
Secondary Research
- Annual Reports
- White Paper
- Latest Press Release
- Industry Association
- Paid Database
- Investor Presentations

Step 4 - Data Triangulation
Involves using different sources of information in order to increase the validity of a study
These sources are likely to be stakeholders in a program - participants, other researchers, program staff, other community members, and so on.
Then we put all data in single framework & apply various statistical tools to find out the dynamic on the market.
During the analysis stage, feedback from the stakeholder groups would be compared to determine areas of agreement as well as areas of divergence