

Key Insights
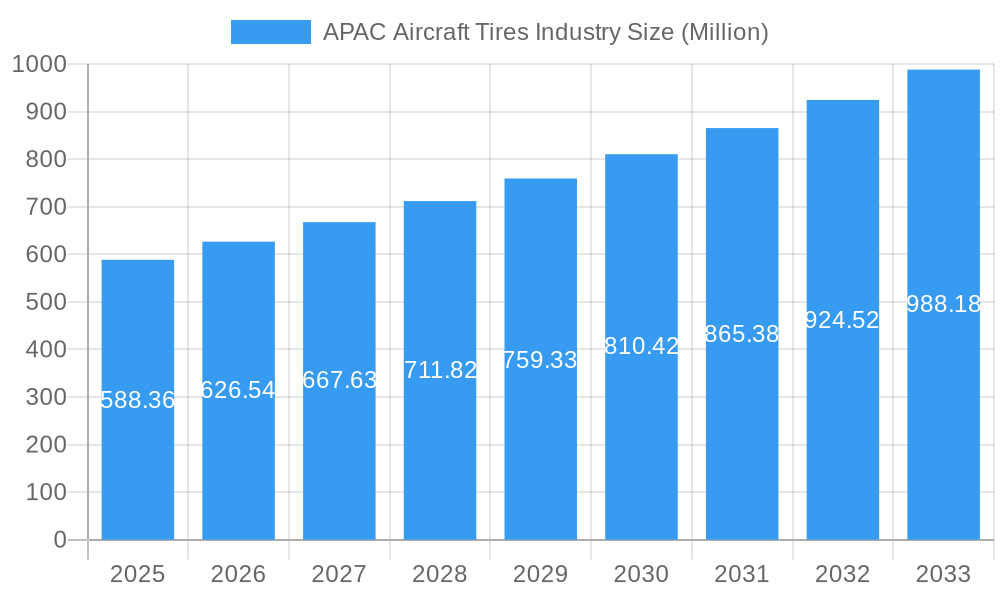
The Asia-Pacific (APAC) aircraft tire market, valued at $588.36 million in 2025, is projected to experience robust growth, driven by a Compound Annual Growth Rate (CAGR) of 6.35% from 2025 to 2033. This expansion is fueled by several key factors. The region's burgeoning air travel sector, particularly in countries like China and India, significantly contributes to the increasing demand for aircraft tires. Furthermore, the rise of low-cost carriers and the expansion of air freight services are bolstering market growth. Technological advancements in tire materials and manufacturing processes, leading to improved durability, fuel efficiency, and enhanced safety features, are also contributing positively. While the impact of global economic fluctuations and potential supply chain disruptions presents some challenges, the long-term outlook remains positive, anticipating substantial growth across various segments including radial and bias tires for commercial, military, and general aviation applications. Competition among established players such as Bridgestone, Goodyear, Michelin, and regional manufacturers like MRF and Sentury will likely intensify, leading to innovation and potentially more competitive pricing.
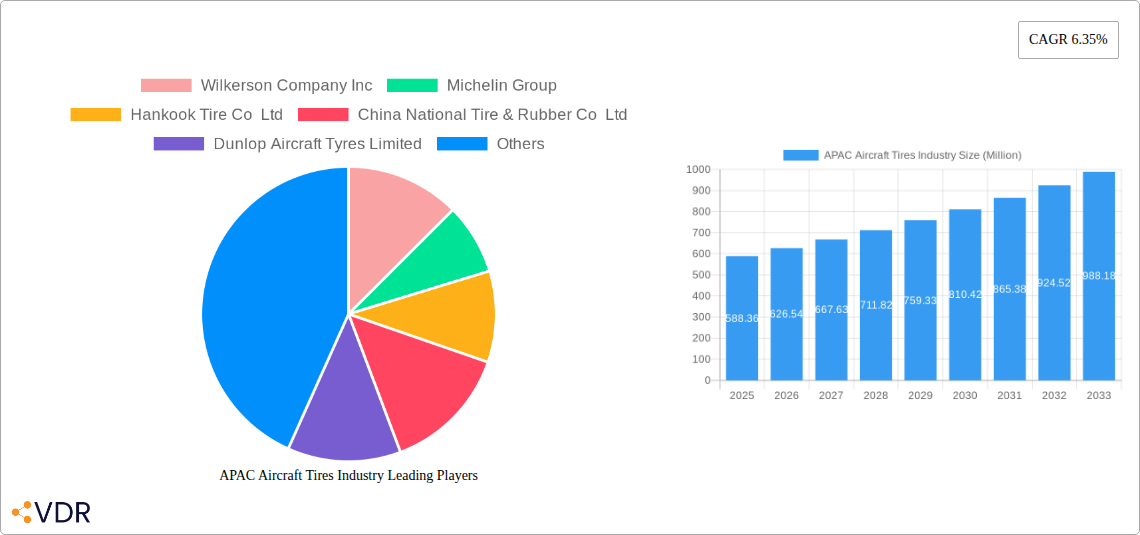
APAC Aircraft Tires Industry Market Size (In Million)
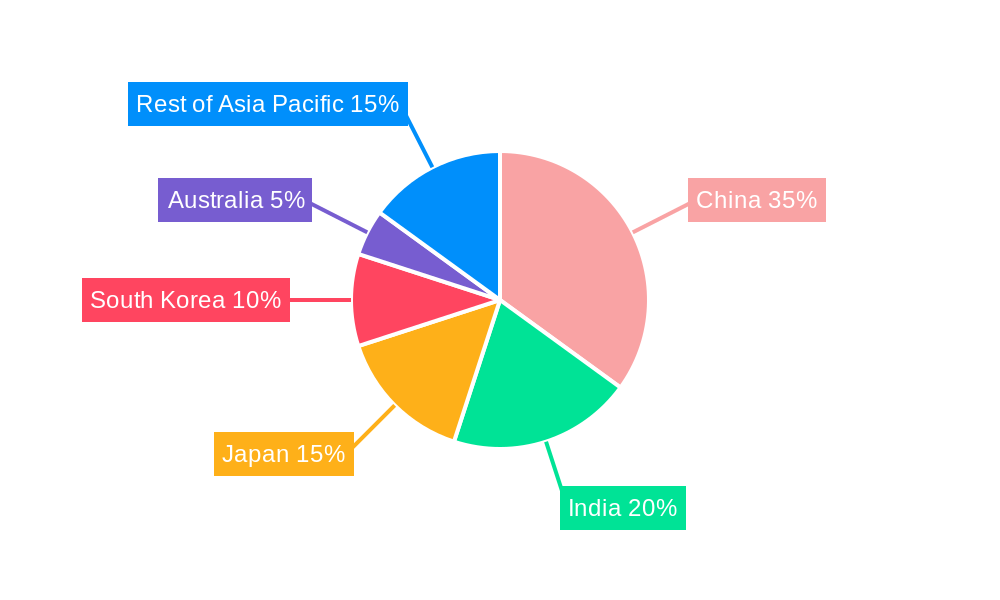
The market segmentation reveals a strong preference for radial tires, benefiting from their superior performance characteristics. Commercial aviation accounts for the largest share of the market due to the high volume of passenger and cargo flights in the region. However, growth in military and general aviation segments is also expected, driven by modernization programs and increasing private air travel. While precise regional breakdowns for China, India, Japan, South Korea, Australia, and the Rest of Asia Pacific are unavailable, a logical estimation based on air traffic data and economic growth projections suggests that China and India will dominate the market share, followed by Japan and South Korea. Australia and the Rest of Asia Pacific will contribute to overall growth, albeit at a smaller scale compared to the larger economies within the region. The continuous expansion of airport infrastructure and the growing middle class in APAC will further stimulate demand for air travel, ultimately driving significant growth within the aircraft tire market for the forecast period.
APAC Aircraft Tires Industry Company Market Share
APAC Aircraft Tires Industry: A Comprehensive Market Report (2019-2033)
This in-depth report provides a comprehensive analysis of the Asia-Pacific (APAC) aircraft tires industry, offering valuable insights for industry professionals, investors, and strategic decision-makers. The report covers the period from 2019 to 2033, with a focus on the forecast period from 2025 to 2033. The base year for this analysis is 2025. Market values are presented in million units.
APAC Aircraft Tires Industry Market Dynamics & Structure
The APAC aircraft tires market is characterized by moderate concentration, with several key players dominating the landscape. Technological innovation, driven by the need for enhanced performance and fuel efficiency, is a significant driver. Stringent regulatory frameworks governing safety and environmental impact influence product development and market access. The industry witnesses competitive pressures from substitute materials and increasing competition. End-user demographics, particularly the growth of commercial aviation in the region, significantly impact market demand. Consolidation through mergers and acquisitions (M&A) is observed, with xx M&A deals recorded between 2019 and 2024, representing a xx% increase compared to the previous period.
- Market Concentration: Moderately concentrated, with top 5 players holding xx% market share in 2025.
- Technological Innovation: Focus on lighter, stronger, and longer-lasting tires with improved fuel efficiency.
- Regulatory Framework: Stringent safety and environmental regulations impacting material choices and production processes.
- Competitive Substitutes: Limited viable substitutes, but ongoing research into alternative materials presents a long-term threat.
- End-User Demographics: Rapid growth in commercial aviation in APAC is a key market driver.
- M&A Trends: Increasing consolidation through strategic acquisitions to expand market reach and technological capabilities. xx% of M&A deals involved cross-border acquisitions. Innovation barriers include high R&D costs and stringent certification requirements.
APAC Aircraft Tires Industry Growth Trends & Insights
The APAC aircraft tires market experienced significant growth during the historical period (2019-2024), expanding from xx million units to xx million units. This growth is primarily attributed to the burgeoning aviation sector and increasing air travel demand across the region. The market is projected to maintain a robust Compound Annual Growth Rate (CAGR) of xx% during the forecast period (2025-2033), reaching xx million units by 2033. Technological advancements such as the adoption of advanced materials and manufacturing processes have contributed to improved tire performance and longevity, further driving market expansion. The adoption rate of radial tires is increasing at a faster rate than bias tires, reflecting a shift towards improved performance and fuel efficiency. Consumer behavior shifts towards prioritizing safety and sustainability are also influencing market trends. Market penetration of radial tires is projected to reach xx% by 2033.
Dominant Regions, Countries, or Segments in APAC Aircraft Tires Industry
China and India are the dominant markets within the APAC region, fueled by rapid growth in their domestic aviation sectors. Commercial aviation accounts for the largest segment, driven by rising air passenger numbers and expansion of airline fleets. Within the tire types, radial tires represent the larger and faster-growing segment due to their superior performance characteristics.
- Key Drivers (China): Government investments in infrastructure development, rapid expansion of airports, and a growing middle class driving air travel demand.
- Key Drivers (India): Strong economic growth, rising disposable incomes, and increased focus on air connectivity.
- Commercial Aviation Dominance: Largest segment, representing xx% of the total market in 2025, driven by robust air passenger traffic.
- Radial Tire Growth: Superior performance and fuel efficiency driving increased adoption; projected to capture xx% of the market by 2033.
APAC Aircraft Tires Industry Product Landscape
The APAC aircraft tire market showcases a range of products catering to diverse aircraft types and operational requirements. Key product innovations include the development of lighter and stronger tires utilizing advanced materials like high-strength steel and specialized rubber compounds. These innovations aim to improve fuel efficiency, extend tire lifespan, and enhance overall aircraft performance. Moreover, advanced tire monitoring systems and improved retreading technologies are gaining traction, enhancing safety and cost-effectiveness. Unique selling propositions often revolve around superior durability, enhanced safety features, and reduced maintenance costs.
Key Drivers, Barriers & Challenges in APAC Aircraft Tires Industry
Key Drivers:
- Increased air travel demand and fleet expansion in APAC.
- Technological advancements leading to improved tire performance and fuel efficiency.
- Government investments in airport infrastructure.
Key Challenges:
- Fluctuations in raw material prices impacting production costs. (Estimated impact on pricing: xx%)
- Stringent safety and environmental regulations increasing compliance costs. (Estimated compliance cost: xx million units annually)
- Intense competition from established global players and emerging domestic manufacturers.
Emerging Opportunities in APAP Aircraft Tires Industry
- Growth in low-cost carrier operations expanding the market for budget-friendly tire options.
- Increasing demand for sustainable and eco-friendly tires made from recycled materials.
- Opportunities in providing specialized tires for UAVs and other emerging aircraft technologies.
Growth Accelerators in the APAC Aircraft Tires Industry Industry
Technological breakthroughs in material science and manufacturing processes are key catalysts, alongside strategic partnerships between tire manufacturers and aircraft OEMs fostering innovation and market penetration. Expansion into underserved markets, particularly in Southeast Asia, presents further growth potential.
Key Players Shaping the APAC Aircraft Tires Industry Market
Notable Milestones in APAC Aircraft Tires Industry Sector
- 2021 Q3: Bridgestone Corporation launched a new line of aircraft tires with improved fuel efficiency.
- 2022 Q1: Michelin Group and a major APAC airline announced a strategic partnership for tire supply and maintenance.
- 2023 Q2: A significant merger between two regional tire manufacturers consolidated market share.
In-Depth APAC Aircraft Tires Industry Market Outlook
The APAC aircraft tires market is poised for continued expansion, driven by strong growth in air travel, technological advancements, and strategic investments in infrastructure. The market presents significant opportunities for both established players and new entrants, particularly those focused on innovation, sustainability, and cost-effectiveness. Strategic partnerships and investments in research and development will be crucial for companies to maintain competitiveness and capture market share. The long-term outlook remains positive, with the market expected to witness substantial growth throughout the forecast period.
APAC Aircraft Tires Industry Segmentation
-
1. Type
- 1.1. Radial
- 1.2. Bias
-
2. End-user
- 2.1. Commercial Aviation
- 2.2. Military Aviation
- 2.3. General Aviation
-
3. Geography
- 3.1. China
- 3.2. India
- 3.3. Japan
- 3.4. South Korea
- 3.5. Australia
- 3.6. Rest of Asia-Pacific
APAC Aircraft Tires Industry Segmentation By Geography
- 1. China
- 2. India
- 3. Japan
- 4. South Korea
- 5. Australia
- 6. Rest of Asia Pacific
APAC Aircraft Tires Industry Regional Market Share
Geographic Coverage of APAC Aircraft Tires Industry
APAC Aircraft Tires Industry REPORT HIGHLIGHTS
| Aspects | Details |
|---|---|
| Study Period | 2020-2034 |
| Base Year | 2025 |
| Estimated Year | 2026 |
| Forecast Period | 2026-2034 |
| Historical Period | 2020-2025 |
| Growth Rate | CAGR of 6.35% from 2020-2034 |
| Segmentation |
|
Table of Contents
- 1. Introduction
- 1.1. Research Scope
- 1.2. Market Segmentation
- 1.3. Research Objective
- 1.4. Definitions and Assumptions
- 2. Executive Summary
- 2.1. Market Snapshot
- 3. Market Dynamics
- 3.1. Market Drivers
- 3.2. Market Restrains
- 3.3. Market Trends
- 3.4. Market Opportunities
- 4. Market Factor Analysis
- 4.1. Porters Five Forces
- 4.1.1. Bargaining Power of Suppliers
- 4.1.2. Bargaining Power of Buyers
- 4.1.3. Threat of New Entrants
- 4.1.4. Threat of Substitutes
- 4.1.5. Competitive Rivalry
- 4.2. PESTEL analysis
- 4.3. BCG Analysis
- 4.3.1. Stars (High Growth, High Market Share)
- 4.3.2. Cash Cows (Low Growth, High Market Share)
- 4.3.3. Question Mark (High Growth, Low Market Share)
- 4.3.4. Dogs (Low Growth, Low Market Share)
- 4.4. Ansoff Matrix Analysis
- 4.5. Supply Chain Analysis
- 4.6. Regulatory Landscape
- 4.7. Current Market Potential and Opportunity Assessment (TAM–SAM–SOM Framework)
- 4.8. VDR Analyst Note
- 4.1. Porters Five Forces
- 5. Market Analysis, Insights and Forecast 2021-2033
- 5.1. Market Analysis, Insights and Forecast - by Type
- 5.1.1. Radial
- 5.1.2. Bias
- 5.2. Market Analysis, Insights and Forecast - by End-user
- 5.2.1. Commercial Aviation
- 5.2.2. Military Aviation
- 5.2.3. General Aviation
- 5.3. Market Analysis, Insights and Forecast - by Geography
- 5.3.1. China
- 5.3.2. India
- 5.3.3. Japan
- 5.3.4. South Korea
- 5.3.5. Australia
- 5.3.6. Rest of Asia-Pacific
- 5.4. Market Analysis, Insights and Forecast - by Region
- 5.4.1. China
- 5.4.2. India
- 5.4.3. Japan
- 5.4.4. South Korea
- 5.4.5. Australia
- 5.4.6. Rest of Asia Pacific
- 5.1. Market Analysis, Insights and Forecast - by Type
- 6. Global APAC Aircraft Tires Industry Analysis, Insights and Forecast, 2021-2033
- 6.1. Market Analysis, Insights and Forecast - by Type
- 6.1.1. Radial
- 6.1.2. Bias
- 6.2. Market Analysis, Insights and Forecast - by End-user
- 6.2.1. Commercial Aviation
- 6.2.2. Military Aviation
- 6.2.3. General Aviation
- 6.3. Market Analysis, Insights and Forecast - by Geography
- 6.3.1. China
- 6.3.2. India
- 6.3.3. Japan
- 6.3.4. South Korea
- 6.3.5. Australia
- 6.3.6. Rest of Asia-Pacific
- 6.1. Market Analysis, Insights and Forecast - by Type
- 7. China APAC Aircraft Tires Industry Analysis, Insights and Forecast, 2021-2033
- 7.1. Market Analysis, Insights and Forecast - by Type
- 7.1.1. Radial
- 7.1.2. Bias
- 7.2. Market Analysis, Insights and Forecast - by End-user
- 7.2.1. Commercial Aviation
- 7.2.2. Military Aviation
- 7.2.3. General Aviation
- 7.3. Market Analysis, Insights and Forecast - by Geography
- 7.3.1. China
- 7.3.2. India
- 7.3.3. Japan
- 7.3.4. South Korea
- 7.3.5. Australia
- 7.3.6. Rest of Asia-Pacific
- 7.1. Market Analysis, Insights and Forecast - by Type
- 8. India APAC Aircraft Tires Industry Analysis, Insights and Forecast, 2021-2033
- 8.1. Market Analysis, Insights and Forecast - by Type
- 8.1.1. Radial
- 8.1.2. Bias
- 8.2. Market Analysis, Insights and Forecast - by End-user
- 8.2.1. Commercial Aviation
- 8.2.2. Military Aviation
- 8.2.3. General Aviation
- 8.3. Market Analysis, Insights and Forecast - by Geography
- 8.3.1. China
- 8.3.2. India
- 8.3.3. Japan
- 8.3.4. South Korea
- 8.3.5. Australia
- 8.3.6. Rest of Asia-Pacific
- 8.1. Market Analysis, Insights and Forecast - by Type
- 9. Japan APAC Aircraft Tires Industry Analysis, Insights and Forecast, 2021-2033
- 9.1. Market Analysis, Insights and Forecast - by Type
- 9.1.1. Radial
- 9.1.2. Bias
- 9.2. Market Analysis, Insights and Forecast - by End-user
- 9.2.1. Commercial Aviation
- 9.2.2. Military Aviation
- 9.2.3. General Aviation
- 9.3. Market Analysis, Insights and Forecast - by Geography
- 9.3.1. China
- 9.3.2. India
- 9.3.3. Japan
- 9.3.4. South Korea
- 9.3.5. Australia
- 9.3.6. Rest of Asia-Pacific
- 9.1. Market Analysis, Insights and Forecast - by Type
- 10. South Korea APAC Aircraft Tires Industry Analysis, Insights and Forecast, 2021-2033
- 10.1. Market Analysis, Insights and Forecast - by Type
- 10.1.1. Radial
- 10.1.2. Bias
- 10.2. Market Analysis, Insights and Forecast - by End-user
- 10.2.1. Commercial Aviation
- 10.2.2. Military Aviation
- 10.2.3. General Aviation
- 10.3. Market Analysis, Insights and Forecast - by Geography
- 10.3.1. China
- 10.3.2. India
- 10.3.3. Japan
- 10.3.4. South Korea
- 10.3.5. Australia
- 10.3.6. Rest of Asia-Pacific
- 10.1. Market Analysis, Insights and Forecast - by Type
- 11. Australia APAC Aircraft Tires Industry Analysis, Insights and Forecast, 2021-2033
- 11.1. Market Analysis, Insights and Forecast - by Type
- 11.1.1. Radial
- 11.1.2. Bias
- 11.2. Market Analysis, Insights and Forecast - by End-user
- 11.2.1. Commercial Aviation
- 11.2.2. Military Aviation
- 11.2.3. General Aviation
- 11.3. Market Analysis, Insights and Forecast - by Geography
- 11.3.1. China
- 11.3.2. India
- 11.3.3. Japan
- 11.3.4. South Korea
- 11.3.5. Australia
- 11.3.6. Rest of Asia-Pacific
- 11.1. Market Analysis, Insights and Forecast - by Type
- 12. Rest of Asia Pacific APAC Aircraft Tires Industry Analysis, Insights and Forecast, 2021-2033
- 12.1. Market Analysis, Insights and Forecast - by Type
- 12.1.1. Radial
- 12.1.2. Bias
- 12.2. Market Analysis, Insights and Forecast - by End-user
- 12.2.1. Commercial Aviation
- 12.2.2. Military Aviation
- 12.2.3. General Aviation
- 12.3. Market Analysis, Insights and Forecast - by Geography
- 12.3.1. China
- 12.3.2. India
- 12.3.3. Japan
- 12.3.4. South Korea
- 12.3.5. Australia
- 12.3.6. Rest of Asia-Pacific
- 12.1. Market Analysis, Insights and Forecast - by Type
- 13. Competitive Analysis
- 13.1. Company Profiles
- 13.1.1 Wilkerson Company Inc
- 13.1.1.1. Company Overview
- 13.1.1.2. Products
- 13.1.1.3. Company Financials
- 13.1.1.4. SWOT Analysis
- 13.1.2 Michelin Group
- 13.1.2.1. Company Overview
- 13.1.2.2. Products
- 13.1.2.3. Company Financials
- 13.1.2.4. SWOT Analysis
- 13.1.3 Hankook Tire Co Ltd
- 13.1.3.1. Company Overview
- 13.1.3.2. Products
- 13.1.3.3. Company Financials
- 13.1.3.4. SWOT Analysis
- 13.1.4 China National Tire & Rubber Co Ltd
- 13.1.4.1. Company Overview
- 13.1.4.2. Products
- 13.1.4.3. Company Financials
- 13.1.4.4. SWOT Analysis
- 13.1.5 Dunlop Aircraft Tyres Limited
- 13.1.5.1. Company Overview
- 13.1.5.2. Products
- 13.1.5.3. Company Financials
- 13.1.5.4. SWOT Analysis
- 13.1.6 Qingdao Sentury Tire Co Ltd
- 13.1.6.1. Company Overview
- 13.1.6.2. Products
- 13.1.6.3. Company Financials
- 13.1.6.4. SWOT Analysis
- 13.1.7 MRF Limited
- 13.1.7.1. Company Overview
- 13.1.7.2. Products
- 13.1.7.3. Company Financials
- 13.1.7.4. SWOT Analysis
- 13.1.8 Goodyear Tire & Rubber Company
- 13.1.8.1. Company Overview
- 13.1.8.2. Products
- 13.1.8.3. Company Financials
- 13.1.8.4. SWOT Analysis
- 13.1.9 Bridgestone Corporation
- 13.1.9.1. Company Overview
- 13.1.9.2. Products
- 13.1.9.3. Company Financials
- 13.1.9.4. SWOT Analysis
- 13.1.1 Wilkerson Company Inc
- 13.2. Market Entropy
- 13.2.1 Company's Key Areas Served
- 13.2.2 Recent Developments
- 13.3. Company Market Share Analysis 2025
- 13.3.1 Top 5 Companies Market Share Analysis
- 13.3.2 Top 3 Companies Market Share Analysis
- 13.4. List of Potential Customers
- 14. Research Methodology
List of Figures
- Figure 1: Global APAC Aircraft Tires Industry Revenue Breakdown (Million, %) by Region 2025 & 2033
- Figure 2: China APAC Aircraft Tires Industry Revenue (Million), by Type 2025 & 2033
- Figure 3: China APAC Aircraft Tires Industry Revenue Share (%), by Type 2025 & 2033
- Figure 4: China APAC Aircraft Tires Industry Revenue (Million), by End-user 2025 & 2033
- Figure 5: China APAC Aircraft Tires Industry Revenue Share (%), by End-user 2025 & 2033
- Figure 6: China APAC Aircraft Tires Industry Revenue (Million), by Geography 2025 & 2033
- Figure 7: China APAC Aircraft Tires Industry Revenue Share (%), by Geography 2025 & 2033
- Figure 8: China APAC Aircraft Tires Industry Revenue (Million), by Country 2025 & 2033
- Figure 9: China APAC Aircraft Tires Industry Revenue Share (%), by Country 2025 & 2033
- Figure 10: India APAC Aircraft Tires Industry Revenue (Million), by Type 2025 & 2033
- Figure 11: India APAC Aircraft Tires Industry Revenue Share (%), by Type 2025 & 2033
- Figure 12: India APAC Aircraft Tires Industry Revenue (Million), by End-user 2025 & 2033
- Figure 13: India APAC Aircraft Tires Industry Revenue Share (%), by End-user 2025 & 2033
- Figure 14: India APAC Aircraft Tires Industry Revenue (Million), by Geography 2025 & 2033
- Figure 15: India APAC Aircraft Tires Industry Revenue Share (%), by Geography 2025 & 2033
- Figure 16: India APAC Aircraft Tires Industry Revenue (Million), by Country 2025 & 2033
- Figure 17: India APAC Aircraft Tires Industry Revenue Share (%), by Country 2025 & 2033
- Figure 18: Japan APAC Aircraft Tires Industry Revenue (Million), by Type 2025 & 2033
- Figure 19: Japan APAC Aircraft Tires Industry Revenue Share (%), by Type 2025 & 2033
- Figure 20: Japan APAC Aircraft Tires Industry Revenue (Million), by End-user 2025 & 2033
- Figure 21: Japan APAC Aircraft Tires Industry Revenue Share (%), by End-user 2025 & 2033
- Figure 22: Japan APAC Aircraft Tires Industry Revenue (Million), by Geography 2025 & 2033
- Figure 23: Japan APAC Aircraft Tires Industry Revenue Share (%), by Geography 2025 & 2033
- Figure 24: Japan APAC Aircraft Tires Industry Revenue (Million), by Country 2025 & 2033
- Figure 25: Japan APAC Aircraft Tires Industry Revenue Share (%), by Country 2025 & 2033
- Figure 26: South Korea APAC Aircraft Tires Industry Revenue (Million), by Type 2025 & 2033
- Figure 27: South Korea APAC Aircraft Tires Industry Revenue Share (%), by Type 2025 & 2033
- Figure 28: South Korea APAC Aircraft Tires Industry Revenue (Million), by End-user 2025 & 2033
- Figure 29: South Korea APAC Aircraft Tires Industry Revenue Share (%), by End-user 2025 & 2033
- Figure 30: South Korea APAC Aircraft Tires Industry Revenue (Million), by Geography 2025 & 2033
- Figure 31: South Korea APAC Aircraft Tires Industry Revenue Share (%), by Geography 2025 & 2033
- Figure 32: South Korea APAC Aircraft Tires Industry Revenue (Million), by Country 2025 & 2033
- Figure 33: South Korea APAC Aircraft Tires Industry Revenue Share (%), by Country 2025 & 2033
- Figure 34: Australia APAC Aircraft Tires Industry Revenue (Million), by Type 2025 & 2033
- Figure 35: Australia APAC Aircraft Tires Industry Revenue Share (%), by Type 2025 & 2033
- Figure 36: Australia APAC Aircraft Tires Industry Revenue (Million), by End-user 2025 & 2033
- Figure 37: Australia APAC Aircraft Tires Industry Revenue Share (%), by End-user 2025 & 2033
- Figure 38: Australia APAC Aircraft Tires Industry Revenue (Million), by Geography 2025 & 2033
- Figure 39: Australia APAC Aircraft Tires Industry Revenue Share (%), by Geography 2025 & 2033
- Figure 40: Australia APAC Aircraft Tires Industry Revenue (Million), by Country 2025 & 2033
- Figure 41: Australia APAC Aircraft Tires Industry Revenue Share (%), by Country 2025 & 2033
- Figure 42: Rest of Asia Pacific APAC Aircraft Tires Industry Revenue (Million), by Type 2025 & 2033
- Figure 43: Rest of Asia Pacific APAC Aircraft Tires Industry Revenue Share (%), by Type 2025 & 2033
- Figure 44: Rest of Asia Pacific APAC Aircraft Tires Industry Revenue (Million), by End-user 2025 & 2033
- Figure 45: Rest of Asia Pacific APAC Aircraft Tires Industry Revenue Share (%), by End-user 2025 & 2033
- Figure 46: Rest of Asia Pacific APAC Aircraft Tires Industry Revenue (Million), by Geography 2025 & 2033
- Figure 47: Rest of Asia Pacific APAC Aircraft Tires Industry Revenue Share (%), by Geography 2025 & 2033
- Figure 48: Rest of Asia Pacific APAC Aircraft Tires Industry Revenue (Million), by Country 2025 & 2033
- Figure 49: Rest of Asia Pacific APAC Aircraft Tires Industry Revenue Share (%), by Country 2025 & 2033
List of Tables
- Table 1: Global APAC Aircraft Tires Industry Revenue Million Forecast, by Type 2020 & 2033
- Table 2: Global APAC Aircraft Tires Industry Revenue Million Forecast, by End-user 2020 & 2033
- Table 3: Global APAC Aircraft Tires Industry Revenue Million Forecast, by Geography 2020 & 2033
- Table 4: Global APAC Aircraft Tires Industry Revenue Million Forecast, by Region 2020 & 2033
- Table 5: Global APAC Aircraft Tires Industry Revenue Million Forecast, by Type 2020 & 2033
- Table 6: Global APAC Aircraft Tires Industry Revenue Million Forecast, by End-user 2020 & 2033
- Table 7: Global APAC Aircraft Tires Industry Revenue Million Forecast, by Geography 2020 & 2033
- Table 8: Global APAC Aircraft Tires Industry Revenue Million Forecast, by Country 2020 & 2033
- Table 9: Global APAC Aircraft Tires Industry Revenue Million Forecast, by Type 2020 & 2033
- Table 10: Global APAC Aircraft Tires Industry Revenue Million Forecast, by End-user 2020 & 2033
- Table 11: Global APAC Aircraft Tires Industry Revenue Million Forecast, by Geography 2020 & 2033
- Table 12: Global APAC Aircraft Tires Industry Revenue Million Forecast, by Country 2020 & 2033
- Table 13: Global APAC Aircraft Tires Industry Revenue Million Forecast, by Type 2020 & 2033
- Table 14: Global APAC Aircraft Tires Industry Revenue Million Forecast, by End-user 2020 & 2033
- Table 15: Global APAC Aircraft Tires Industry Revenue Million Forecast, by Geography 2020 & 2033
- Table 16: Global APAC Aircraft Tires Industry Revenue Million Forecast, by Country 2020 & 2033
- Table 17: Global APAC Aircraft Tires Industry Revenue Million Forecast, by Type 2020 & 2033
- Table 18: Global APAC Aircraft Tires Industry Revenue Million Forecast, by End-user 2020 & 2033
- Table 19: Global APAC Aircraft Tires Industry Revenue Million Forecast, by Geography 2020 & 2033
- Table 20: Global APAC Aircraft Tires Industry Revenue Million Forecast, by Country 2020 & 2033
- Table 21: Global APAC Aircraft Tires Industry Revenue Million Forecast, by Type 2020 & 2033
- Table 22: Global APAC Aircraft Tires Industry Revenue Million Forecast, by End-user 2020 & 2033
- Table 23: Global APAC Aircraft Tires Industry Revenue Million Forecast, by Geography 2020 & 2033
- Table 24: Global APAC Aircraft Tires Industry Revenue Million Forecast, by Country 2020 & 2033
- Table 25: Global APAC Aircraft Tires Industry Revenue Million Forecast, by Type 2020 & 2033
- Table 26: Global APAC Aircraft Tires Industry Revenue Million Forecast, by End-user 2020 & 2033
- Table 27: Global APAC Aircraft Tires Industry Revenue Million Forecast, by Geography 2020 & 2033
- Table 28: Global APAC Aircraft Tires Industry Revenue Million Forecast, by Country 2020 & 2033
Frequently Asked Questions
1. What is the projected Compound Annual Growth Rate (CAGR) of the APAC Aircraft Tires Industry?
The projected CAGR is approximately 6.35%.
2. Which companies are prominent players in the APAC Aircraft Tires Industry?
Key companies in the market include Wilkerson Company Inc, Michelin Group, Hankook Tire Co Ltd, China National Tire & Rubber Co Ltd, Dunlop Aircraft Tyres Limited, Qingdao Sentury Tire Co Ltd, MRF Limited, Goodyear Tire & Rubber Company, Bridgestone Corporation.
3. What are the main segments of the APAC Aircraft Tires Industry?
The market segments include Type, End-user, Geography.
4. Can you provide details about the market size?
The market size is estimated to be USD 588.36 Million as of 2022.
5. What are some drivers contributing to market growth?
N/A
6. What are the notable trends driving market growth?
Commercial Aviation Segment to Exhibit the Highest Growth during the Forecast Period.
7. Are there any restraints impacting market growth?
N/A
8. Can you provide examples of recent developments in the market?
N/A
9. What pricing options are available for accessing the report?
Pricing options include single-user, multi-user, and enterprise licenses priced at USD 4750, USD 5250, and USD 8750 respectively.
10. Is the market size provided in terms of value or volume?
The market size is provided in terms of value, measured in Million.
11. Are there any specific market keywords associated with the report?
Yes, the market keyword associated with the report is "APAC Aircraft Tires Industry," which aids in identifying and referencing the specific market segment covered.
12. How do I determine which pricing option suits my needs best?
The pricing options vary based on user requirements and access needs. Individual users may opt for single-user licenses, while businesses requiring broader access may choose multi-user or enterprise licenses for cost-effective access to the report.
13. Are there any additional resources or data provided in the APAC Aircraft Tires Industry report?
While the report offers comprehensive insights, it's advisable to review the specific contents or supplementary materials provided to ascertain if additional resources or data are available.
14. How can I stay updated on further developments or reports in the APAC Aircraft Tires Industry?
To stay informed about further developments, trends, and reports in the APAC Aircraft Tires Industry, consider subscribing to industry newsletters, following relevant companies and organizations, or regularly checking reputable industry news sources and publications.
Methodology
Step 1 - Identification of Relevant Samples Size from Population Database


Step 2 - Approaches for Defining Global Market Size (Value, Volume* & Price*)

Note*: In applicable scenarios
Step 3 - Data Sources
Primary Research
- Web Analytics
- Survey Reports
- Research Institute
- Latest Research Reports
- Opinion Leaders
Secondary Research
- Annual Reports
- White Paper
- Latest Press Release
- Industry Association
- Paid Database
- Investor Presentations

Step 4 - Data Triangulation
Involves using different sources of information in order to increase the validity of a study
These sources are likely to be stakeholders in a program - participants, other researchers, program staff, other community members, and so on.
Then we put all data in single framework & apply various statistical tools to find out the dynamic on the market.
During the analysis stage, feedback from the stakeholder groups would be compared to determine areas of agreement as well as areas of divergence