
Key Insights
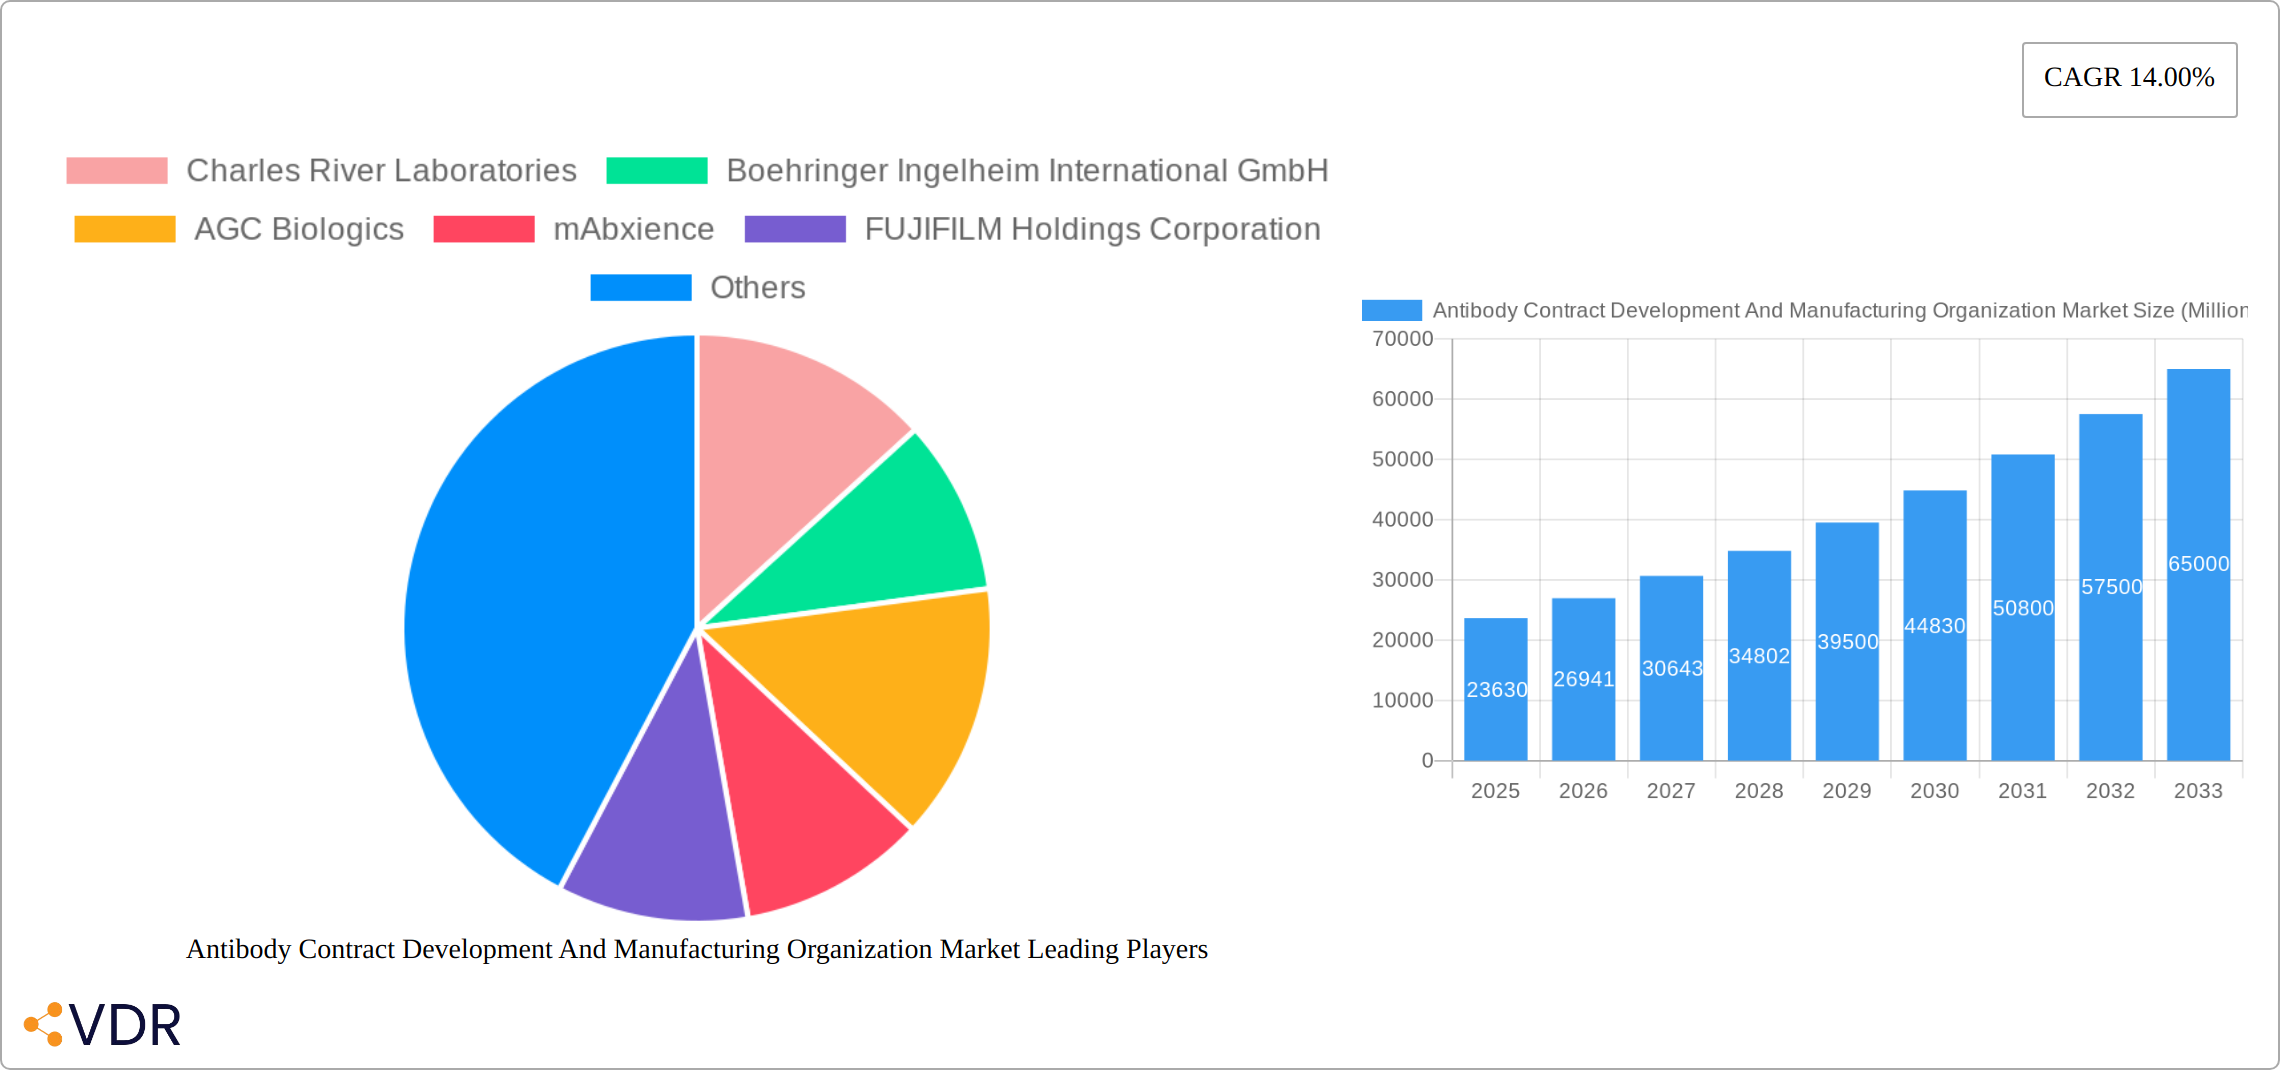
The Antibody Contract Development and Manufacturing Organization (CDMO) market is experiencing robust growth, projected to reach \$23.63 billion in 2025 and exhibiting a Compound Annual Growth Rate (CAGR) of 14% from 2025 to 2033. This expansion is fueled by several key factors. The burgeoning biopharmaceutical industry, particularly in areas like oncology and immunology, necessitates outsourcing of antibody development and manufacturing to specialized CDMOs. This trend is driven by the increasing complexity of antibody-based therapeutics, coupled with the rising demand for faster time-to-market and cost-effective solutions. Furthermore, the significant investments in advanced technologies like single-use bioreactors and process analytical technologies (PAT) by CDMOs are enhancing efficiency and scalability, further propelling market growth. The market is segmented across various end-users (biopharmaceutical companies, research labs, and others), products (monoclonal and polyclonal antibodies, and others), sources (mammalian and microbial), and therapeutic areas (oncology, neurology, cardiology, infectious diseases, immune-mediated disorders, and others). Geographic expansion, particularly in emerging markets like Asia-Pacific, also contributes to the overall market growth.
The competitive landscape is characterized by a mix of large multinational corporations and specialized smaller CDMOs, each catering to different client needs and scales of operation. Key players include Charles River Laboratories, Boehringer Ingelheim, AGC Biologics, mAbxience, FUJIFILM Holdings, AbbVie, WuXi Biologics, Lonza, Catalent, and Samsung Biologics, among others. Despite the significant growth potential, the market faces some challenges, including regulatory hurdles and the need for consistent quality control across diverse manufacturing platforms. However, the strong industry tailwinds, coupled with continuous innovation and strategic partnerships, are expected to overcome these obstacles and maintain the market's high growth trajectory through 2033. The strong demand from biopharmaceutical companies for efficient, high-quality antibody manufacturing services positions this market for continued expansion in the coming years.
Antibody Contract Development and Manufacturing Organization (CDMO) Market: A Comprehensive Report (2019-2033)
This comprehensive report provides an in-depth analysis of the Antibody Contract Development and Manufacturing Organization (CDMO) market, encompassing market dynamics, growth trends, regional segmentation, product landscapes, and key players. The report covers the period from 2019 to 2033, with 2025 serving as the base and estimated year. It meticulously examines the parent market (Biopharmaceutical Contract Manufacturing) and child markets (Antibody CDMO) to offer a holistic understanding of this rapidly evolving sector. The total market value in 2025 is estimated at xx Million, projected to reach xx Million by 2033, exhibiting a CAGR of xx%.
Antibody Contract Development and Manufacturing Organization Market Market Dynamics & Structure
The Antibody CDMO market is characterized by a moderately consolidated structure, with a few large players dominating the landscape alongside numerous smaller, specialized firms. Technological innovation, particularly in areas like cell line development, process intensification, and analytical technologies, is a key driver. Stringent regulatory frameworks, including those set by the FDA and EMA, significantly influence market operations. The market faces competition from internal manufacturing capabilities of large biopharmaceutical companies, yet the increasing complexity of biologics fuels outsourcing. Mergers and acquisitions (M&A) are frequent, with larger players consolidating their market share.
- Market Concentration: The top 5 players hold approximately xx% of the market share in 2025.
- Technological Innovation: Continuous advancement in single-use technologies, automated systems, and continuous manufacturing is driving efficiency and reducing costs.
- Regulatory Framework: Compliance with GMP (Good Manufacturing Practices) and other regulations is paramount, posing both challenges and opportunities.
- Competitive Substitutes: Internal manufacturing and smaller niche CDMOs present competitive pressures.
- M&A Trends: A total of xx M&A deals were recorded in the historical period (2019-2024), with an average deal value of xx Million.
- End-User Demographics: Biopharmaceutical companies dominate the end-user segment, followed by research laboratories and other end users.
Antibody Contract Development and Manufacturing Organization Market Growth Trends & Insights
The Antibody CDMO market has witnessed robust growth, driven by the rising demand for biologics, especially monoclonal antibodies (mAbs), across various therapeutic areas. This growth is fueled by increasing R&D investments in biopharma, a growing number of clinical trials, and the expanding global patient pool for antibody-based therapies. Technological advancements, such as the adoption of continuous manufacturing processes and single-use technologies, have significantly impacted the market by enhancing efficiency, reducing costs, and accelerating time to market. The market has seen a shift toward specialized CDMOs offering tailored services for specific antibody types or therapeutic areas. Consumer behavior shifts are primarily driven by the increased emphasis on speed, quality, and flexibility from biopharmaceutical sponsors.
- Market Size Evolution: The market size increased from xx Million in 2019 to xx Million in 2024.
- Adoption Rates: The adoption of advanced technologies, like continuous manufacturing, is increasing steadily.
- Technological Disruptions: Automation and digitalization are reshaping the CDMO landscape.
- Consumer Behavior Shifts: Biopharmaceutical companies prioritize speed, cost-effectiveness, and high-quality services.

Dominant Regions, Countries, or Segments in Antibody Contract Development and Manufacturing Organization Market
North America currently dominates the Antibody CDMO market, followed by Europe and Asia-Pacific. This dominance is attributed to a strong presence of biopharmaceutical companies, significant R&D investments, and well-established regulatory frameworks. Within the segments, monoclonal antibodies (mAbs) constitute the largest product category, driven by their widespread use in various therapeutic areas. The mammalian cell line source holds the largest share due to its ability to produce high-quality antibodies. Oncology remains the leading therapeutic area, followed by immunology and inflammatory diseases.
- Key Drivers: Strong biopharmaceutical industry, robust R&D investments, and favorable regulatory environments in North America and Europe. Rapidly expanding biopharma sectors in Asia-Pacific contribute to growth.
- Market Share: North America holds approximately xx% of the market share in 2025.
- Growth Potential: Asia-Pacific is expected to witness the highest growth rate during the forecast period.
Antibody Contract Development and Manufacturing Organization Market Product Landscape
The Antibody CDMO market offers a diverse range of products and services, including antibody discovery, process development, GMP manufacturing, analytical testing, and formulation development. The market is witnessing significant innovation in areas such as cell line engineering, process optimization, and the development of novel antibody formats, like antibody-drug conjugates (ADCs) and bispecific antibodies. These advancements enhance efficacy, reduce manufacturing costs, and enable the development of more targeted and effective therapies. The unique selling propositions (USPs) focus on speed, flexibility, and quality, catering to the varied needs of biopharmaceutical clients.
Key Drivers, Barriers & Challenges in Antibody Contract Development and Manufacturing Organization Market
Key Drivers: The increasing demand for biologics, particularly mAbs, across various therapeutic areas is a major driver. Technological advancements, such as the adoption of single-use technologies and continuous manufacturing, improve efficiency and reduce costs. The growing number of clinical trials and the expansion of global patient populations further fuel market growth.
Key Challenges & Restraints: Stringent regulatory requirements, intense competition among CDMOs, and the complex nature of antibody manufacturing processes pose significant challenges. Supply chain disruptions, especially in the procurement of raw materials and reagents, can impact manufacturing timelines and costs. High upfront investment costs for establishing large-scale antibody manufacturing facilities also create entry barriers.
Emerging Opportunities in Antibody Contract Development and Manufacturing Organization Market
Emerging opportunities lie in the development of advanced antibody formats like ADCs and bispecific antibodies, as well as the growing demand for cell and gene therapies that often rely on CDMOs. The increasing adoption of personalized medicine and the focus on developing targeted therapies create significant potential for specialized CDMOs offering niche services. Untapped markets in emerging economies, such as those in Latin America and Africa, offer attractive growth prospects.
Growth Accelerators in the Antibody Contract Development and Manufacturing Organization Market Industry
Technological breakthroughs in automation, process analytics, and cell line engineering are pivotal. Strategic partnerships between CDMOs and biopharmaceutical companies facilitate smoother operations and reduce development timelines. Market expansion through geographic diversification and investment in emerging markets contributes significantly to growth.
Key Players Shaping the Antibody Contract Development and Manufacturing Organization Market Market
- Charles River Laboratories
- Boehringer Ingelheim International GmbH
- AGC Biologics
- mAbxience
- FUJIFILM Holdings Corporation
- AbbVie Inc
- WuXi Biologics
- Lonza
- Catalent Inc
- Samsung Biologics
Notable Milestones in Antibody Contract Development and Manufacturing Organization Market Sector
- February 2024: Samsung Biologics and LegoChem Biosciences partnered to develop antibody-drug conjugates (ADCs) for solid tumors. This collaboration expands Samsung Biologics' presence in the ADC market and strengthens LegoChem Biosciences' manufacturing capabilities.
- October 2023: Salipro Biotech AB and Icosagen partnered to advance drug discovery programs targeting challenging membrane proteins. This agreement underscores the growing importance of CDMOs in facilitating drug development against complex targets.
In-Depth Antibody Contract Development and Manufacturing Organization Market Market Outlook
The Antibody CDMO market is poised for continued expansion, driven by sustained demand for biologics, technological advancements, and strategic partnerships. The focus on efficiency, speed, and quality will continue to shape the market landscape. Companies strategically investing in advanced technologies and expanding their service offerings to meet evolving client needs are expected to gain a competitive advantage. The market's future potential is promising, with significant opportunities across diverse therapeutic areas and geographical regions.
Antibody Contract Development And Manufacturing Organization Market Segmentation
-
1. Product
- 1.1. Monoclonal Antibodies
- 1.2. Polyclonal Antibodies
- 1.3. Other Products
-
2. Source
- 2.1. Mammalian
- 2.2. Microbial
-
3. Therapeutic Area
- 3.1. Oncology
- 3.2. Neurology
- 3.3. Cardiology
- 3.4. Infectious Diseases
- 3.5. Immune-mediated Disorders
- 3.6. Other Therapeutic Areas
-
4. End User
- 4.1. Biopharmaceutical Companies
- 4.2. Research Laboratories
- 4.3. Other End Users
Antibody Contract Development And Manufacturing Organization Market Segmentation By Geography
-
1. North America
- 1.1. United States
- 1.2. Canada
- 1.3. Mexico
-
2. Europe
- 2.1. United Kingdom
- 2.2. Germany
- 2.3. France
- 2.4. Spain
- 2.5. Italy
- 2.6. Rest of Europe
-
3. Asia Pacific
- 3.1. India
- 3.2. Japan
- 3.3. China
- 3.4. Australia
- 3.5. South Korea
- 3.6. Rest of Asia Pacific
-
4. Middle East and Africa
- 4.1. GCC
- 4.2. South Africa
- 4.3. Rest of the Middle East and Africa
-
5. South America
- 5.1. Brazil
- 5.2. Argentina
- 5.3. Rest of South America

Antibody Contract Development And Manufacturing Organization Market REPORT HIGHLIGHTS
| Aspects | Details |
|---|---|
| Study Period | 2019-2033 |
| Base Year | 2024 |
| Estimated Year | 2025 |
| Forecast Period | 2025-2033 |
| Historical Period | 2019-2024 |
| Growth Rate | CAGR of 14.00% from 2019-2033 |
| Segmentation |
|
Table of Contents
- 1. Introduction
- 1.1. Research Scope
- 1.2. Market Segmentation
- 1.3. Research Methodology
- 1.4. Definitions and Assumptions
- 2. Executive Summary
- 2.1. Introduction
- 3. Market Dynamics
- 3.1. Introduction
- 3.2. Market Drivers
- 3.2.1. Increasing Rate of Clinical Research and High Investment in Antibody Research; Rising Incidence of Cancer Cases; High Cost of Manufacturing Antibodies and Challenges Associated with Manufacturing
- 3.3. Market Restrains
- 3.3.1. Quality Issues While Outsourcing; Limited Outsourcing Opted by Big Biopharma Companies
- 3.4. Market Trends
- 3.4.1. Monoclonal Antibodies Segment is Expected to Hold Significant Market Share Over the Forecast Period
- 4. Market Factor Analysis
- 4.1. Porters Five Forces
- 4.2. Supply/Value Chain
- 4.3. PESTEL analysis
- 4.4. Market Entropy
- 4.5. Patent/Trademark Analysis
- 5. Global Antibody Contract Development And Manufacturing Organization Market Analysis, Insights and Forecast, 2019-2031
- 5.1. Market Analysis, Insights and Forecast - by Product
- 5.1.1. Monoclonal Antibodies
- 5.1.2. Polyclonal Antibodies
- 5.1.3. Other Products
- 5.2. Market Analysis, Insights and Forecast - by Source
- 5.2.1. Mammalian
- 5.2.2. Microbial
- 5.3. Market Analysis, Insights and Forecast - by Therapeutic Area
- 5.3.1. Oncology
- 5.3.2. Neurology
- 5.3.3. Cardiology
- 5.3.4. Infectious Diseases
- 5.3.5. Immune-mediated Disorders
- 5.3.6. Other Therapeutic Areas
- 5.4. Market Analysis, Insights and Forecast - by End User
- 5.4.1. Biopharmaceutical Companies
- 5.4.2. Research Laboratories
- 5.4.3. Other End Users
- 5.5. Market Analysis, Insights and Forecast - by Region
- 5.5.1. North America
- 5.5.2. Europe
- 5.5.3. Asia Pacific
- 5.5.4. Middle East and Africa
- 5.5.5. South America
- 5.1. Market Analysis, Insights and Forecast - by Product
- 6. North America Antibody Contract Development And Manufacturing Organization Market Analysis, Insights and Forecast, 2019-2031
- 6.1. Market Analysis, Insights and Forecast - by Product
- 6.1.1. Monoclonal Antibodies
- 6.1.2. Polyclonal Antibodies
- 6.1.3. Other Products
- 6.2. Market Analysis, Insights and Forecast - by Source
- 6.2.1. Mammalian
- 6.2.2. Microbial
- 6.3. Market Analysis, Insights and Forecast - by Therapeutic Area
- 6.3.1. Oncology
- 6.3.2. Neurology
- 6.3.3. Cardiology
- 6.3.4. Infectious Diseases
- 6.3.5. Immune-mediated Disorders
- 6.3.6. Other Therapeutic Areas
- 6.4. Market Analysis, Insights and Forecast - by End User
- 6.4.1. Biopharmaceutical Companies
- 6.4.2. Research Laboratories
- 6.4.3. Other End Users
- 6.1. Market Analysis, Insights and Forecast - by Product
- 7. Europe Antibody Contract Development And Manufacturing Organization Market Analysis, Insights and Forecast, 2019-2031
- 7.1. Market Analysis, Insights and Forecast - by Product
- 7.1.1. Monoclonal Antibodies
- 7.1.2. Polyclonal Antibodies
- 7.1.3. Other Products
- 7.2. Market Analysis, Insights and Forecast - by Source
- 7.2.1. Mammalian
- 7.2.2. Microbial
- 7.3. Market Analysis, Insights and Forecast - by Therapeutic Area
- 7.3.1. Oncology
- 7.3.2. Neurology
- 7.3.3. Cardiology
- 7.3.4. Infectious Diseases
- 7.3.5. Immune-mediated Disorders
- 7.3.6. Other Therapeutic Areas
- 7.4. Market Analysis, Insights and Forecast - by End User
- 7.4.1. Biopharmaceutical Companies
- 7.4.2. Research Laboratories
- 7.4.3. Other End Users
- 7.1. Market Analysis, Insights and Forecast - by Product
- 8. Asia Pacific Antibody Contract Development And Manufacturing Organization Market Analysis, Insights and Forecast, 2019-2031
- 8.1. Market Analysis, Insights and Forecast - by Product
- 8.1.1. Monoclonal Antibodies
- 8.1.2. Polyclonal Antibodies
- 8.1.3. Other Products
- 8.2. Market Analysis, Insights and Forecast - by Source
- 8.2.1. Mammalian
- 8.2.2. Microbial
- 8.3. Market Analysis, Insights and Forecast - by Therapeutic Area
- 8.3.1. Oncology
- 8.3.2. Neurology
- 8.3.3. Cardiology
- 8.3.4. Infectious Diseases
- 8.3.5. Immune-mediated Disorders
- 8.3.6. Other Therapeutic Areas
- 8.4. Market Analysis, Insights and Forecast - by End User
- 8.4.1. Biopharmaceutical Companies
- 8.4.2. Research Laboratories
- 8.4.3. Other End Users
- 8.1. Market Analysis, Insights and Forecast - by Product
- 9. Middle East and Africa Antibody Contract Development And Manufacturing Organization Market Analysis, Insights and Forecast, 2019-2031
- 9.1. Market Analysis, Insights and Forecast - by Product
- 9.1.1. Monoclonal Antibodies
- 9.1.2. Polyclonal Antibodies
- 9.1.3. Other Products
- 9.2. Market Analysis, Insights and Forecast - by Source
- 9.2.1. Mammalian
- 9.2.2. Microbial
- 9.3. Market Analysis, Insights and Forecast - by Therapeutic Area
- 9.3.1. Oncology
- 9.3.2. Neurology
- 9.3.3. Cardiology
- 9.3.4. Infectious Diseases
- 9.3.5. Immune-mediated Disorders
- 9.3.6. Other Therapeutic Areas
- 9.4. Market Analysis, Insights and Forecast - by End User
- 9.4.1. Biopharmaceutical Companies
- 9.4.2. Research Laboratories
- 9.4.3. Other End Users
- 9.1. Market Analysis, Insights and Forecast - by Product
- 10. South America Antibody Contract Development And Manufacturing Organization Market Analysis, Insights and Forecast, 2019-2031
- 10.1. Market Analysis, Insights and Forecast - by Product
- 10.1.1. Monoclonal Antibodies
- 10.1.2. Polyclonal Antibodies
- 10.1.3. Other Products
- 10.2. Market Analysis, Insights and Forecast - by Source
- 10.2.1. Mammalian
- 10.2.2. Microbial
- 10.3. Market Analysis, Insights and Forecast - by Therapeutic Area
- 10.3.1. Oncology
- 10.3.2. Neurology
- 10.3.3. Cardiology
- 10.3.4. Infectious Diseases
- 10.3.5. Immune-mediated Disorders
- 10.3.6. Other Therapeutic Areas
- 10.4. Market Analysis, Insights and Forecast - by End User
- 10.4.1. Biopharmaceutical Companies
- 10.4.2. Research Laboratories
- 10.4.3. Other End Users
- 10.1. Market Analysis, Insights and Forecast - by Product
- 11. North America Antibody Contract Development And Manufacturing Organization Market Analysis, Insights and Forecast, 2019-2031
- 11.1. Market Analysis, Insights and Forecast - By Country/Sub-region
- 11.1.1. undefined
- 12. Europe Antibody Contract Development And Manufacturing Organization Market Analysis, Insights and Forecast, 2019-2031
- 12.1. Market Analysis, Insights and Forecast - By Country/Sub-region
- 12.1.1. undefined
- 13. Asia Pacific Antibody Contract Development And Manufacturing Organization Market Analysis, Insights and Forecast, 2019-2031
- 13.1. Market Analysis, Insights and Forecast - By Country/Sub-region
- 13.1.1. undefined
- 14. Middle East and Africa Antibody Contract Development And Manufacturing Organization Market Analysis, Insights and Forecast, 2019-2031
- 14.1. Market Analysis, Insights and Forecast - By Country/Sub-region
- 14.1.1. undefined
- 15. South America Antibody Contract Development And Manufacturing Organization Market Analysis, Insights and Forecast, 2019-2031
- 15.1. Market Analysis, Insights and Forecast - By Country/Sub-region
- 15.1.1. undefined
- 16. Competitive Analysis
- 16.1. Global Market Share Analysis 2024
- 16.2. Company Profiles
- 16.2.1 Charles River Laboratories
- 16.2.1.1. Overview
- 16.2.1.2. Products
- 16.2.1.3. SWOT Analysis
- 16.2.1.4. Recent Developments
- 16.2.1.5. Financials (Based on Availability)
- 16.2.2 Boehringer Ingelheim International GmbH
- 16.2.2.1. Overview
- 16.2.2.2. Products
- 16.2.2.3. SWOT Analysis
- 16.2.2.4. Recent Developments
- 16.2.2.5. Financials (Based on Availability)
- 16.2.3 AGC Biologics
- 16.2.3.1. Overview
- 16.2.3.2. Products
- 16.2.3.3. SWOT Analysis
- 16.2.3.4. Recent Developments
- 16.2.3.5. Financials (Based on Availability)
- 16.2.4 mAbxience
- 16.2.4.1. Overview
- 16.2.4.2. Products
- 16.2.4.3. SWOT Analysis
- 16.2.4.4. Recent Developments
- 16.2.4.5. Financials (Based on Availability)
- 16.2.5 FUJIFILM Holdings Corporation
- 16.2.5.1. Overview
- 16.2.5.2. Products
- 16.2.5.3. SWOT Analysis
- 16.2.5.4. Recent Developments
- 16.2.5.5. Financials (Based on Availability)
- 16.2.6 AbbVie Inc
- 16.2.6.1. Overview
- 16.2.6.2. Products
- 16.2.6.3. SWOT Analysis
- 16.2.6.4. Recent Developments
- 16.2.6.5. Financials (Based on Availability)
- 16.2.7 WuXi Biologics
- 16.2.7.1. Overview
- 16.2.7.2. Products
- 16.2.7.3. SWOT Analysis
- 16.2.7.4. Recent Developments
- 16.2.7.5. Financials (Based on Availability)
- 16.2.8 Lonza
- 16.2.8.1. Overview
- 16.2.8.2. Products
- 16.2.8.3. SWOT Analysis
- 16.2.8.4. Recent Developments
- 16.2.8.5. Financials (Based on Availability)
- 16.2.9 Catalent Inc
- 16.2.9.1. Overview
- 16.2.9.2. Products
- 16.2.9.3. SWOT Analysis
- 16.2.9.4. Recent Developments
- 16.2.9.5. Financials (Based on Availability)
- 16.2.10 Samsung Biologics
- 16.2.10.1. Overview
- 16.2.10.2. Products
- 16.2.10.3. SWOT Analysis
- 16.2.10.4. Recent Developments
- 16.2.10.5. Financials (Based on Availability)
- 16.2.1 Charles River Laboratories
List of Figures
- Figure 1: Global Antibody Contract Development And Manufacturing Organization Market Revenue Breakdown (Million, %) by Region 2024 & 2032
- Figure 2: Global Antibody Contract Development And Manufacturing Organization Market Volume Breakdown (K Unit, %) by Region 2024 & 2032
- Figure 3: North America Antibody Contract Development And Manufacturing Organization Market Revenue (Million), by Country 2024 & 2032
- Figure 4: North America Antibody Contract Development And Manufacturing Organization Market Volume (K Unit), by Country 2024 & 2032
- Figure 5: North America Antibody Contract Development And Manufacturing Organization Market Revenue Share (%), by Country 2024 & 2032
- Figure 6: North America Antibody Contract Development And Manufacturing Organization Market Volume Share (%), by Country 2024 & 2032
- Figure 7: Europe Antibody Contract Development And Manufacturing Organization Market Revenue (Million), by Country 2024 & 2032
- Figure 8: Europe Antibody Contract Development And Manufacturing Organization Market Volume (K Unit), by Country 2024 & 2032
- Figure 9: Europe Antibody Contract Development And Manufacturing Organization Market Revenue Share (%), by Country 2024 & 2032
- Figure 10: Europe Antibody Contract Development And Manufacturing Organization Market Volume Share (%), by Country 2024 & 2032
- Figure 11: Asia Pacific Antibody Contract Development And Manufacturing Organization Market Revenue (Million), by Country 2024 & 2032
- Figure 12: Asia Pacific Antibody Contract Development And Manufacturing Organization Market Volume (K Unit), by Country 2024 & 2032
- Figure 13: Asia Pacific Antibody Contract Development And Manufacturing Organization Market Revenue Share (%), by Country 2024 & 2032
- Figure 14: Asia Pacific Antibody Contract Development And Manufacturing Organization Market Volume Share (%), by Country 2024 & 2032
- Figure 15: Middle East and Africa Antibody Contract Development And Manufacturing Organization Market Revenue (Million), by Country 2024 & 2032
- Figure 16: Middle East and Africa Antibody Contract Development And Manufacturing Organization Market Volume (K Unit), by Country 2024 & 2032
- Figure 17: Middle East and Africa Antibody Contract Development And Manufacturing Organization Market Revenue Share (%), by Country 2024 & 2032
- Figure 18: Middle East and Africa Antibody Contract Development And Manufacturing Organization Market Volume Share (%), by Country 2024 & 2032
- Figure 19: South America Antibody Contract Development And Manufacturing Organization Market Revenue (Million), by Country 2024 & 2032
- Figure 20: South America Antibody Contract Development And Manufacturing Organization Market Volume (K Unit), by Country 2024 & 2032
- Figure 21: South America Antibody Contract Development And Manufacturing Organization Market Revenue Share (%), by Country 2024 & 2032
- Figure 22: South America Antibody Contract Development And Manufacturing Organization Market Volume Share (%), by Country 2024 & 2032
- Figure 23: North America Antibody Contract Development And Manufacturing Organization Market Revenue (Million), by Product 2024 & 2032
- Figure 24: North America Antibody Contract Development And Manufacturing Organization Market Volume (K Unit), by Product 2024 & 2032
- Figure 25: North America Antibody Contract Development And Manufacturing Organization Market Revenue Share (%), by Product 2024 & 2032
- Figure 26: North America Antibody Contract Development And Manufacturing Organization Market Volume Share (%), by Product 2024 & 2032
- Figure 27: North America Antibody Contract Development And Manufacturing Organization Market Revenue (Million), by Source 2024 & 2032
- Figure 28: North America Antibody Contract Development And Manufacturing Organization Market Volume (K Unit), by Source 2024 & 2032
- Figure 29: North America Antibody Contract Development And Manufacturing Organization Market Revenue Share (%), by Source 2024 & 2032
- Figure 30: North America Antibody Contract Development And Manufacturing Organization Market Volume Share (%), by Source 2024 & 2032
- Figure 31: North America Antibody Contract Development And Manufacturing Organization Market Revenue (Million), by Therapeutic Area 2024 & 2032
- Figure 32: North America Antibody Contract Development And Manufacturing Organization Market Volume (K Unit), by Therapeutic Area 2024 & 2032
- Figure 33: North America Antibody Contract Development And Manufacturing Organization Market Revenue Share (%), by Therapeutic Area 2024 & 2032
- Figure 34: North America Antibody Contract Development And Manufacturing Organization Market Volume Share (%), by Therapeutic Area 2024 & 2032
- Figure 35: North America Antibody Contract Development And Manufacturing Organization Market Revenue (Million), by End User 2024 & 2032
- Figure 36: North America Antibody Contract Development And Manufacturing Organization Market Volume (K Unit), by End User 2024 & 2032
- Figure 37: North America Antibody Contract Development And Manufacturing Organization Market Revenue Share (%), by End User 2024 & 2032
- Figure 38: North America Antibody Contract Development And Manufacturing Organization Market Volume Share (%), by End User 2024 & 2032
- Figure 39: North America Antibody Contract Development And Manufacturing Organization Market Revenue (Million), by Country 2024 & 2032
- Figure 40: North America Antibody Contract Development And Manufacturing Organization Market Volume (K Unit), by Country 2024 & 2032
- Figure 41: North America Antibody Contract Development And Manufacturing Organization Market Revenue Share (%), by Country 2024 & 2032
- Figure 42: North America Antibody Contract Development And Manufacturing Organization Market Volume Share (%), by Country 2024 & 2032
- Figure 43: Europe Antibody Contract Development And Manufacturing Organization Market Revenue (Million), by Product 2024 & 2032
- Figure 44: Europe Antibody Contract Development And Manufacturing Organization Market Volume (K Unit), by Product 2024 & 2032
- Figure 45: Europe Antibody Contract Development And Manufacturing Organization Market Revenue Share (%), by Product 2024 & 2032
- Figure 46: Europe Antibody Contract Development And Manufacturing Organization Market Volume Share (%), by Product 2024 & 2032
- Figure 47: Europe Antibody Contract Development And Manufacturing Organization Market Revenue (Million), by Source 2024 & 2032
- Figure 48: Europe Antibody Contract Development And Manufacturing Organization Market Volume (K Unit), by Source 2024 & 2032
- Figure 49: Europe Antibody Contract Development And Manufacturing Organization Market Revenue Share (%), by Source 2024 & 2032
- Figure 50: Europe Antibody Contract Development And Manufacturing Organization Market Volume Share (%), by Source 2024 & 2032
- Figure 51: Europe Antibody Contract Development And Manufacturing Organization Market Revenue (Million), by Therapeutic Area 2024 & 2032
- Figure 52: Europe Antibody Contract Development And Manufacturing Organization Market Volume (K Unit), by Therapeutic Area 2024 & 2032
- Figure 53: Europe Antibody Contract Development And Manufacturing Organization Market Revenue Share (%), by Therapeutic Area 2024 & 2032
- Figure 54: Europe Antibody Contract Development And Manufacturing Organization Market Volume Share (%), by Therapeutic Area 2024 & 2032
- Figure 55: Europe Antibody Contract Development And Manufacturing Organization Market Revenue (Million), by End User 2024 & 2032
- Figure 56: Europe Antibody Contract Development And Manufacturing Organization Market Volume (K Unit), by End User 2024 & 2032
- Figure 57: Europe Antibody Contract Development And Manufacturing Organization Market Revenue Share (%), by End User 2024 & 2032
- Figure 58: Europe Antibody Contract Development And Manufacturing Organization Market Volume Share (%), by End User 2024 & 2032
- Figure 59: Europe Antibody Contract Development And Manufacturing Organization Market Revenue (Million), by Country 2024 & 2032
- Figure 60: Europe Antibody Contract Development And Manufacturing Organization Market Volume (K Unit), by Country 2024 & 2032
- Figure 61: Europe Antibody Contract Development And Manufacturing Organization Market Revenue Share (%), by Country 2024 & 2032
- Figure 62: Europe Antibody Contract Development And Manufacturing Organization Market Volume Share (%), by Country 2024 & 2032
- Figure 63: Asia Pacific Antibody Contract Development And Manufacturing Organization Market Revenue (Million), by Product 2024 & 2032
- Figure 64: Asia Pacific Antibody Contract Development And Manufacturing Organization Market Volume (K Unit), by Product 2024 & 2032
- Figure 65: Asia Pacific Antibody Contract Development And Manufacturing Organization Market Revenue Share (%), by Product 2024 & 2032
- Figure 66: Asia Pacific Antibody Contract Development And Manufacturing Organization Market Volume Share (%), by Product 2024 & 2032
- Figure 67: Asia Pacific Antibody Contract Development And Manufacturing Organization Market Revenue (Million), by Source 2024 & 2032
- Figure 68: Asia Pacific Antibody Contract Development And Manufacturing Organization Market Volume (K Unit), by Source 2024 & 2032
- Figure 69: Asia Pacific Antibody Contract Development And Manufacturing Organization Market Revenue Share (%), by Source 2024 & 2032
- Figure 70: Asia Pacific Antibody Contract Development And Manufacturing Organization Market Volume Share (%), by Source 2024 & 2032
- Figure 71: Asia Pacific Antibody Contract Development And Manufacturing Organization Market Revenue (Million), by Therapeutic Area 2024 & 2032
- Figure 72: Asia Pacific Antibody Contract Development And Manufacturing Organization Market Volume (K Unit), by Therapeutic Area 2024 & 2032
- Figure 73: Asia Pacific Antibody Contract Development And Manufacturing Organization Market Revenue Share (%), by Therapeutic Area 2024 & 2032
- Figure 74: Asia Pacific Antibody Contract Development And Manufacturing Organization Market Volume Share (%), by Therapeutic Area 2024 & 2032
- Figure 75: Asia Pacific Antibody Contract Development And Manufacturing Organization Market Revenue (Million), by End User 2024 & 2032
- Figure 76: Asia Pacific Antibody Contract Development And Manufacturing Organization Market Volume (K Unit), by End User 2024 & 2032
- Figure 77: Asia Pacific Antibody Contract Development And Manufacturing Organization Market Revenue Share (%), by End User 2024 & 2032
- Figure 78: Asia Pacific Antibody Contract Development And Manufacturing Organization Market Volume Share (%), by End User 2024 & 2032
- Figure 79: Asia Pacific Antibody Contract Development And Manufacturing Organization Market Revenue (Million), by Country 2024 & 2032
- Figure 80: Asia Pacific Antibody Contract Development And Manufacturing Organization Market Volume (K Unit), by Country 2024 & 2032
- Figure 81: Asia Pacific Antibody Contract Development And Manufacturing Organization Market Revenue Share (%), by Country 2024 & 2032
- Figure 82: Asia Pacific Antibody Contract Development And Manufacturing Organization Market Volume Share (%), by Country 2024 & 2032
- Figure 83: Middle East and Africa Antibody Contract Development And Manufacturing Organization Market Revenue (Million), by Product 2024 & 2032
- Figure 84: Middle East and Africa Antibody Contract Development And Manufacturing Organization Market Volume (K Unit), by Product 2024 & 2032
- Figure 85: Middle East and Africa Antibody Contract Development And Manufacturing Organization Market Revenue Share (%), by Product 2024 & 2032
- Figure 86: Middle East and Africa Antibody Contract Development And Manufacturing Organization Market Volume Share (%), by Product 2024 & 2032
- Figure 87: Middle East and Africa Antibody Contract Development And Manufacturing Organization Market Revenue (Million), by Source 2024 & 2032
- Figure 88: Middle East and Africa Antibody Contract Development And Manufacturing Organization Market Volume (K Unit), by Source 2024 & 2032
- Figure 89: Middle East and Africa Antibody Contract Development And Manufacturing Organization Market Revenue Share (%), by Source 2024 & 2032
- Figure 90: Middle East and Africa Antibody Contract Development And Manufacturing Organization Market Volume Share (%), by Source 2024 & 2032
- Figure 91: Middle East and Africa Antibody Contract Development And Manufacturing Organization Market Revenue (Million), by Therapeutic Area 2024 & 2032
- Figure 92: Middle East and Africa Antibody Contract Development And Manufacturing Organization Market Volume (K Unit), by Therapeutic Area 2024 & 2032
- Figure 93: Middle East and Africa Antibody Contract Development And Manufacturing Organization Market Revenue Share (%), by Therapeutic Area 2024 & 2032
- Figure 94: Middle East and Africa Antibody Contract Development And Manufacturing Organization Market Volume Share (%), by Therapeutic Area 2024 & 2032
- Figure 95: Middle East and Africa Antibody Contract Development And Manufacturing Organization Market Revenue (Million), by End User 2024 & 2032
- Figure 96: Middle East and Africa Antibody Contract Development And Manufacturing Organization Market Volume (K Unit), by End User 2024 & 2032
- Figure 97: Middle East and Africa Antibody Contract Development And Manufacturing Organization Market Revenue Share (%), by End User 2024 & 2032
- Figure 98: Middle East and Africa Antibody Contract Development And Manufacturing Organization Market Volume Share (%), by End User 2024 & 2032
- Figure 99: Middle East and Africa Antibody Contract Development And Manufacturing Organization Market Revenue (Million), by Country 2024 & 2032
- Figure 100: Middle East and Africa Antibody Contract Development And Manufacturing Organization Market Volume (K Unit), by Country 2024 & 2032
- Figure 101: Middle East and Africa Antibody Contract Development And Manufacturing Organization Market Revenue Share (%), by Country 2024 & 2032
- Figure 102: Middle East and Africa Antibody Contract Development And Manufacturing Organization Market Volume Share (%), by Country 2024 & 2032
- Figure 103: South America Antibody Contract Development And Manufacturing Organization Market Revenue (Million), by Product 2024 & 2032
- Figure 104: South America Antibody Contract Development And Manufacturing Organization Market Volume (K Unit), by Product 2024 & 2032
- Figure 105: South America Antibody Contract Development And Manufacturing Organization Market Revenue Share (%), by Product 2024 & 2032
- Figure 106: South America Antibody Contract Development And Manufacturing Organization Market Volume Share (%), by Product 2024 & 2032
- Figure 107: South America Antibody Contract Development And Manufacturing Organization Market Revenue (Million), by Source 2024 & 2032
- Figure 108: South America Antibody Contract Development And Manufacturing Organization Market Volume (K Unit), by Source 2024 & 2032
- Figure 109: South America Antibody Contract Development And Manufacturing Organization Market Revenue Share (%), by Source 2024 & 2032
- Figure 110: South America Antibody Contract Development And Manufacturing Organization Market Volume Share (%), by Source 2024 & 2032
- Figure 111: South America Antibody Contract Development And Manufacturing Organization Market Revenue (Million), by Therapeutic Area 2024 & 2032
- Figure 112: South America Antibody Contract Development And Manufacturing Organization Market Volume (K Unit), by Therapeutic Area 2024 & 2032
- Figure 113: South America Antibody Contract Development And Manufacturing Organization Market Revenue Share (%), by Therapeutic Area 2024 & 2032
- Figure 114: South America Antibody Contract Development And Manufacturing Organization Market Volume Share (%), by Therapeutic Area 2024 & 2032
- Figure 115: South America Antibody Contract Development And Manufacturing Organization Market Revenue (Million), by End User 2024 & 2032
- Figure 116: South America Antibody Contract Development And Manufacturing Organization Market Volume (K Unit), by End User 2024 & 2032
- Figure 117: South America Antibody Contract Development And Manufacturing Organization Market Revenue Share (%), by End User 2024 & 2032
- Figure 118: South America Antibody Contract Development And Manufacturing Organization Market Volume Share (%), by End User 2024 & 2032
- Figure 119: South America Antibody Contract Development And Manufacturing Organization Market Revenue (Million), by Country 2024 & 2032
- Figure 120: South America Antibody Contract Development And Manufacturing Organization Market Volume (K Unit), by Country 2024 & 2032
- Figure 121: South America Antibody Contract Development And Manufacturing Organization Market Revenue Share (%), by Country 2024 & 2032
- Figure 122: South America Antibody Contract Development And Manufacturing Organization Market Volume Share (%), by Country 2024 & 2032
List of Tables
- Table 1: Global Antibody Contract Development And Manufacturing Organization Market Revenue Million Forecast, by Region 2019 & 2032
- Table 2: Global Antibody Contract Development And Manufacturing Organization Market Volume K Unit Forecast, by Region 2019 & 2032
- Table 3: Global Antibody Contract Development And Manufacturing Organization Market Revenue Million Forecast, by Product 2019 & 2032
- Table 4: Global Antibody Contract Development And Manufacturing Organization Market Volume K Unit Forecast, by Product 2019 & 2032
- Table 5: Global Antibody Contract Development And Manufacturing Organization Market Revenue Million Forecast, by Source 2019 & 2032
- Table 6: Global Antibody Contract Development And Manufacturing Organization Market Volume K Unit Forecast, by Source 2019 & 2032
- Table 7: Global Antibody Contract Development And Manufacturing Organization Market Revenue Million Forecast, by Therapeutic Area 2019 & 2032
- Table 8: Global Antibody Contract Development And Manufacturing Organization Market Volume K Unit Forecast, by Therapeutic Area 2019 & 2032
- Table 9: Global Antibody Contract Development And Manufacturing Organization Market Revenue Million Forecast, by End User 2019 & 2032
- Table 10: Global Antibody Contract Development And Manufacturing Organization Market Volume K Unit Forecast, by End User 2019 & 2032
- Table 11: Global Antibody Contract Development And Manufacturing Organization Market Revenue Million Forecast, by Region 2019 & 2032
- Table 12: Global Antibody Contract Development And Manufacturing Organization Market Volume K Unit Forecast, by Region 2019 & 2032
- Table 13: Global Antibody Contract Development And Manufacturing Organization Market Revenue Million Forecast, by Country 2019 & 2032
- Table 14: Global Antibody Contract Development And Manufacturing Organization Market Volume K Unit Forecast, by Country 2019 & 2032
- Table 15: Global Antibody Contract Development And Manufacturing Organization Market Revenue Million Forecast, by Country 2019 & 2032
- Table 16: Global Antibody Contract Development And Manufacturing Organization Market Volume K Unit Forecast, by Country 2019 & 2032
- Table 17: Global Antibody Contract Development And Manufacturing Organization Market Revenue Million Forecast, by Country 2019 & 2032
- Table 18: Global Antibody Contract Development And Manufacturing Organization Market Volume K Unit Forecast, by Country 2019 & 2032
- Table 19: Global Antibody Contract Development And Manufacturing Organization Market Revenue Million Forecast, by Country 2019 & 2032
- Table 20: Global Antibody Contract Development And Manufacturing Organization Market Volume K Unit Forecast, by Country 2019 & 2032
- Table 21: Global Antibody Contract Development And Manufacturing Organization Market Revenue Million Forecast, by Country 2019 & 2032
- Table 22: Global Antibody Contract Development And Manufacturing Organization Market Volume K Unit Forecast, by Country 2019 & 2032
- Table 23: Global Antibody Contract Development And Manufacturing Organization Market Revenue Million Forecast, by Product 2019 & 2032
- Table 24: Global Antibody Contract Development And Manufacturing Organization Market Volume K Unit Forecast, by Product 2019 & 2032
- Table 25: Global Antibody Contract Development And Manufacturing Organization Market Revenue Million Forecast, by Source 2019 & 2032
- Table 26: Global Antibody Contract Development And Manufacturing Organization Market Volume K Unit Forecast, by Source 2019 & 2032
- Table 27: Global Antibody Contract Development And Manufacturing Organization Market Revenue Million Forecast, by Therapeutic Area 2019 & 2032
- Table 28: Global Antibody Contract Development And Manufacturing Organization Market Volume K Unit Forecast, by Therapeutic Area 2019 & 2032
- Table 29: Global Antibody Contract Development And Manufacturing Organization Market Revenue Million Forecast, by End User 2019 & 2032
- Table 30: Global Antibody Contract Development And Manufacturing Organization Market Volume K Unit Forecast, by End User 2019 & 2032
- Table 31: Global Antibody Contract Development And Manufacturing Organization Market Revenue Million Forecast, by Country 2019 & 2032
- Table 32: Global Antibody Contract Development And Manufacturing Organization Market Volume K Unit Forecast, by Country 2019 & 2032
- Table 33: United States Antibody Contract Development And Manufacturing Organization Market Revenue (Million) Forecast, by Application 2019 & 2032
- Table 34: United States Antibody Contract Development And Manufacturing Organization Market Volume (K Unit) Forecast, by Application 2019 & 2032
- Table 35: Canada Antibody Contract Development And Manufacturing Organization Market Revenue (Million) Forecast, by Application 2019 & 2032
- Table 36: Canada Antibody Contract Development And Manufacturing Organization Market Volume (K Unit) Forecast, by Application 2019 & 2032
- Table 37: Mexico Antibody Contract Development And Manufacturing Organization Market Revenue (Million) Forecast, by Application 2019 & 2032
- Table 38: Mexico Antibody Contract Development And Manufacturing Organization Market Volume (K Unit) Forecast, by Application 2019 & 2032
- Table 39: Global Antibody Contract Development And Manufacturing Organization Market Revenue Million Forecast, by Product 2019 & 2032
- Table 40: Global Antibody Contract Development And Manufacturing Organization Market Volume K Unit Forecast, by Product 2019 & 2032
- Table 41: Global Antibody Contract Development And Manufacturing Organization Market Revenue Million Forecast, by Source 2019 & 2032
- Table 42: Global Antibody Contract Development And Manufacturing Organization Market Volume K Unit Forecast, by Source 2019 & 2032
- Table 43: Global Antibody Contract Development And Manufacturing Organization Market Revenue Million Forecast, by Therapeutic Area 2019 & 2032
- Table 44: Global Antibody Contract Development And Manufacturing Organization Market Volume K Unit Forecast, by Therapeutic Area 2019 & 2032
- Table 45: Global Antibody Contract Development And Manufacturing Organization Market Revenue Million Forecast, by End User 2019 & 2032
- Table 46: Global Antibody Contract Development And Manufacturing Organization Market Volume K Unit Forecast, by End User 2019 & 2032
- Table 47: Global Antibody Contract Development And Manufacturing Organization Market Revenue Million Forecast, by Country 2019 & 2032
- Table 48: Global Antibody Contract Development And Manufacturing Organization Market Volume K Unit Forecast, by Country 2019 & 2032
- Table 49: United Kingdom Antibody Contract Development And Manufacturing Organization Market Revenue (Million) Forecast, by Application 2019 & 2032
- Table 50: United Kingdom Antibody Contract Development And Manufacturing Organization Market Volume (K Unit) Forecast, by Application 2019 & 2032
- Table 51: Germany Antibody Contract Development And Manufacturing Organization Market Revenue (Million) Forecast, by Application 2019 & 2032
- Table 52: Germany Antibody Contract Development And Manufacturing Organization Market Volume (K Unit) Forecast, by Application 2019 & 2032
- Table 53: France Antibody Contract Development And Manufacturing Organization Market Revenue (Million) Forecast, by Application 2019 & 2032
- Table 54: France Antibody Contract Development And Manufacturing Organization Market Volume (K Unit) Forecast, by Application 2019 & 2032
- Table 55: Spain Antibody Contract Development And Manufacturing Organization Market Revenue (Million) Forecast, by Application 2019 & 2032
- Table 56: Spain Antibody Contract Development And Manufacturing Organization Market Volume (K Unit) Forecast, by Application 2019 & 2032
- Table 57: Italy Antibody Contract Development And Manufacturing Organization Market Revenue (Million) Forecast, by Application 2019 & 2032
- Table 58: Italy Antibody Contract Development And Manufacturing Organization Market Volume (K Unit) Forecast, by Application 2019 & 2032
- Table 59: Rest of Europe Antibody Contract Development And Manufacturing Organization Market Revenue (Million) Forecast, by Application 2019 & 2032
- Table 60: Rest of Europe Antibody Contract Development And Manufacturing Organization Market Volume (K Unit) Forecast, by Application 2019 & 2032
- Table 61: Global Antibody Contract Development And Manufacturing Organization Market Revenue Million Forecast, by Product 2019 & 2032
- Table 62: Global Antibody Contract Development And Manufacturing Organization Market Volume K Unit Forecast, by Product 2019 & 2032
- Table 63: Global Antibody Contract Development And Manufacturing Organization Market Revenue Million Forecast, by Source 2019 & 2032
- Table 64: Global Antibody Contract Development And Manufacturing Organization Market Volume K Unit Forecast, by Source 2019 & 2032
- Table 65: Global Antibody Contract Development And Manufacturing Organization Market Revenue Million Forecast, by Therapeutic Area 2019 & 2032
- Table 66: Global Antibody Contract Development And Manufacturing Organization Market Volume K Unit Forecast, by Therapeutic Area 2019 & 2032
- Table 67: Global Antibody Contract Development And Manufacturing Organization Market Revenue Million Forecast, by End User 2019 & 2032
- Table 68: Global Antibody Contract Development And Manufacturing Organization Market Volume K Unit Forecast, by End User 2019 & 2032
- Table 69: Global Antibody Contract Development And Manufacturing Organization Market Revenue Million Forecast, by Country 2019 & 2032
- Table 70: Global Antibody Contract Development And Manufacturing Organization Market Volume K Unit Forecast, by Country 2019 & 2032
- Table 71: India Antibody Contract Development And Manufacturing Organization Market Revenue (Million) Forecast, by Application 2019 & 2032
- Table 72: India Antibody Contract Development And Manufacturing Organization Market Volume (K Unit) Forecast, by Application 2019 & 2032
- Table 73: Japan Antibody Contract Development And Manufacturing Organization Market Revenue (Million) Forecast, by Application 2019 & 2032
- Table 74: Japan Antibody Contract Development And Manufacturing Organization Market Volume (K Unit) Forecast, by Application 2019 & 2032
- Table 75: China Antibody Contract Development And Manufacturing Organization Market Revenue (Million) Forecast, by Application 2019 & 2032
- Table 76: China Antibody Contract Development And Manufacturing Organization Market Volume (K Unit) Forecast, by Application 2019 & 2032
- Table 77: Australia Antibody Contract Development And Manufacturing Organization Market Revenue (Million) Forecast, by Application 2019 & 2032
- Table 78: Australia Antibody Contract Development And Manufacturing Organization Market Volume (K Unit) Forecast, by Application 2019 & 2032
- Table 79: South Korea Antibody Contract Development And Manufacturing Organization Market Revenue (Million) Forecast, by Application 2019 & 2032
- Table 80: South Korea Antibody Contract Development And Manufacturing Organization Market Volume (K Unit) Forecast, by Application 2019 & 2032
- Table 81: Rest of Asia Pacific Antibody Contract Development And Manufacturing Organization Market Revenue (Million) Forecast, by Application 2019 & 2032
- Table 82: Rest of Asia Pacific Antibody Contract Development And Manufacturing Organization Market Volume (K Unit) Forecast, by Application 2019 & 2032
- Table 83: Global Antibody Contract Development And Manufacturing Organization Market Revenue Million Forecast, by Product 2019 & 2032
- Table 84: Global Antibody Contract Development And Manufacturing Organization Market Volume K Unit Forecast, by Product 2019 & 2032
- Table 85: Global Antibody Contract Development And Manufacturing Organization Market Revenue Million Forecast, by Source 2019 & 2032
- Table 86: Global Antibody Contract Development And Manufacturing Organization Market Volume K Unit Forecast, by Source 2019 & 2032
- Table 87: Global Antibody Contract Development And Manufacturing Organization Market Revenue Million Forecast, by Therapeutic Area 2019 & 2032
- Table 88: Global Antibody Contract Development And Manufacturing Organization Market Volume K Unit Forecast, by Therapeutic Area 2019 & 2032
- Table 89: Global Antibody Contract Development And Manufacturing Organization Market Revenue Million Forecast, by End User 2019 & 2032
- Table 90: Global Antibody Contract Development And Manufacturing Organization Market Volume K Unit Forecast, by End User 2019 & 2032
- Table 91: Global Antibody Contract Development And Manufacturing Organization Market Revenue Million Forecast, by Country 2019 & 2032
- Table 92: Global Antibody Contract Development And Manufacturing Organization Market Volume K Unit Forecast, by Country 2019 & 2032
- Table 93: GCC Antibody Contract Development And Manufacturing Organization Market Revenue (Million) Forecast, by Application 2019 & 2032
- Table 94: GCC Antibody Contract Development And Manufacturing Organization Market Volume (K Unit) Forecast, by Application 2019 & 2032
- Table 95: South Africa Antibody Contract Development And Manufacturing Organization Market Revenue (Million) Forecast, by Application 2019 & 2032
- Table 96: South Africa Antibody Contract Development And Manufacturing Organization Market Volume (K Unit) Forecast, by Application 2019 & 2032
- Table 97: Rest of the Middle East and Africa Antibody Contract Development And Manufacturing Organization Market Revenue (Million) Forecast, by Application 2019 & 2032
- Table 98: Rest of the Middle East and Africa Antibody Contract Development And Manufacturing Organization Market Volume (K Unit) Forecast, by Application 2019 & 2032
- Table 99: Global Antibody Contract Development And Manufacturing Organization Market Revenue Million Forecast, by Product 2019 & 2032
- Table 100: Global Antibody Contract Development And Manufacturing Organization Market Volume K Unit Forecast, by Product 2019 & 2032
- Table 101: Global Antibody Contract Development And Manufacturing Organization Market Revenue Million Forecast, by Source 2019 & 2032
- Table 102: Global Antibody Contract Development And Manufacturing Organization Market Volume K Unit Forecast, by Source 2019 & 2032
- Table 103: Global Antibody Contract Development And Manufacturing Organization Market Revenue Million Forecast, by Therapeutic Area 2019 & 2032
- Table 104: Global Antibody Contract Development And Manufacturing Organization Market Volume K Unit Forecast, by Therapeutic Area 2019 & 2032
- Table 105: Global Antibody Contract Development And Manufacturing Organization Market Revenue Million Forecast, by End User 2019 & 2032
- Table 106: Global Antibody Contract Development And Manufacturing Organization Market Volume K Unit Forecast, by End User 2019 & 2032
- Table 107: Global Antibody Contract Development And Manufacturing Organization Market Revenue Million Forecast, by Country 2019 & 2032
- Table 108: Global Antibody Contract Development And Manufacturing Organization Market Volume K Unit Forecast, by Country 2019 & 2032
- Table 109: Brazil Antibody Contract Development And Manufacturing Organization Market Revenue (Million) Forecast, by Application 2019 & 2032
- Table 110: Brazil Antibody Contract Development And Manufacturing Organization Market Volume (K Unit) Forecast, by Application 2019 & 2032
- Table 111: Argentina Antibody Contract Development And Manufacturing Organization Market Revenue (Million) Forecast, by Application 2019 & 2032
- Table 112: Argentina Antibody Contract Development And Manufacturing Organization Market Volume (K Unit) Forecast, by Application 2019 & 2032
- Table 113: Rest of South America Antibody Contract Development And Manufacturing Organization Market Revenue (Million) Forecast, by Application 2019 & 2032
- Table 114: Rest of South America Antibody Contract Development And Manufacturing Organization Market Volume (K Unit) Forecast, by Application 2019 & 2032
Frequently Asked Questions
1. What is the projected Compound Annual Growth Rate (CAGR) of the Antibody Contract Development And Manufacturing Organization Market?
The projected CAGR is approximately 14.00%.
2. Which companies are prominent players in the Antibody Contract Development And Manufacturing Organization Market?
Key companies in the market include Charles River Laboratories, Boehringer Ingelheim International GmbH, AGC Biologics, mAbxience, FUJIFILM Holdings Corporation, AbbVie Inc, WuXi Biologics, Lonza, Catalent Inc, Samsung Biologics.
3. What are the main segments of the Antibody Contract Development And Manufacturing Organization Market?
The market segments include Product, Source, Therapeutic Area, End User.
4. Can you provide details about the market size?
The market size is estimated to be USD 23.63 Million as of 2022.
5. What are some drivers contributing to market growth?
Increasing Rate of Clinical Research and High Investment in Antibody Research; Rising Incidence of Cancer Cases; High Cost of Manufacturing Antibodies and Challenges Associated with Manufacturing.
6. What are the notable trends driving market growth?
Monoclonal Antibodies Segment is Expected to Hold Significant Market Share Over the Forecast Period.
7. Are there any restraints impacting market growth?
Quality Issues While Outsourcing; Limited Outsourcing Opted by Big Biopharma Companies.
8. Can you provide examples of recent developments in the market?
February 2024: Samsung Biologics joined forces with LegoChem Biosciences, a pioneering biotech firm, to develop innovative antibody-drug conjugate (ADC) programs. As per the agreement, Samsung Biologics will offer its services for antibody development and drug substance manufacturing for LegoChem Biosciences' ADC program targeting the treatment of solid tumors.
9. What pricing options are available for accessing the report?
Pricing options include single-user, multi-user, and enterprise licenses priced at USD 4750, USD 5250, and USD 8750 respectively.
10. Is the market size provided in terms of value or volume?
The market size is provided in terms of value, measured in Million and volume, measured in K Unit.
11. Are there any specific market keywords associated with the report?
Yes, the market keyword associated with the report is "Antibody Contract Development And Manufacturing Organization Market," which aids in identifying and referencing the specific market segment covered.
12. How do I determine which pricing option suits my needs best?
The pricing options vary based on user requirements and access needs. Individual users may opt for single-user licenses, while businesses requiring broader access may choose multi-user or enterprise licenses for cost-effective access to the report.
13. Are there any additional resources or data provided in the Antibody Contract Development And Manufacturing Organization Market report?
While the report offers comprehensive insights, it's advisable to review the specific contents or supplementary materials provided to ascertain if additional resources or data are available.
14. How can I stay updated on further developments or reports in the Antibody Contract Development And Manufacturing Organization Market?
To stay informed about further developments, trends, and reports in the Antibody Contract Development And Manufacturing Organization Market, consider subscribing to industry newsletters, following relevant companies and organizations, or regularly checking reputable industry news sources and publications.
Methodology
Step 1 - Identification of Relevant Samples Size from Population Database


Step 2 - Approaches for Defining Global Market Size (Value, Volume* & Price*)

Note*: In applicable scenarios
Step 3 - Data Sources
Primary Research
- Web Analytics
- Survey Reports
- Research Institute
- Latest Research Reports
- Opinion Leaders
Secondary Research
- Annual Reports
- White Paper
- Latest Press Release
- Industry Association
- Paid Database
- Investor Presentations

Step 4 - Data Triangulation
Involves using different sources of information in order to increase the validity of a study
These sources are likely to be stakeholders in a program - participants, other researchers, program staff, other community members, and so on.
Then we put all data in single framework & apply various statistical tools to find out the dynamic on the market.
During the analysis stage, feedback from the stakeholder groups would be compared to determine areas of agreement as well as areas of divergence


