
Key Insights
The global anti-icers and deicers market is experiencing robust growth, driven by increasing infrastructure development, particularly in regions experiencing harsh winters. The market's expansion is fueled by a rising demand for efficient and environmentally friendly deicing solutions for roads, bridges, airports, and other critical infrastructure. The increasing frequency and intensity of winter storms, coupled with stricter regulations concerning environmental impact, are further propelling market growth. Key segments within the market include liquid deicers (e.g., sodium chloride brine, magnesium chloride brine, potassium acetate), solid deicers (e.g., rock salt, calcium chloride), and pre-wetted salts, each catering to specific application needs and environmental considerations. Technological advancements focusing on improved efficacy, reduced environmental impact, and cost-effectiveness are shaping the market landscape. Competition is intense, with established chemical companies and specialized deicer producers vying for market share. The market is expected to witness significant expansion over the forecast period, driven by continuous infrastructural upgrades and the increasing adoption of advanced deicing technologies.
Growth is expected to be particularly strong in North America and Europe due to existing robust infrastructure and the high prevalence of winter storms. However, emerging markets in Asia and other regions are also showing promising growth potential as infrastructure investments accelerate and awareness regarding the benefits of efficient deicing solutions increases. The market is not without challenges; price volatility of raw materials and concerns regarding environmental impacts (particularly with traditional deicers) pose potential constraints. Nevertheless, ongoing research and development efforts focused on sustainable and eco-friendly deicing solutions are expected to mitigate these challenges and further fuel market growth. Companies are increasingly investing in research to develop more environmentally benign and efficient formulations, creating opportunities for innovation and sustainable market expansion. The market will likely witness consolidation as larger players acquire smaller specialized firms, driving efficiency and accelerating innovation.
Anti-icers and Deicers Market Report: 2019-2033
This comprehensive report provides an in-depth analysis of the global anti-icers and deicers market, encompassing market dynamics, growth trends, regional performance, product landscape, key players, and future outlook. The study period covers 2019-2033, with 2025 as the base and estimated year. The forecast period is 2025-2033, and the historical period is 2019-2024. The market is segmented by type (anti-icers, deicers), application (roads, bridges, airports, railways), and region, providing a granular understanding of this vital industry. The total market value in 2025 is estimated at xx million units.
Anti-icers and Deicers Market Dynamics & Structure
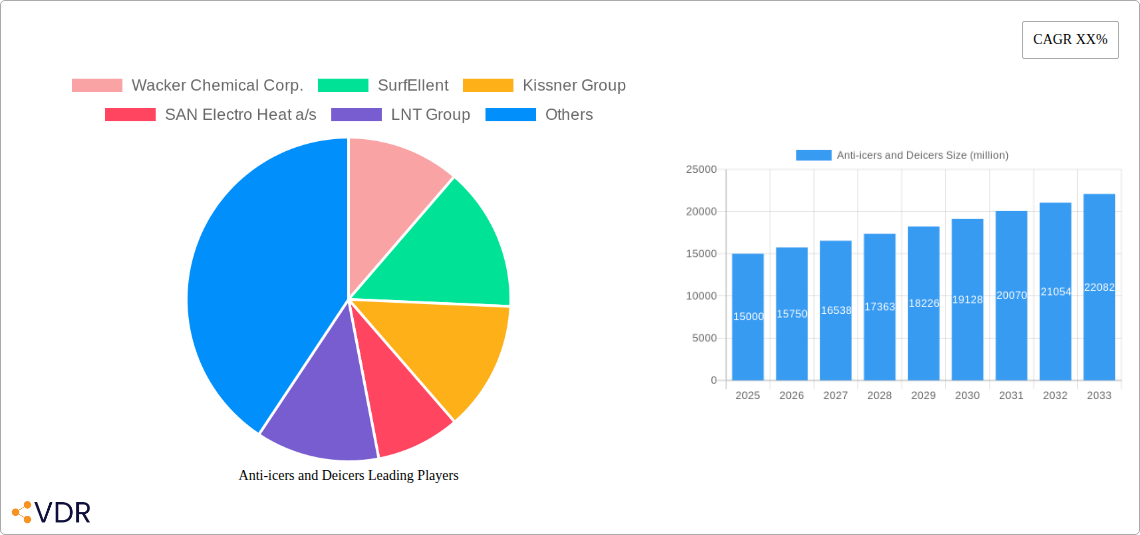
The anti-icers and deicers market is characterized by moderate concentration, with a few large players and numerous smaller regional companies. Technological innovation, primarily focused on environmentally friendly formulations and improved application methods, is a key driver. Stringent environmental regulations are shaping product development, pushing the adoption of less corrosive and biodegradable solutions. Competitive substitutes, such as alternative road treatments and advanced snow-removal technologies, exert pressure on market share. The end-user landscape comprises government agencies, transportation authorities, and private contractors, each with distinct procurement and application practices. M&A activity has been relatively low in recent years (xx deals in the past five years), but consolidation is anticipated as companies seek to expand their geographical reach and product portfolios.
- Market Concentration: Moderately concentrated, with the top 5 players holding approximately xx% market share in 2025.
- Technological Innovation: Focus on environmentally friendly formulations (e.g., liquid brines, acetate-based products), improved application equipment, and smart de-icing systems.
- Regulatory Framework: Increasingly stringent environmental regulations driving adoption of sustainable de-icing solutions.
- Competitive Substitutes: Alternative road surface treatments, improved snow plowing and removal methods, and pre-wetting technologies are emerging as competitors.
- End-User Demographics: Primarily government agencies (xx%), followed by private contractors (xx%) and airports (xx%).
- M&A Trends: Low M&A activity recently, but consolidation is expected to increase over the forecast period, with larger players acquiring smaller specialized companies to expand their product portfolios.
Anti-icers and Deicers Growth Trends & Insights
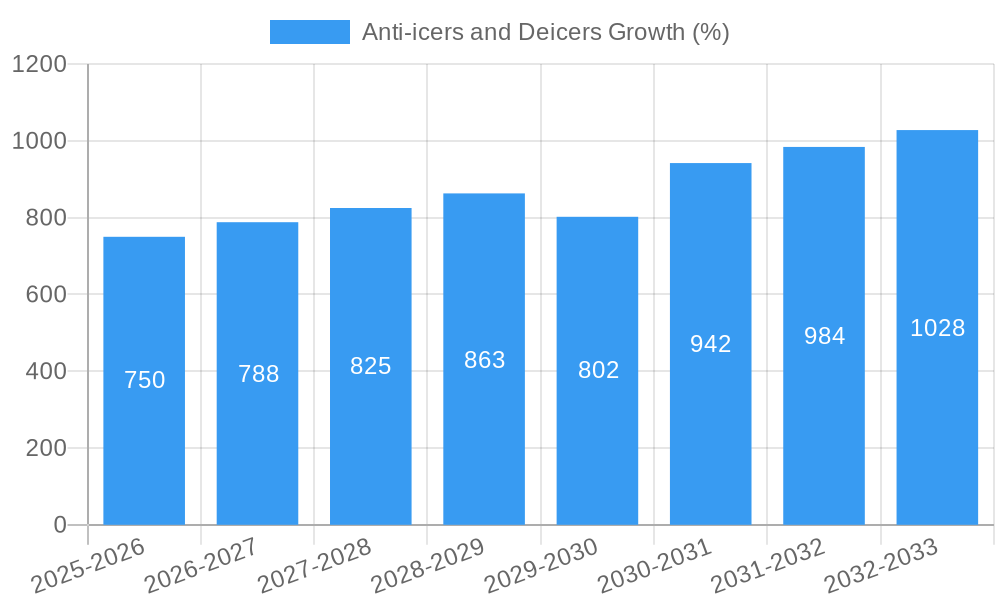
The global anti-icers and deicers market witnessed a CAGR of xx% during the historical period (2019-2024), driven by rising infrastructure development, increasing urbanization, and growing awareness of road safety. The market is projected to experience a CAGR of xx% during the forecast period (2025-2033), reaching a value of xx million units by 2033. Technological advancements, such as the introduction of more effective and environmentally friendly de-icing agents, are further fueling market growth. Shifting consumer preferences towards sustainable solutions and government initiatives promoting eco-friendly practices contribute significantly to the market expansion. Increased adoption rates in emerging economies also play a crucial role. Market penetration is expected to reach xx% in developed regions and xx% in developing regions by 2033.
Dominant Regions, Countries, or Segments in Anti-icers and Deicers
North America currently holds the largest market share (xx%) for anti-icers and deicers due to its extensive highway network, harsh winter conditions, and well-established infrastructure. Europe follows closely with a market share of xx%, while the Asia-Pacific region is expected to witness significant growth driven by rapid infrastructure development and increasing urbanization in countries like China and India. The road segment dominates the market owing to the high volume of traffic and the need for effective de-icing solutions.
- Key Drivers for North America: Robust infrastructure, well-established transportation networks, stringent road safety regulations, and frequent snowfall.
- Key Drivers for Europe: Extensive road network, stringent environmental regulations pushing adoption of eco-friendly products, and high government spending on infrastructure maintenance.
- Key Drivers for Asia-Pacific: Rapid infrastructure development, increasing urbanization, and rising disposable incomes driving demand for better road safety.
- Segment Dominance: Roads segment holds largest market share (xx%) due to high volume of traffic and need for efficient de-icing.
Anti-icers and Deicers Product Landscape
The anti-icers and deicers market offers a diverse range of products, including liquid brines, solid salts (sodium chloride, magnesium chloride, calcium chloride), and organic-based de-icers. Recent innovations focus on enhanced performance characteristics, such as improved melting efficiency at lower temperatures, reduced corrosiveness, and enhanced environmental compatibility. Unique selling propositions are frequently based on superior performance, cost-effectiveness, and environmental friendliness. Technological advancements are streamlining application methods, improving efficacy, and reducing environmental impact.
Key Drivers, Barriers & Challenges in Anti-icers and Deicers
Key Drivers:
- Increasing urbanization and infrastructure development.
- Stringent road safety regulations in many countries.
- Growing awareness of the negative environmental impact of traditional de-icers leading to increased demand for sustainable alternatives.
- Government initiatives and policies to improve road safety and infrastructure.
Key Challenges & Restraints:
- Fluctuations in raw material prices, particularly for salt, impacting profitability.
- Stringent environmental regulations imposing limitations on the use of certain chemicals.
- Competition from alternative snow and ice removal technologies.
- Supply chain disruptions caused by geopolitical instability and extreme weather events.
Emerging Opportunities in Anti-icers and Deicers
- Growing demand for sustainable and environmentally friendly de-icing solutions presents a significant opportunity.
- Expansion into emerging markets with rapidly developing infrastructure.
- Development of innovative application technologies and smart de-icing systems.
- Increased focus on pre-wetting technologies to enhance efficiency and reduce chemical usage.
Growth Accelerators in the Anti-icers and Deicers Industry
Technological breakthroughs, particularly in environmentally benign de-icing formulations, are significant growth accelerators. Strategic partnerships between chemical manufacturers and infrastructure companies are expanding market reach and improving product offerings. The expansion into new geographical markets with harsh winter climates and increasing infrastructure investment is fueling market growth.
Key Players Shaping the Anti-icers and Deicers Market
- Wacker Chemical Corp.
- SurfEllent
- Kissner Group
- SAN Electro Heat a/s
- LNT Group
- Cargill, Inc.
- CP Industries - UT
- Cryotech Deicing Technology
- Great Lakes Chloride, Inc.
- Neo Solutions, Inc.
- Peters Chemical Company
- Proviron, Inc.
- Quad Chemical Corporation
- Shandong Zhongfuji New Material Co., Ltd.
Notable Milestones in Anti-icers and Deicers Sector
- 2021: Introduction of a new biodegradable de-icer by Wacker Chemical Corp.
- 2022: Acquisition of a smaller de-icer company by Cargill, Inc.
- 2023: Launch of a new smart de-icing system by SAN Electro Heat a/s.
- 2024: Implementation of new environmental regulations affecting de-icer formulations in several European countries.
In-Depth Anti-icers and Deicers Market Outlook
The anti-icers and deicers market is poised for robust growth, driven by continuing infrastructure development globally, the increased demand for environmentally sustainable solutions, and the adoption of smart de-icing technologies. Strategic partnerships and investments in research and development will further propel market expansion. Opportunities exist for companies to capitalize on emerging markets, develop innovative products, and improve supply chain efficiencies. The market presents significant potential for both established players and new entrants to innovate and capture market share.
Anti-icers and Deicers Segmentation
-
1. Application
- 1.1. Automobile
- 1.2. Aerospace
- 1.3. Industrial
- 1.4. Transportation
- 1.5. Other
-
2. Types
- 2.1. Granular
- 2.2. Liquid
Anti-icers and Deicers Segmentation By Geography
-
1. North America
- 1.1. United States
- 1.2. Canada
- 1.3. Mexico
-
2. South America
- 2.1. Brazil
- 2.2. Argentina
- 2.3. Rest of South America
-
3. Europe
- 3.1. United Kingdom
- 3.2. Germany
- 3.3. France
- 3.4. Italy
- 3.5. Spain
- 3.6. Russia
- 3.7. Benelux
- 3.8. Nordics
- 3.9. Rest of Europe
-
4. Middle East & Africa
- 4.1. Turkey
- 4.2. Israel
- 4.3. GCC
- 4.4. North Africa
- 4.5. South Africa
- 4.6. Rest of Middle East & Africa
-
5. Asia Pacific
- 5.1. China
- 5.2. India
- 5.3. Japan
- 5.4. South Korea
- 5.5. ASEAN
- 5.6. Oceania
- 5.7. Rest of Asia Pacific

Anti-icers and Deicers REPORT HIGHLIGHTS
| Aspects | Details |
|---|---|
| Study Period | 2019-2033 |
| Base Year | 2024 |
| Estimated Year | 2025 |
| Forecast Period | 2025-2033 |
| Historical Period | 2019-2024 |
| Growth Rate | CAGR of XX% from 2019-2033 |
| Segmentation |
|
Table of Contents
- 1. Introduction
- 1.1. Research Scope
- 1.2. Market Segmentation
- 1.3. Research Methodology
- 1.4. Definitions and Assumptions
- 2. Executive Summary
- 2.1. Introduction
- 3. Market Dynamics
- 3.1. Introduction
- 3.2. Market Drivers
- 3.3. Market Restrains
- 3.4. Market Trends
- 4. Market Factor Analysis
- 4.1. Porters Five Forces
- 4.2. Supply/Value Chain
- 4.3. PESTEL analysis
- 4.4. Market Entropy
- 4.5. Patent/Trademark Analysis
- 5. Global Anti-icers and Deicers Analysis, Insights and Forecast, 2019-2031
- 5.1. Market Analysis, Insights and Forecast - by Application
- 5.1.1. Automobile
- 5.1.2. Aerospace
- 5.1.3. Industrial
- 5.1.4. Transportation
- 5.1.5. Other
- 5.2. Market Analysis, Insights and Forecast - by Types
- 5.2.1. Granular
- 5.2.2. Liquid
- 5.3. Market Analysis, Insights and Forecast - by Region
- 5.3.1. North America
- 5.3.2. South America
- 5.3.3. Europe
- 5.3.4. Middle East & Africa
- 5.3.5. Asia Pacific
- 5.1. Market Analysis, Insights and Forecast - by Application
- 6. North America Anti-icers and Deicers Analysis, Insights and Forecast, 2019-2031
- 6.1. Market Analysis, Insights and Forecast - by Application
- 6.1.1. Automobile
- 6.1.2. Aerospace
- 6.1.3. Industrial
- 6.1.4. Transportation
- 6.1.5. Other
- 6.2. Market Analysis, Insights and Forecast - by Types
- 6.2.1. Granular
- 6.2.2. Liquid
- 6.1. Market Analysis, Insights and Forecast - by Application
- 7. South America Anti-icers and Deicers Analysis, Insights and Forecast, 2019-2031
- 7.1. Market Analysis, Insights and Forecast - by Application
- 7.1.1. Automobile
- 7.1.2. Aerospace
- 7.1.3. Industrial
- 7.1.4. Transportation
- 7.1.5. Other
- 7.2. Market Analysis, Insights and Forecast - by Types
- 7.2.1. Granular
- 7.2.2. Liquid
- 7.1. Market Analysis, Insights and Forecast - by Application
- 8. Europe Anti-icers and Deicers Analysis, Insights and Forecast, 2019-2031
- 8.1. Market Analysis, Insights and Forecast - by Application
- 8.1.1. Automobile
- 8.1.2. Aerospace
- 8.1.3. Industrial
- 8.1.4. Transportation
- 8.1.5. Other
- 8.2. Market Analysis, Insights and Forecast - by Types
- 8.2.1. Granular
- 8.2.2. Liquid
- 8.1. Market Analysis, Insights and Forecast - by Application
- 9. Middle East & Africa Anti-icers and Deicers Analysis, Insights and Forecast, 2019-2031
- 9.1. Market Analysis, Insights and Forecast - by Application
- 9.1.1. Automobile
- 9.1.2. Aerospace
- 9.1.3. Industrial
- 9.1.4. Transportation
- 9.1.5. Other
- 9.2. Market Analysis, Insights and Forecast - by Types
- 9.2.1. Granular
- 9.2.2. Liquid
- 9.1. Market Analysis, Insights and Forecast - by Application
- 10. Asia Pacific Anti-icers and Deicers Analysis, Insights and Forecast, 2019-2031
- 10.1. Market Analysis, Insights and Forecast - by Application
- 10.1.1. Automobile
- 10.1.2. Aerospace
- 10.1.3. Industrial
- 10.1.4. Transportation
- 10.1.5. Other
- 10.2. Market Analysis, Insights and Forecast - by Types
- 10.2.1. Granular
- 10.2.2. Liquid
- 10.1. Market Analysis, Insights and Forecast - by Application
- 11. Competitive Analysis
- 11.1. Global Market Share Analysis 2024
- 11.2. Company Profiles
- 11.2.1 Wacker Chemical Corp.
- 11.2.1.1. Overview
- 11.2.1.2. Products
- 11.2.1.3. SWOT Analysis
- 11.2.1.4. Recent Developments
- 11.2.1.5. Financials (Based on Availability)
- 11.2.2 SurfEllent
- 11.2.2.1. Overview
- 11.2.2.2. Products
- 11.2.2.3. SWOT Analysis
- 11.2.2.4. Recent Developments
- 11.2.2.5. Financials (Based on Availability)
- 11.2.3 Kissner Group
- 11.2.3.1. Overview
- 11.2.3.2. Products
- 11.2.3.3. SWOT Analysis
- 11.2.3.4. Recent Developments
- 11.2.3.5. Financials (Based on Availability)
- 11.2.4 SAN Electro Heat a/s
- 11.2.4.1. Overview
- 11.2.4.2. Products
- 11.2.4.3. SWOT Analysis
- 11.2.4.4. Recent Developments
- 11.2.4.5. Financials (Based on Availability)
- 11.2.5 LNT Group
- 11.2.5.1. Overview
- 11.2.5.2. Products
- 11.2.5.3. SWOT Analysis
- 11.2.5.4. Recent Developments
- 11.2.5.5. Financials (Based on Availability)
- 11.2.6 Cargill
- 11.2.6.1. Overview
- 11.2.6.2. Products
- 11.2.6.3. SWOT Analysis
- 11.2.6.4. Recent Developments
- 11.2.6.5. Financials (Based on Availability)
- 11.2.7 Inc.
- 11.2.7.1. Overview
- 11.2.7.2. Products
- 11.2.7.3. SWOT Analysis
- 11.2.7.4. Recent Developments
- 11.2.7.5. Financials (Based on Availability)
- 11.2.8 CP Industries - UT
- 11.2.8.1. Overview
- 11.2.8.2. Products
- 11.2.8.3. SWOT Analysis
- 11.2.8.4. Recent Developments
- 11.2.8.5. Financials (Based on Availability)
- 11.2.9 Cryotech Deicing Technology
- 11.2.9.1. Overview
- 11.2.9.2. Products
- 11.2.9.3. SWOT Analysis
- 11.2.9.4. Recent Developments
- 11.2.9.5. Financials (Based on Availability)
- 11.2.10 Great Lakes Chloride
- 11.2.10.1. Overview
- 11.2.10.2. Products
- 11.2.10.3. SWOT Analysis
- 11.2.10.4. Recent Developments
- 11.2.10.5. Financials (Based on Availability)
- 11.2.11 Inc.
- 11.2.11.1. Overview
- 11.2.11.2. Products
- 11.2.11.3. SWOT Analysis
- 11.2.11.4. Recent Developments
- 11.2.11.5. Financials (Based on Availability)
- 11.2.12 Neo Solutions
- 11.2.12.1. Overview
- 11.2.12.2. Products
- 11.2.12.3. SWOT Analysis
- 11.2.12.4. Recent Developments
- 11.2.12.5. Financials (Based on Availability)
- 11.2.13 Inc.
- 11.2.13.1. Overview
- 11.2.13.2. Products
- 11.2.13.3. SWOT Analysis
- 11.2.13.4. Recent Developments
- 11.2.13.5. Financials (Based on Availability)
- 11.2.14 Peters Chemical Company
- 11.2.14.1. Overview
- 11.2.14.2. Products
- 11.2.14.3. SWOT Analysis
- 11.2.14.4. Recent Developments
- 11.2.14.5. Financials (Based on Availability)
- 11.2.15 Proviron
- 11.2.15.1. Overview
- 11.2.15.2. Products
- 11.2.15.3. SWOT Analysis
- 11.2.15.4. Recent Developments
- 11.2.15.5. Financials (Based on Availability)
- 11.2.16 Inc.
- 11.2.16.1. Overview
- 11.2.16.2. Products
- 11.2.16.3. SWOT Analysis
- 11.2.16.4. Recent Developments
- 11.2.16.5. Financials (Based on Availability)
- 11.2.17 Quad Chemical Corporation
- 11.2.17.1. Overview
- 11.2.17.2. Products
- 11.2.17.3. SWOT Analysis
- 11.2.17.4. Recent Developments
- 11.2.17.5. Financials (Based on Availability)
- 11.2.18 Shandong Zhongfuji New Material Co.
- 11.2.18.1. Overview
- 11.2.18.2. Products
- 11.2.18.3. SWOT Analysis
- 11.2.18.4. Recent Developments
- 11.2.18.5. Financials (Based on Availability)
- 11.2.19 Ltd.
- 11.2.19.1. Overview
- 11.2.19.2. Products
- 11.2.19.3. SWOT Analysis
- 11.2.19.4. Recent Developments
- 11.2.19.5. Financials (Based on Availability)
- 11.2.1 Wacker Chemical Corp.
List of Figures
- Figure 1: Global Anti-icers and Deicers Revenue Breakdown (million, %) by Region 2024 & 2032
- Figure 2: Global Anti-icers and Deicers Volume Breakdown (K, %) by Region 2024 & 2032
- Figure 3: North America Anti-icers and Deicers Revenue (million), by Application 2024 & 2032
- Figure 4: North America Anti-icers and Deicers Volume (K), by Application 2024 & 2032
- Figure 5: North America Anti-icers and Deicers Revenue Share (%), by Application 2024 & 2032
- Figure 6: North America Anti-icers and Deicers Volume Share (%), by Application 2024 & 2032
- Figure 7: North America Anti-icers and Deicers Revenue (million), by Types 2024 & 2032
- Figure 8: North America Anti-icers and Deicers Volume (K), by Types 2024 & 2032
- Figure 9: North America Anti-icers and Deicers Revenue Share (%), by Types 2024 & 2032
- Figure 10: North America Anti-icers and Deicers Volume Share (%), by Types 2024 & 2032
- Figure 11: North America Anti-icers and Deicers Revenue (million), by Country 2024 & 2032
- Figure 12: North America Anti-icers and Deicers Volume (K), by Country 2024 & 2032
- Figure 13: North America Anti-icers and Deicers Revenue Share (%), by Country 2024 & 2032
- Figure 14: North America Anti-icers and Deicers Volume Share (%), by Country 2024 & 2032
- Figure 15: South America Anti-icers and Deicers Revenue (million), by Application 2024 & 2032
- Figure 16: South America Anti-icers and Deicers Volume (K), by Application 2024 & 2032
- Figure 17: South America Anti-icers and Deicers Revenue Share (%), by Application 2024 & 2032
- Figure 18: South America Anti-icers and Deicers Volume Share (%), by Application 2024 & 2032
- Figure 19: South America Anti-icers and Deicers Revenue (million), by Types 2024 & 2032
- Figure 20: South America Anti-icers and Deicers Volume (K), by Types 2024 & 2032
- Figure 21: South America Anti-icers and Deicers Revenue Share (%), by Types 2024 & 2032
- Figure 22: South America Anti-icers and Deicers Volume Share (%), by Types 2024 & 2032
- Figure 23: South America Anti-icers and Deicers Revenue (million), by Country 2024 & 2032
- Figure 24: South America Anti-icers and Deicers Volume (K), by Country 2024 & 2032
- Figure 25: South America Anti-icers and Deicers Revenue Share (%), by Country 2024 & 2032
- Figure 26: South America Anti-icers and Deicers Volume Share (%), by Country 2024 & 2032
- Figure 27: Europe Anti-icers and Deicers Revenue (million), by Application 2024 & 2032
- Figure 28: Europe Anti-icers and Deicers Volume (K), by Application 2024 & 2032
- Figure 29: Europe Anti-icers and Deicers Revenue Share (%), by Application 2024 & 2032
- Figure 30: Europe Anti-icers and Deicers Volume Share (%), by Application 2024 & 2032
- Figure 31: Europe Anti-icers and Deicers Revenue (million), by Types 2024 & 2032
- Figure 32: Europe Anti-icers and Deicers Volume (K), by Types 2024 & 2032
- Figure 33: Europe Anti-icers and Deicers Revenue Share (%), by Types 2024 & 2032
- Figure 34: Europe Anti-icers and Deicers Volume Share (%), by Types 2024 & 2032
- Figure 35: Europe Anti-icers and Deicers Revenue (million), by Country 2024 & 2032
- Figure 36: Europe Anti-icers and Deicers Volume (K), by Country 2024 & 2032
- Figure 37: Europe Anti-icers and Deicers Revenue Share (%), by Country 2024 & 2032
- Figure 38: Europe Anti-icers and Deicers Volume Share (%), by Country 2024 & 2032
- Figure 39: Middle East & Africa Anti-icers and Deicers Revenue (million), by Application 2024 & 2032
- Figure 40: Middle East & Africa Anti-icers and Deicers Volume (K), by Application 2024 & 2032
- Figure 41: Middle East & Africa Anti-icers and Deicers Revenue Share (%), by Application 2024 & 2032
- Figure 42: Middle East & Africa Anti-icers and Deicers Volume Share (%), by Application 2024 & 2032
- Figure 43: Middle East & Africa Anti-icers and Deicers Revenue (million), by Types 2024 & 2032
- Figure 44: Middle East & Africa Anti-icers and Deicers Volume (K), by Types 2024 & 2032
- Figure 45: Middle East & Africa Anti-icers and Deicers Revenue Share (%), by Types 2024 & 2032
- Figure 46: Middle East & Africa Anti-icers and Deicers Volume Share (%), by Types 2024 & 2032
- Figure 47: Middle East & Africa Anti-icers and Deicers Revenue (million), by Country 2024 & 2032
- Figure 48: Middle East & Africa Anti-icers and Deicers Volume (K), by Country 2024 & 2032
- Figure 49: Middle East & Africa Anti-icers and Deicers Revenue Share (%), by Country 2024 & 2032
- Figure 50: Middle East & Africa Anti-icers and Deicers Volume Share (%), by Country 2024 & 2032
- Figure 51: Asia Pacific Anti-icers and Deicers Revenue (million), by Application 2024 & 2032
- Figure 52: Asia Pacific Anti-icers and Deicers Volume (K), by Application 2024 & 2032
- Figure 53: Asia Pacific Anti-icers and Deicers Revenue Share (%), by Application 2024 & 2032
- Figure 54: Asia Pacific Anti-icers and Deicers Volume Share (%), by Application 2024 & 2032
- Figure 55: Asia Pacific Anti-icers and Deicers Revenue (million), by Types 2024 & 2032
- Figure 56: Asia Pacific Anti-icers and Deicers Volume (K), by Types 2024 & 2032
- Figure 57: Asia Pacific Anti-icers and Deicers Revenue Share (%), by Types 2024 & 2032
- Figure 58: Asia Pacific Anti-icers and Deicers Volume Share (%), by Types 2024 & 2032
- Figure 59: Asia Pacific Anti-icers and Deicers Revenue (million), by Country 2024 & 2032
- Figure 60: Asia Pacific Anti-icers and Deicers Volume (K), by Country 2024 & 2032
- Figure 61: Asia Pacific Anti-icers and Deicers Revenue Share (%), by Country 2024 & 2032
- Figure 62: Asia Pacific Anti-icers and Deicers Volume Share (%), by Country 2024 & 2032
List of Tables
- Table 1: Global Anti-icers and Deicers Revenue million Forecast, by Region 2019 & 2032
- Table 2: Global Anti-icers and Deicers Volume K Forecast, by Region 2019 & 2032
- Table 3: Global Anti-icers and Deicers Revenue million Forecast, by Application 2019 & 2032
- Table 4: Global Anti-icers and Deicers Volume K Forecast, by Application 2019 & 2032
- Table 5: Global Anti-icers and Deicers Revenue million Forecast, by Types 2019 & 2032
- Table 6: Global Anti-icers and Deicers Volume K Forecast, by Types 2019 & 2032
- Table 7: Global Anti-icers and Deicers Revenue million Forecast, by Region 2019 & 2032
- Table 8: Global Anti-icers and Deicers Volume K Forecast, by Region 2019 & 2032
- Table 9: Global Anti-icers and Deicers Revenue million Forecast, by Application 2019 & 2032
- Table 10: Global Anti-icers and Deicers Volume K Forecast, by Application 2019 & 2032
- Table 11: Global Anti-icers and Deicers Revenue million Forecast, by Types 2019 & 2032
- Table 12: Global Anti-icers and Deicers Volume K Forecast, by Types 2019 & 2032
- Table 13: Global Anti-icers and Deicers Revenue million Forecast, by Country 2019 & 2032
- Table 14: Global Anti-icers and Deicers Volume K Forecast, by Country 2019 & 2032
- Table 15: United States Anti-icers and Deicers Revenue (million) Forecast, by Application 2019 & 2032
- Table 16: United States Anti-icers and Deicers Volume (K) Forecast, by Application 2019 & 2032
- Table 17: Canada Anti-icers and Deicers Revenue (million) Forecast, by Application 2019 & 2032
- Table 18: Canada Anti-icers and Deicers Volume (K) Forecast, by Application 2019 & 2032
- Table 19: Mexico Anti-icers and Deicers Revenue (million) Forecast, by Application 2019 & 2032
- Table 20: Mexico Anti-icers and Deicers Volume (K) Forecast, by Application 2019 & 2032
- Table 21: Global Anti-icers and Deicers Revenue million Forecast, by Application 2019 & 2032
- Table 22: Global Anti-icers and Deicers Volume K Forecast, by Application 2019 & 2032
- Table 23: Global Anti-icers and Deicers Revenue million Forecast, by Types 2019 & 2032
- Table 24: Global Anti-icers and Deicers Volume K Forecast, by Types 2019 & 2032
- Table 25: Global Anti-icers and Deicers Revenue million Forecast, by Country 2019 & 2032
- Table 26: Global Anti-icers and Deicers Volume K Forecast, by Country 2019 & 2032
- Table 27: Brazil Anti-icers and Deicers Revenue (million) Forecast, by Application 2019 & 2032
- Table 28: Brazil Anti-icers and Deicers Volume (K) Forecast, by Application 2019 & 2032
- Table 29: Argentina Anti-icers and Deicers Revenue (million) Forecast, by Application 2019 & 2032
- Table 30: Argentina Anti-icers and Deicers Volume (K) Forecast, by Application 2019 & 2032
- Table 31: Rest of South America Anti-icers and Deicers Revenue (million) Forecast, by Application 2019 & 2032
- Table 32: Rest of South America Anti-icers and Deicers Volume (K) Forecast, by Application 2019 & 2032
- Table 33: Global Anti-icers and Deicers Revenue million Forecast, by Application 2019 & 2032
- Table 34: Global Anti-icers and Deicers Volume K Forecast, by Application 2019 & 2032
- Table 35: Global Anti-icers and Deicers Revenue million Forecast, by Types 2019 & 2032
- Table 36: Global Anti-icers and Deicers Volume K Forecast, by Types 2019 & 2032
- Table 37: Global Anti-icers and Deicers Revenue million Forecast, by Country 2019 & 2032
- Table 38: Global Anti-icers and Deicers Volume K Forecast, by Country 2019 & 2032
- Table 39: United Kingdom Anti-icers and Deicers Revenue (million) Forecast, by Application 2019 & 2032
- Table 40: United Kingdom Anti-icers and Deicers Volume (K) Forecast, by Application 2019 & 2032
- Table 41: Germany Anti-icers and Deicers Revenue (million) Forecast, by Application 2019 & 2032
- Table 42: Germany Anti-icers and Deicers Volume (K) Forecast, by Application 2019 & 2032
- Table 43: France Anti-icers and Deicers Revenue (million) Forecast, by Application 2019 & 2032
- Table 44: France Anti-icers and Deicers Volume (K) Forecast, by Application 2019 & 2032
- Table 45: Italy Anti-icers and Deicers Revenue (million) Forecast, by Application 2019 & 2032
- Table 46: Italy Anti-icers and Deicers Volume (K) Forecast, by Application 2019 & 2032
- Table 47: Spain Anti-icers and Deicers Revenue (million) Forecast, by Application 2019 & 2032
- Table 48: Spain Anti-icers and Deicers Volume (K) Forecast, by Application 2019 & 2032
- Table 49: Russia Anti-icers and Deicers Revenue (million) Forecast, by Application 2019 & 2032
- Table 50: Russia Anti-icers and Deicers Volume (K) Forecast, by Application 2019 & 2032
- Table 51: Benelux Anti-icers and Deicers Revenue (million) Forecast, by Application 2019 & 2032
- Table 52: Benelux Anti-icers and Deicers Volume (K) Forecast, by Application 2019 & 2032
- Table 53: Nordics Anti-icers and Deicers Revenue (million) Forecast, by Application 2019 & 2032
- Table 54: Nordics Anti-icers and Deicers Volume (K) Forecast, by Application 2019 & 2032
- Table 55: Rest of Europe Anti-icers and Deicers Revenue (million) Forecast, by Application 2019 & 2032
- Table 56: Rest of Europe Anti-icers and Deicers Volume (K) Forecast, by Application 2019 & 2032
- Table 57: Global Anti-icers and Deicers Revenue million Forecast, by Application 2019 & 2032
- Table 58: Global Anti-icers and Deicers Volume K Forecast, by Application 2019 & 2032
- Table 59: Global Anti-icers and Deicers Revenue million Forecast, by Types 2019 & 2032
- Table 60: Global Anti-icers and Deicers Volume K Forecast, by Types 2019 & 2032
- Table 61: Global Anti-icers and Deicers Revenue million Forecast, by Country 2019 & 2032
- Table 62: Global Anti-icers and Deicers Volume K Forecast, by Country 2019 & 2032
- Table 63: Turkey Anti-icers and Deicers Revenue (million) Forecast, by Application 2019 & 2032
- Table 64: Turkey Anti-icers and Deicers Volume (K) Forecast, by Application 2019 & 2032
- Table 65: Israel Anti-icers and Deicers Revenue (million) Forecast, by Application 2019 & 2032
- Table 66: Israel Anti-icers and Deicers Volume (K) Forecast, by Application 2019 & 2032
- Table 67: GCC Anti-icers and Deicers Revenue (million) Forecast, by Application 2019 & 2032
- Table 68: GCC Anti-icers and Deicers Volume (K) Forecast, by Application 2019 & 2032
- Table 69: North Africa Anti-icers and Deicers Revenue (million) Forecast, by Application 2019 & 2032
- Table 70: North Africa Anti-icers and Deicers Volume (K) Forecast, by Application 2019 & 2032
- Table 71: South Africa Anti-icers and Deicers Revenue (million) Forecast, by Application 2019 & 2032
- Table 72: South Africa Anti-icers and Deicers Volume (K) Forecast, by Application 2019 & 2032
- Table 73: Rest of Middle East & Africa Anti-icers and Deicers Revenue (million) Forecast, by Application 2019 & 2032
- Table 74: Rest of Middle East & Africa Anti-icers and Deicers Volume (K) Forecast, by Application 2019 & 2032
- Table 75: Global Anti-icers and Deicers Revenue million Forecast, by Application 2019 & 2032
- Table 76: Global Anti-icers and Deicers Volume K Forecast, by Application 2019 & 2032
- Table 77: Global Anti-icers and Deicers Revenue million Forecast, by Types 2019 & 2032
- Table 78: Global Anti-icers and Deicers Volume K Forecast, by Types 2019 & 2032
- Table 79: Global Anti-icers and Deicers Revenue million Forecast, by Country 2019 & 2032
- Table 80: Global Anti-icers and Deicers Volume K Forecast, by Country 2019 & 2032
- Table 81: China Anti-icers and Deicers Revenue (million) Forecast, by Application 2019 & 2032
- Table 82: China Anti-icers and Deicers Volume (K) Forecast, by Application 2019 & 2032
- Table 83: India Anti-icers and Deicers Revenue (million) Forecast, by Application 2019 & 2032
- Table 84: India Anti-icers and Deicers Volume (K) Forecast, by Application 2019 & 2032
- Table 85: Japan Anti-icers and Deicers Revenue (million) Forecast, by Application 2019 & 2032
- Table 86: Japan Anti-icers and Deicers Volume (K) Forecast, by Application 2019 & 2032
- Table 87: South Korea Anti-icers and Deicers Revenue (million) Forecast, by Application 2019 & 2032
- Table 88: South Korea Anti-icers and Deicers Volume (K) Forecast, by Application 2019 & 2032
- Table 89: ASEAN Anti-icers and Deicers Revenue (million) Forecast, by Application 2019 & 2032
- Table 90: ASEAN Anti-icers and Deicers Volume (K) Forecast, by Application 2019 & 2032
- Table 91: Oceania Anti-icers and Deicers Revenue (million) Forecast, by Application 2019 & 2032
- Table 92: Oceania Anti-icers and Deicers Volume (K) Forecast, by Application 2019 & 2032
- Table 93: Rest of Asia Pacific Anti-icers and Deicers Revenue (million) Forecast, by Application 2019 & 2032
- Table 94: Rest of Asia Pacific Anti-icers and Deicers Volume (K) Forecast, by Application 2019 & 2032
Frequently Asked Questions
1. What is the projected Compound Annual Growth Rate (CAGR) of the Anti-icers and Deicers?
The projected CAGR is approximately XX%.
2. Which companies are prominent players in the Anti-icers and Deicers?
Key companies in the market include Wacker Chemical Corp., SurfEllent, Kissner Group, SAN Electro Heat a/s, LNT Group, Cargill, Inc., CP Industries - UT, Cryotech Deicing Technology, Great Lakes Chloride, Inc., Neo Solutions, Inc., Peters Chemical Company, Proviron, Inc., Quad Chemical Corporation, Shandong Zhongfuji New Material Co., Ltd..
3. What are the main segments of the Anti-icers and Deicers?
The market segments include Application, Types.
4. Can you provide details about the market size?
The market size is estimated to be USD XXX million as of 2022.
5. What are some drivers contributing to market growth?
N/A
6. What are the notable trends driving market growth?
N/A
7. Are there any restraints impacting market growth?
N/A
8. Can you provide examples of recent developments in the market?
N/A
9. What pricing options are available for accessing the report?
Pricing options include single-user, multi-user, and enterprise licenses priced at USD 4350.00, USD 6525.00, and USD 8700.00 respectively.
10. Is the market size provided in terms of value or volume?
The market size is provided in terms of value, measured in million and volume, measured in K.
11. Are there any specific market keywords associated with the report?
Yes, the market keyword associated with the report is "Anti-icers and Deicers," which aids in identifying and referencing the specific market segment covered.
12. How do I determine which pricing option suits my needs best?
The pricing options vary based on user requirements and access needs. Individual users may opt for single-user licenses, while businesses requiring broader access may choose multi-user or enterprise licenses for cost-effective access to the report.
13. Are there any additional resources or data provided in the Anti-icers and Deicers report?
While the report offers comprehensive insights, it's advisable to review the specific contents or supplementary materials provided to ascertain if additional resources or data are available.
14. How can I stay updated on further developments or reports in the Anti-icers and Deicers?
To stay informed about further developments, trends, and reports in the Anti-icers and Deicers, consider subscribing to industry newsletters, following relevant companies and organizations, or regularly checking reputable industry news sources and publications.
Methodology
Step 1 - Identification of Relevant Samples Size from Population Database


Step 2 - Approaches for Defining Global Market Size (Value, Volume* & Price*)

Note*: In applicable scenarios
Step 3 - Data Sources
Primary Research
- Web Analytics
- Survey Reports
- Research Institute
- Latest Research Reports
- Opinion Leaders
Secondary Research
- Annual Reports
- White Paper
- Latest Press Release
- Industry Association
- Paid Database
- Investor Presentations

Step 4 - Data Triangulation
Involves using different sources of information in order to increase the validity of a study
These sources are likely to be stakeholders in a program - participants, other researchers, program staff, other community members, and so on.
Then we put all data in single framework & apply various statistical tools to find out the dynamic on the market.
During the analysis stage, feedback from the stakeholder groups would be compared to determine areas of agreement as well as areas of divergence


