
Key Insights
The anti-fraud software market is experiencing robust growth, driven by the escalating sophistication of fraudulent activities across various sectors. The increasing adoption of digital transactions and the expansion of e-commerce have created a fertile ground for fraudsters, leading businesses to invest heavily in robust anti-fraud solutions. This market is projected to maintain a healthy Compound Annual Growth Rate (CAGR) throughout the forecast period (2025-2033), fueled by advancements in artificial intelligence (AI), machine learning (ML), and big data analytics. These technologies enable more accurate fraud detection, faster response times, and improved prevention capabilities. Furthermore, the rise of regulation aimed at protecting consumer data and minimizing financial losses is compelling organizations to adopt advanced anti-fraud measures, contributing to market expansion. Key segments within the market include transaction monitoring, identity verification, and fraud investigation solutions, each experiencing varying growth trajectories based on specific industry needs and technological advancements. Leading players are continuously innovating to stay ahead of evolving fraud tactics, offering integrated platforms and specialized solutions tailored to specific industries like banking, insurance, and e-commerce.
The competitive landscape is characterized by a mix of established players and emerging technology companies. Established players, such as IBM and SAS, leverage their existing customer base and technological prowess, while emerging companies offer innovative solutions with a focus on specific niches. The market's future growth will likely depend on the continuous adaptation of anti-fraud technologies to counter increasingly sophisticated fraud schemes, the integration of AI and ML for enhanced accuracy, and the development of solutions that address privacy concerns while maintaining effectiveness. Geographic expansion, particularly in developing economies with growing digital adoption, will also contribute significantly to market growth. A considerable portion of growth will come from the adoption of cloud-based solutions offering scalability and cost-effectiveness, influencing the long-term market dynamics. The success of companies in this market hinges on their ability to provide effective, adaptable, and scalable solutions that address the ever-evolving challenges posed by fraudsters.
Anti-Fraud Software Market Report: 2019-2033
This comprehensive report provides an in-depth analysis of the Anti-Fraud Software market, encompassing market dynamics, growth trends, regional dominance, product landscape, key players, and future outlook. The study period spans from 2019 to 2033, with 2025 serving as the base and estimated year. The forecast period covers 2025-2033, and the historical period encompasses 2019-2024. This report is crucial for businesses, investors, and industry professionals seeking to understand and navigate this rapidly evolving landscape. The report's parent market is Cybersecurity Software, while the child market is Fraud Detection and Prevention. The global market size in 2025 is estimated at $XX billion.
Anti-Fraud Software Market Dynamics & Structure
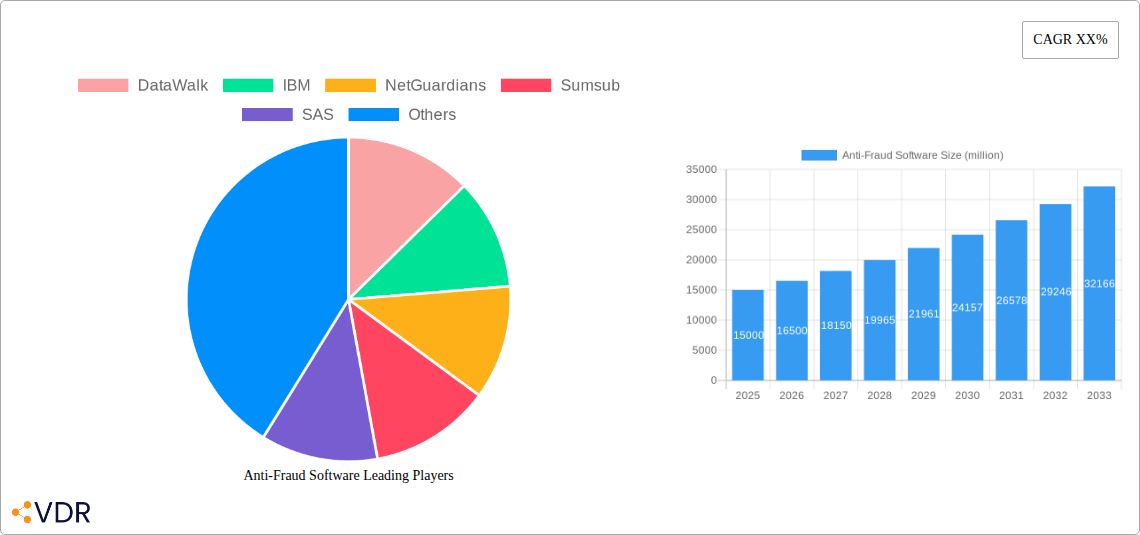
The anti-fraud software market is characterized by a moderately concentrated structure with several major players holding significant market share. DataWalk, IBM, and SAS, for instance, collectively account for approximately xx% of the market in 2025. However, the market is also dynamic, with ongoing technological innovation driving fragmentation and the emergence of specialized solutions. Regulatory changes, particularly concerning data privacy (GDPR, CCPA), are significantly impacting market dynamics, pushing for more robust and compliant solutions. Competitive pressures are intense, with both established players and nimble startups vying for market share through product differentiation and strategic partnerships. The increasing prevalence of sophisticated fraud techniques fuels continuous innovation, creating a need for advanced AI and machine learning solutions. Mergers and acquisitions (M&A) activity is significant, with an estimated xx deals in the historical period, consolidating market share and accelerating technological integration.
- Market Concentration: Moderately concentrated, with top 3 players holding xx% market share in 2025.
- Technological Innovation: Driven by AI, machine learning, and advanced analytics.
- Regulatory Framework: GDPR, CCPA, and other regulations are driving demand for compliant solutions.
- M&A Activity: An estimated xx deals occurred between 2019 and 2024.
- Innovation Barriers: High R&D costs, talent acquisition challenges, and rapid technological shifts.
Anti-Fraud Software Growth Trends & Insights
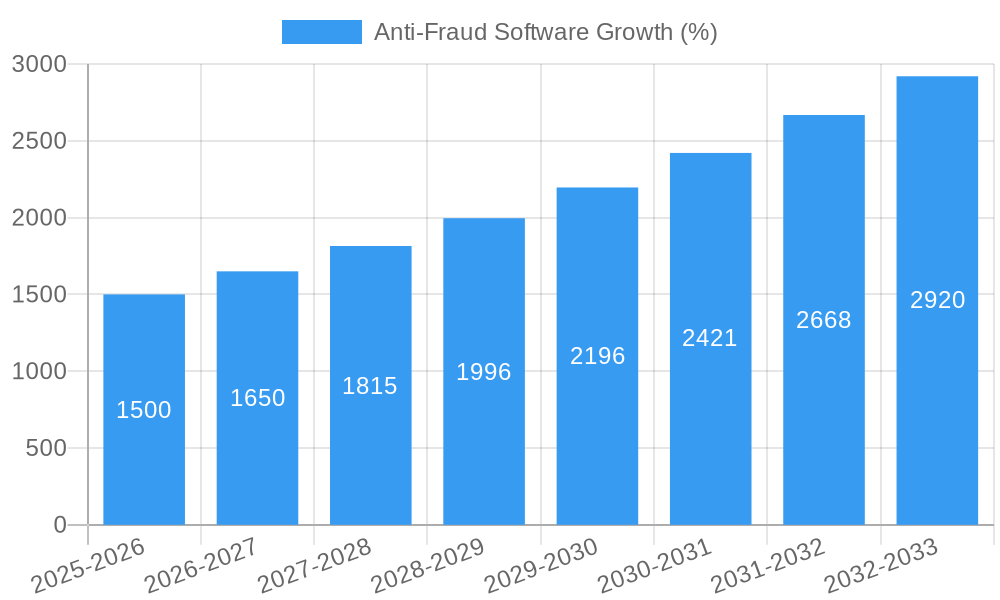
The global anti-fraud software market is experiencing robust growth, driven by the escalating incidence of financial and digital fraud across various industries. The market size expanded from $XX billion in 2019 to an estimated $XX billion in 2025, exhibiting a Compound Annual Growth Rate (CAGR) of xx% during the historical period. This growth is propelled by increasing digital transactions, the expanding adoption of e-commerce, and the growing sophistication of fraudulent activities. Technological advancements, such as AI-powered fraud detection systems, are significantly improving accuracy and efficiency, driving further market adoption. Consumer awareness of fraud risks and the subsequent demand for robust security measures are also contributing factors. Market penetration in key sectors like financial services and e-commerce remains high but is steadily increasing in other sectors such as healthcare and retail.
- Market Size (2025): $XX billion
- CAGR (2019-2025): xx%
- Market Penetration (2025): xx% in key sectors.
- Technological Disruption: AI and machine learning are transforming fraud detection capabilities.
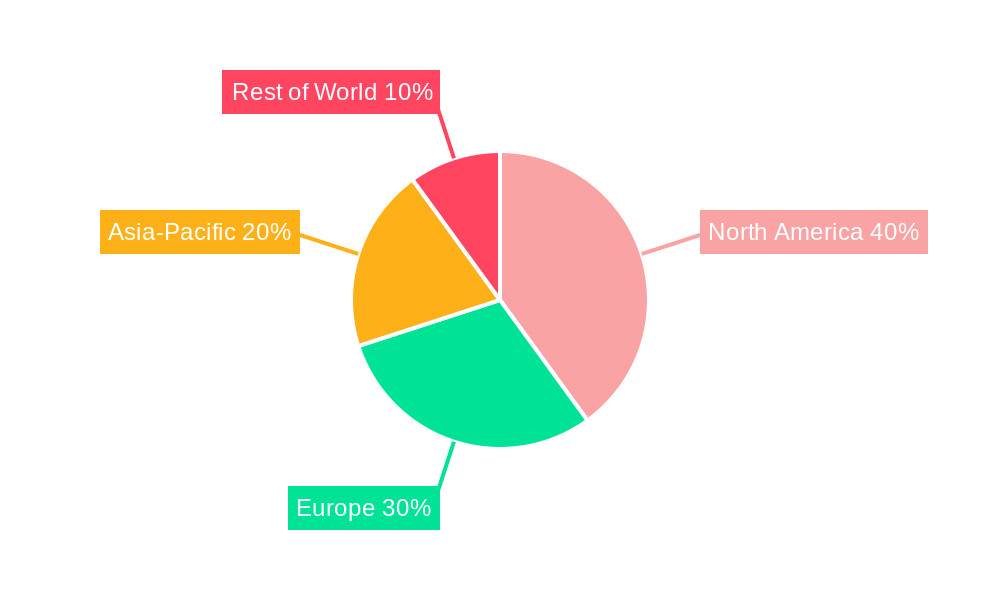
Dominant Regions, Countries, or Segments in Anti-Fraud Software
North America currently holds the largest market share in the anti-fraud software market, driven by strong technological advancements, high digital adoption rates, and stringent regulatory environments. Europe is a close second, fueled by similar factors, particularly the impact of GDPR. The Asia-Pacific region is experiencing rapid growth, driven by increasing digitalization and a burgeoning e-commerce sector. However, variations in regulatory frameworks and technological infrastructure across different countries within these regions influence growth patterns.
- North America: High market share driven by strong technological innovation and regulatory pressures.
- Europe: Significant growth, particularly influenced by GDPR compliance.
- Asia-Pacific: Rapid expansion driven by increasing digital adoption and e-commerce growth.
- Key Drivers: Strong digital economies, stringent regulations, and increasing cybersecurity concerns.
Anti-Fraud Software Product Landscape
The anti-fraud software market offers a diverse range of solutions, from rule-based systems to sophisticated AI-powered platforms. These solutions vary in their functionalities, encompassing transaction monitoring, identity verification, behavioral biometrics, and advanced analytics. Key differentiators include accuracy rates, ease of integration, scalability, and the ability to adapt to evolving fraud techniques. The market witnesses continuous innovation, with new features like real-time fraud detection and predictive analytics constantly being integrated into existing products. Performance metrics such as false positive rates and detection accuracy are crucial factors influencing customer choice.
Key Drivers, Barriers & Challenges in Anti-Fraud Software
Key Drivers: The increasing prevalence of sophisticated fraud schemes, stringent regulatory requirements around data protection, growing e-commerce adoption, and advancements in AI and machine learning technologies all contribute to the market’s growth.
Key Challenges: High implementation costs, the need for skilled professionals to manage complex systems, the constant evolution of fraud techniques requiring continuous updates, and integration challenges with existing infrastructure pose significant obstacles. Supply chain disruptions can impact the availability of crucial components, leading to delays and increased costs. Furthermore, data privacy regulations impose restrictions on data collection and usage, which can limit the effectiveness of some solutions.
Emerging Opportunities in Anti-Fraud Software
Emerging opportunities lie in leveraging advanced technologies like blockchain for secure transactions, expanding into untapped markets like the Internet of Things (IoT) security, developing specialized solutions for specific industry needs (healthcare, supply chain), and focusing on improving customer experience while ensuring robust security. The growing adoption of open banking presents new opportunities for fraud detection in financial transactions.
Growth Accelerators in the Anti-Fraud Software Industry
Strategic partnerships between technology providers and financial institutions, advancements in AI-powered fraud detection, expanding market penetration into new sectors, and the development of integrated security solutions are all significant growth catalysts. Furthermore, investments in R&D and continuous product innovation will fuel long-term market growth.
Key Players Shaping the Anti-Fraud Software Market
- DataWalk
- IBM
- NetGuardians
- Sumsub
- SAS
- AltexSoft
- Opticks
- Softprom
- Covery
- Signifyd
- Nethone
- Nuance
- FRISS
- Pindrop
- Quantexa
- Splunk
- NICE Actimize
- Fraud.net
- Diligent
- Forter
- Riskified
- SEON
- Sift
- AWS
Notable Milestones in Anti-Fraud Software Sector
- 2020, Q4: Introduction of AI-powered behavioral biometrics by several key players.
- 2021, Q2: Significant increase in M&A activity within the sector.
- 2022, Q3: Launch of several cloud-based anti-fraud solutions.
- 2023, Q1: New regulations impacting data collection and usage lead to product updates.
- 2024, Q2: A major player unveils a blockchain-integrated fraud detection system.
In-Depth Anti-Fraud Software Market Outlook
The anti-fraud software market is poised for sustained growth, driven by persistent threats and the increasing adoption of digital technologies. Strategic investments in R&D, innovative partnerships, and expansion into emerging markets will define future market leaders. Focus on AI-powered solutions, enhanced data security, and streamlined integration will be key factors in capturing significant market share and fostering long-term growth. The market is expected to reach $XX billion by 2033.
Anti-Fraud Software Segmentation
-
1. Application
- 1.1. Large Enterprises
- 1.2. SMEs
-
2. Types
- 2.1. Cloud-based
- 2.2. On-premises
Anti-Fraud Software Segmentation By Geography
-
1. North America
- 1.1. United States
- 1.2. Canada
- 1.3. Mexico
-
2. South America
- 2.1. Brazil
- 2.2. Argentina
- 2.3. Rest of South America
-
3. Europe
- 3.1. United Kingdom
- 3.2. Germany
- 3.3. France
- 3.4. Italy
- 3.5. Spain
- 3.6. Russia
- 3.7. Benelux
- 3.8. Nordics
- 3.9. Rest of Europe
-
4. Middle East & Africa
- 4.1. Turkey
- 4.2. Israel
- 4.3. GCC
- 4.4. North Africa
- 4.5. South Africa
- 4.6. Rest of Middle East & Africa
-
5. Asia Pacific
- 5.1. China
- 5.2. India
- 5.3. Japan
- 5.4. South Korea
- 5.5. ASEAN
- 5.6. Oceania
- 5.7. Rest of Asia Pacific
Anti-Fraud Software REPORT HIGHLIGHTS
| Aspects | Details |
|---|---|
| Study Period | 2019-2033 |
| Base Year | 2024 |
| Estimated Year | 2025 |
| Forecast Period | 2025-2033 |
| Historical Period | 2019-2024 |
| Growth Rate | CAGR of XX% from 2019-2033 |
| Segmentation |
|
Table of Contents
- 1. Introduction
- 1.1. Research Scope
- 1.2. Market Segmentation
- 1.3. Research Methodology
- 1.4. Definitions and Assumptions
- 2. Executive Summary
- 2.1. Introduction
- 3. Market Dynamics
- 3.1. Introduction
- 3.2. Market Drivers
- 3.3. Market Restrains
- 3.4. Market Trends
- 4. Market Factor Analysis
- 4.1. Porters Five Forces
- 4.2. Supply/Value Chain
- 4.3. PESTEL analysis
- 4.4. Market Entropy
- 4.5. Patent/Trademark Analysis
- 5. Global Anti-Fraud Software Analysis, Insights and Forecast, 2019-2031
- 5.1. Market Analysis, Insights and Forecast - by Application
- 5.1.1. Large Enterprises
- 5.1.2. SMEs
- 5.2. Market Analysis, Insights and Forecast - by Types
- 5.2.1. Cloud-based
- 5.2.2. On-premises
- 5.3. Market Analysis, Insights and Forecast - by Region
- 5.3.1. North America
- 5.3.2. South America
- 5.3.3. Europe
- 5.3.4. Middle East & Africa
- 5.3.5. Asia Pacific
- 5.1. Market Analysis, Insights and Forecast - by Application
- 6. North America Anti-Fraud Software Analysis, Insights and Forecast, 2019-2031
- 6.1. Market Analysis, Insights and Forecast - by Application
- 6.1.1. Large Enterprises
- 6.1.2. SMEs
- 6.2. Market Analysis, Insights and Forecast - by Types
- 6.2.1. Cloud-based
- 6.2.2. On-premises
- 6.1. Market Analysis, Insights and Forecast - by Application
- 7. South America Anti-Fraud Software Analysis, Insights and Forecast, 2019-2031
- 7.1. Market Analysis, Insights and Forecast - by Application
- 7.1.1. Large Enterprises
- 7.1.2. SMEs
- 7.2. Market Analysis, Insights and Forecast - by Types
- 7.2.1. Cloud-based
- 7.2.2. On-premises
- 7.1. Market Analysis, Insights and Forecast - by Application
- 8. Europe Anti-Fraud Software Analysis, Insights and Forecast, 2019-2031
- 8.1. Market Analysis, Insights and Forecast - by Application
- 8.1.1. Large Enterprises
- 8.1.2. SMEs
- 8.2. Market Analysis, Insights and Forecast - by Types
- 8.2.1. Cloud-based
- 8.2.2. On-premises
- 8.1. Market Analysis, Insights and Forecast - by Application
- 9. Middle East & Africa Anti-Fraud Software Analysis, Insights and Forecast, 2019-2031
- 9.1. Market Analysis, Insights and Forecast - by Application
- 9.1.1. Large Enterprises
- 9.1.2. SMEs
- 9.2. Market Analysis, Insights and Forecast - by Types
- 9.2.1. Cloud-based
- 9.2.2. On-premises
- 9.1. Market Analysis, Insights and Forecast - by Application
- 10. Asia Pacific Anti-Fraud Software Analysis, Insights and Forecast, 2019-2031
- 10.1. Market Analysis, Insights and Forecast - by Application
- 10.1.1. Large Enterprises
- 10.1.2. SMEs
- 10.2. Market Analysis, Insights and Forecast - by Types
- 10.2.1. Cloud-based
- 10.2.2. On-premises
- 10.1. Market Analysis, Insights and Forecast - by Application
- 11. Competitive Analysis
- 11.1. Global Market Share Analysis 2024
- 11.2. Company Profiles
- 11.2.1 DataWalk
- 11.2.1.1. Overview
- 11.2.1.2. Products
- 11.2.1.3. SWOT Analysis
- 11.2.1.4. Recent Developments
- 11.2.1.5. Financials (Based on Availability)
- 11.2.2 IBM
- 11.2.2.1. Overview
- 11.2.2.2. Products
- 11.2.2.3. SWOT Analysis
- 11.2.2.4. Recent Developments
- 11.2.2.5. Financials (Based on Availability)
- 11.2.3 NetGuardians
- 11.2.3.1. Overview
- 11.2.3.2. Products
- 11.2.3.3. SWOT Analysis
- 11.2.3.4. Recent Developments
- 11.2.3.5. Financials (Based on Availability)
- 11.2.4 Sumsub
- 11.2.4.1. Overview
- 11.2.4.2. Products
- 11.2.4.3. SWOT Analysis
- 11.2.4.4. Recent Developments
- 11.2.4.5. Financials (Based on Availability)
- 11.2.5 SAS
- 11.2.5.1. Overview
- 11.2.5.2. Products
- 11.2.5.3. SWOT Analysis
- 11.2.5.4. Recent Developments
- 11.2.5.5. Financials (Based on Availability)
- 11.2.6 AltexSoft
- 11.2.6.1. Overview
- 11.2.6.2. Products
- 11.2.6.3. SWOT Analysis
- 11.2.6.4. Recent Developments
- 11.2.6.5. Financials (Based on Availability)
- 11.2.7 Opticks
- 11.2.7.1. Overview
- 11.2.7.2. Products
- 11.2.7.3. SWOT Analysis
- 11.2.7.4. Recent Developments
- 11.2.7.5. Financials (Based on Availability)
- 11.2.8 Softprom
- 11.2.8.1. Overview
- 11.2.8.2. Products
- 11.2.8.3. SWOT Analysis
- 11.2.8.4. Recent Developments
- 11.2.8.5. Financials (Based on Availability)
- 11.2.9 Covery
- 11.2.9.1. Overview
- 11.2.9.2. Products
- 11.2.9.3. SWOT Analysis
- 11.2.9.4. Recent Developments
- 11.2.9.5. Financials (Based on Availability)
- 11.2.10 Signifyd
- 11.2.10.1. Overview
- 11.2.10.2. Products
- 11.2.10.3. SWOT Analysis
- 11.2.10.4. Recent Developments
- 11.2.10.5. Financials (Based on Availability)
- 11.2.11 Nethone
- 11.2.11.1. Overview
- 11.2.11.2. Products
- 11.2.11.3. SWOT Analysis
- 11.2.11.4. Recent Developments
- 11.2.11.5. Financials (Based on Availability)
- 11.2.12 Nuance
- 11.2.12.1. Overview
- 11.2.12.2. Products
- 11.2.12.3. SWOT Analysis
- 11.2.12.4. Recent Developments
- 11.2.12.5. Financials (Based on Availability)
- 11.2.13 FRISS
- 11.2.13.1. Overview
- 11.2.13.2. Products
- 11.2.13.3. SWOT Analysis
- 11.2.13.4. Recent Developments
- 11.2.13.5. Financials (Based on Availability)
- 11.2.14 Pindrop
- 11.2.14.1. Overview
- 11.2.14.2. Products
- 11.2.14.3. SWOT Analysis
- 11.2.14.4. Recent Developments
- 11.2.14.5. Financials (Based on Availability)
- 11.2.15 Quantexa
- 11.2.15.1. Overview
- 11.2.15.2. Products
- 11.2.15.3. SWOT Analysis
- 11.2.15.4. Recent Developments
- 11.2.15.5. Financials (Based on Availability)
- 11.2.16 Splunk
- 11.2.16.1. Overview
- 11.2.16.2. Products
- 11.2.16.3. SWOT Analysis
- 11.2.16.4. Recent Developments
- 11.2.16.5. Financials (Based on Availability)
- 11.2.17 NICE Actimize
- 11.2.17.1. Overview
- 11.2.17.2. Products
- 11.2.17.3. SWOT Analysis
- 11.2.17.4. Recent Developments
- 11.2.17.5. Financials (Based on Availability)
- 11.2.18 Fraud.net
- 11.2.18.1. Overview
- 11.2.18.2. Products
- 11.2.18.3. SWOT Analysis
- 11.2.18.4. Recent Developments
- 11.2.18.5. Financials (Based on Availability)
- 11.2.19 Diligent
- 11.2.19.1. Overview
- 11.2.19.2. Products
- 11.2.19.3. SWOT Analysis
- 11.2.19.4. Recent Developments
- 11.2.19.5. Financials (Based on Availability)
- 11.2.20 Forter
- 11.2.20.1. Overview
- 11.2.20.2. Products
- 11.2.20.3. SWOT Analysis
- 11.2.20.4. Recent Developments
- 11.2.20.5. Financials (Based on Availability)
- 11.2.21 Riskified
- 11.2.21.1. Overview
- 11.2.21.2. Products
- 11.2.21.3. SWOT Analysis
- 11.2.21.4. Recent Developments
- 11.2.21.5. Financials (Based on Availability)
- 11.2.22 SEON
- 11.2.22.1. Overview
- 11.2.22.2. Products
- 11.2.22.3. SWOT Analysis
- 11.2.22.4. Recent Developments
- 11.2.22.5. Financials (Based on Availability)
- 11.2.23 Sift
- 11.2.23.1. Overview
- 11.2.23.2. Products
- 11.2.23.3. SWOT Analysis
- 11.2.23.4. Recent Developments
- 11.2.23.5. Financials (Based on Availability)
- 11.2.24 AWS
- 11.2.24.1. Overview
- 11.2.24.2. Products
- 11.2.24.3. SWOT Analysis
- 11.2.24.4. Recent Developments
- 11.2.24.5. Financials (Based on Availability)
- 11.2.1 DataWalk
List of Figures
- Figure 1: Global Anti-Fraud Software Revenue Breakdown (million, %) by Region 2024 & 2032
- Figure 2: North America Anti-Fraud Software Revenue (million), by Application 2024 & 2032
- Figure 3: North America Anti-Fraud Software Revenue Share (%), by Application 2024 & 2032
- Figure 4: North America Anti-Fraud Software Revenue (million), by Types 2024 & 2032
- Figure 5: North America Anti-Fraud Software Revenue Share (%), by Types 2024 & 2032
- Figure 6: North America Anti-Fraud Software Revenue (million), by Country 2024 & 2032
- Figure 7: North America Anti-Fraud Software Revenue Share (%), by Country 2024 & 2032
- Figure 8: South America Anti-Fraud Software Revenue (million), by Application 2024 & 2032
- Figure 9: South America Anti-Fraud Software Revenue Share (%), by Application 2024 & 2032
- Figure 10: South America Anti-Fraud Software Revenue (million), by Types 2024 & 2032
- Figure 11: South America Anti-Fraud Software Revenue Share (%), by Types 2024 & 2032
- Figure 12: South America Anti-Fraud Software Revenue (million), by Country 2024 & 2032
- Figure 13: South America Anti-Fraud Software Revenue Share (%), by Country 2024 & 2032
- Figure 14: Europe Anti-Fraud Software Revenue (million), by Application 2024 & 2032
- Figure 15: Europe Anti-Fraud Software Revenue Share (%), by Application 2024 & 2032
- Figure 16: Europe Anti-Fraud Software Revenue (million), by Types 2024 & 2032
- Figure 17: Europe Anti-Fraud Software Revenue Share (%), by Types 2024 & 2032
- Figure 18: Europe Anti-Fraud Software Revenue (million), by Country 2024 & 2032
- Figure 19: Europe Anti-Fraud Software Revenue Share (%), by Country 2024 & 2032
- Figure 20: Middle East & Africa Anti-Fraud Software Revenue (million), by Application 2024 & 2032
- Figure 21: Middle East & Africa Anti-Fraud Software Revenue Share (%), by Application 2024 & 2032
- Figure 22: Middle East & Africa Anti-Fraud Software Revenue (million), by Types 2024 & 2032
- Figure 23: Middle East & Africa Anti-Fraud Software Revenue Share (%), by Types 2024 & 2032
- Figure 24: Middle East & Africa Anti-Fraud Software Revenue (million), by Country 2024 & 2032
- Figure 25: Middle East & Africa Anti-Fraud Software Revenue Share (%), by Country 2024 & 2032
- Figure 26: Asia Pacific Anti-Fraud Software Revenue (million), by Application 2024 & 2032
- Figure 27: Asia Pacific Anti-Fraud Software Revenue Share (%), by Application 2024 & 2032
- Figure 28: Asia Pacific Anti-Fraud Software Revenue (million), by Types 2024 & 2032
- Figure 29: Asia Pacific Anti-Fraud Software Revenue Share (%), by Types 2024 & 2032
- Figure 30: Asia Pacific Anti-Fraud Software Revenue (million), by Country 2024 & 2032
- Figure 31: Asia Pacific Anti-Fraud Software Revenue Share (%), by Country 2024 & 2032
List of Tables
- Table 1: Global Anti-Fraud Software Revenue million Forecast, by Region 2019 & 2032
- Table 2: Global Anti-Fraud Software Revenue million Forecast, by Application 2019 & 2032
- Table 3: Global Anti-Fraud Software Revenue million Forecast, by Types 2019 & 2032
- Table 4: Global Anti-Fraud Software Revenue million Forecast, by Region 2019 & 2032
- Table 5: Global Anti-Fraud Software Revenue million Forecast, by Application 2019 & 2032
- Table 6: Global Anti-Fraud Software Revenue million Forecast, by Types 2019 & 2032
- Table 7: Global Anti-Fraud Software Revenue million Forecast, by Country 2019 & 2032
- Table 8: United States Anti-Fraud Software Revenue (million) Forecast, by Application 2019 & 2032
- Table 9: Canada Anti-Fraud Software Revenue (million) Forecast, by Application 2019 & 2032
- Table 10: Mexico Anti-Fraud Software Revenue (million) Forecast, by Application 2019 & 2032
- Table 11: Global Anti-Fraud Software Revenue million Forecast, by Application 2019 & 2032
- Table 12: Global Anti-Fraud Software Revenue million Forecast, by Types 2019 & 2032
- Table 13: Global Anti-Fraud Software Revenue million Forecast, by Country 2019 & 2032
- Table 14: Brazil Anti-Fraud Software Revenue (million) Forecast, by Application 2019 & 2032
- Table 15: Argentina Anti-Fraud Software Revenue (million) Forecast, by Application 2019 & 2032
- Table 16: Rest of South America Anti-Fraud Software Revenue (million) Forecast, by Application 2019 & 2032
- Table 17: Global Anti-Fraud Software Revenue million Forecast, by Application 2019 & 2032
- Table 18: Global Anti-Fraud Software Revenue million Forecast, by Types 2019 & 2032
- Table 19: Global Anti-Fraud Software Revenue million Forecast, by Country 2019 & 2032
- Table 20: United Kingdom Anti-Fraud Software Revenue (million) Forecast, by Application 2019 & 2032
- Table 21: Germany Anti-Fraud Software Revenue (million) Forecast, by Application 2019 & 2032
- Table 22: France Anti-Fraud Software Revenue (million) Forecast, by Application 2019 & 2032
- Table 23: Italy Anti-Fraud Software Revenue (million) Forecast, by Application 2019 & 2032
- Table 24: Spain Anti-Fraud Software Revenue (million) Forecast, by Application 2019 & 2032
- Table 25: Russia Anti-Fraud Software Revenue (million) Forecast, by Application 2019 & 2032
- Table 26: Benelux Anti-Fraud Software Revenue (million) Forecast, by Application 2019 & 2032
- Table 27: Nordics Anti-Fraud Software Revenue (million) Forecast, by Application 2019 & 2032
- Table 28: Rest of Europe Anti-Fraud Software Revenue (million) Forecast, by Application 2019 & 2032
- Table 29: Global Anti-Fraud Software Revenue million Forecast, by Application 2019 & 2032
- Table 30: Global Anti-Fraud Software Revenue million Forecast, by Types 2019 & 2032
- Table 31: Global Anti-Fraud Software Revenue million Forecast, by Country 2019 & 2032
- Table 32: Turkey Anti-Fraud Software Revenue (million) Forecast, by Application 2019 & 2032
- Table 33: Israel Anti-Fraud Software Revenue (million) Forecast, by Application 2019 & 2032
- Table 34: GCC Anti-Fraud Software Revenue (million) Forecast, by Application 2019 & 2032
- Table 35: North Africa Anti-Fraud Software Revenue (million) Forecast, by Application 2019 & 2032
- Table 36: South Africa Anti-Fraud Software Revenue (million) Forecast, by Application 2019 & 2032
- Table 37: Rest of Middle East & Africa Anti-Fraud Software Revenue (million) Forecast, by Application 2019 & 2032
- Table 38: Global Anti-Fraud Software Revenue million Forecast, by Application 2019 & 2032
- Table 39: Global Anti-Fraud Software Revenue million Forecast, by Types 2019 & 2032
- Table 40: Global Anti-Fraud Software Revenue million Forecast, by Country 2019 & 2032
- Table 41: China Anti-Fraud Software Revenue (million) Forecast, by Application 2019 & 2032
- Table 42: India Anti-Fraud Software Revenue (million) Forecast, by Application 2019 & 2032
- Table 43: Japan Anti-Fraud Software Revenue (million) Forecast, by Application 2019 & 2032
- Table 44: South Korea Anti-Fraud Software Revenue (million) Forecast, by Application 2019 & 2032
- Table 45: ASEAN Anti-Fraud Software Revenue (million) Forecast, by Application 2019 & 2032
- Table 46: Oceania Anti-Fraud Software Revenue (million) Forecast, by Application 2019 & 2032
- Table 47: Rest of Asia Pacific Anti-Fraud Software Revenue (million) Forecast, by Application 2019 & 2032
Frequently Asked Questions
1. What is the projected Compound Annual Growth Rate (CAGR) of the Anti-Fraud Software?
The projected CAGR is approximately XX%.
2. Which companies are prominent players in the Anti-Fraud Software?
Key companies in the market include DataWalk, IBM, NetGuardians, Sumsub, SAS, AltexSoft, Opticks, Softprom, Covery, Signifyd, Nethone, Nuance, FRISS, Pindrop, Quantexa, Splunk, NICE Actimize, Fraud.net, Diligent, Forter, Riskified, SEON, Sift, AWS.
3. What are the main segments of the Anti-Fraud Software?
The market segments include Application, Types.
4. Can you provide details about the market size?
The market size is estimated to be USD XXX million as of 2022.
5. What are some drivers contributing to market growth?
N/A
6. What are the notable trends driving market growth?
N/A
7. Are there any restraints impacting market growth?
N/A
8. Can you provide examples of recent developments in the market?
N/A
9. What pricing options are available for accessing the report?
Pricing options include single-user, multi-user, and enterprise licenses priced at USD 2900.00, USD 4350.00, and USD 5800.00 respectively.
10. Is the market size provided in terms of value or volume?
The market size is provided in terms of value, measured in million.
11. Are there any specific market keywords associated with the report?
Yes, the market keyword associated with the report is "Anti-Fraud Software," which aids in identifying and referencing the specific market segment covered.
12. How do I determine which pricing option suits my needs best?
The pricing options vary based on user requirements and access needs. Individual users may opt for single-user licenses, while businesses requiring broader access may choose multi-user or enterprise licenses for cost-effective access to the report.
13. Are there any additional resources or data provided in the Anti-Fraud Software report?
While the report offers comprehensive insights, it's advisable to review the specific contents or supplementary materials provided to ascertain if additional resources or data are available.
14. How can I stay updated on further developments or reports in the Anti-Fraud Software?
To stay informed about further developments, trends, and reports in the Anti-Fraud Software, consider subscribing to industry newsletters, following relevant companies and organizations, or regularly checking reputable industry news sources and publications.
Methodology
Step 1 - Identification of Relevant Samples Size from Population Database


Step 2 - Approaches for Defining Global Market Size (Value, Volume* & Price*)

Note*: In applicable scenarios
Step 3 - Data Sources
Primary Research
- Web Analytics
- Survey Reports
- Research Institute
- Latest Research Reports
- Opinion Leaders
Secondary Research
- Annual Reports
- White Paper
- Latest Press Release
- Industry Association
- Paid Database
- Investor Presentations

Step 4 - Data Triangulation
Involves using different sources of information in order to increase the validity of a study
These sources are likely to be stakeholders in a program - participants, other researchers, program staff, other community members, and so on.
Then we put all data in single framework & apply various statistical tools to find out the dynamic on the market.
During the analysis stage, feedback from the stakeholder groups would be compared to determine areas of agreement as well as areas of divergence


