
Key Insights
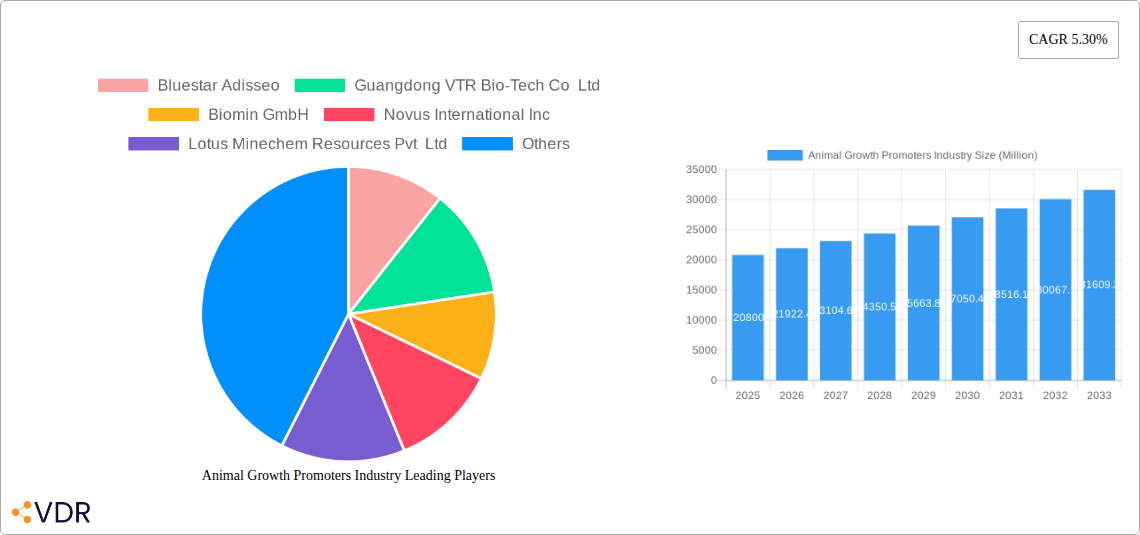
The global animal growth promoters market, valued at $20.80 billion in 2025, is projected to experience robust growth, driven by increasing global meat consumption and the rising demand for efficient and sustainable livestock production. The market's Compound Annual Growth Rate (CAGR) of 5.30% from 2025 to 2033 signifies a substantial expansion, fueled by several key factors. Technological advancements in feed formulation and the growing adoption of precision livestock farming are enhancing the efficacy and profitability of animal growth promoters. Furthermore, the increasing awareness among farmers regarding the benefits of improved animal health and productivity, coupled with stricter regulations surrounding antibiotic use in animal feed, are creating significant opportunities for alternative growth promoters such as probiotics, prebiotics, and phytogenics. The ruminant segment currently dominates the market due to its substantial livestock population, but the poultry and swine segments are anticipated to witness significant growth owing to the rising global demand for poultry and pork products. Geographically, North America and Europe currently hold significant market shares, driven by established livestock industries and high adoption rates of advanced technologies. However, the Asia-Pacific region is expected to emerge as a key growth driver in the coming years due to the expanding livestock sector and increasing consumer disposable income in developing economies. Competition among established players like Bluestar Adisseo, Biomin GmbH, and Cargill Inc. is intense, with ongoing innovation and strategic partnerships shaping the market landscape.
The market's growth is not without challenges. Fluctuations in raw material prices, stringent regulatory frameworks regarding the safety and efficacy of growth promoters, and potential environmental concerns associated with certain product types pose potential restraints. However, continuous research and development efforts aimed at developing more sustainable and environmentally friendly animal growth promoters are expected to mitigate these challenges. The market segmentation across animal types (ruminant, poultry, swine, aquaculture) and product types (probiotics, prebiotics, phytogenics, acidifiers) offers diverse avenues for growth, allowing companies to tailor their strategies to specific market needs and capitalize on emerging trends. The market's future trajectory suggests continued expansion, driven by a confluence of technological innovation, evolving consumer preferences, and the need for improved livestock productivity in the face of a growing global population.
Animal Growth Promoters Industry Market Report: 2019-2033
This comprehensive report provides an in-depth analysis of the Animal Growth Promoters (AGP) industry, encompassing market dynamics, growth trends, regional performance, product landscape, and key players. The study period covers 2019-2033, with 2025 as the base and estimated year. The report segments the market by animal type (ruminant, poultry, swine, aquaculture, other) and product type (probiotics, prebiotics, phytogenics, acidifiers, other), offering a granular understanding of this vital sector. The report projects a market value of XX Million by 2033.
Animal Growth Promoters Industry Market Dynamics & Structure
The global animal growth promoters market is characterized by moderate concentration, with key players such as Bluestar Adisseo, Novus International Inc, and DSM holding significant market share. The market's structure is influenced by technological innovations, stringent regulatory frameworks governing AGP usage, and the emergence of competitive product substitutes. End-user demographics, particularly the increasing demand for animal protein globally, significantly impact market growth. M&A activity in the sector is moderate, with approximately XX deals recorded between 2019 and 2024, primarily driven by companies seeking to expand their product portfolios and geographic reach.
- Market Concentration: Moderately concentrated, with top 5 players holding approximately XX% market share in 2024.
- Technological Innovation: Focus on developing sustainable and efficacious AGPs, including precision fermentation and advanced delivery systems.
- Regulatory Frameworks: Stringent regulations regarding antibiotic use and the growing emphasis on natural alternatives are reshaping the market landscape.
- Competitive Substitutes: Increasing adoption of feed additives and alternative growth promotion strategies.
- End-User Demographics: Growing global population and rising demand for animal protein fuels market growth.
- M&A Trends: Moderate level of M&A activity, primarily driven by expansion and diversification strategies.
Animal Growth Promoters Industry Growth Trends & Insights
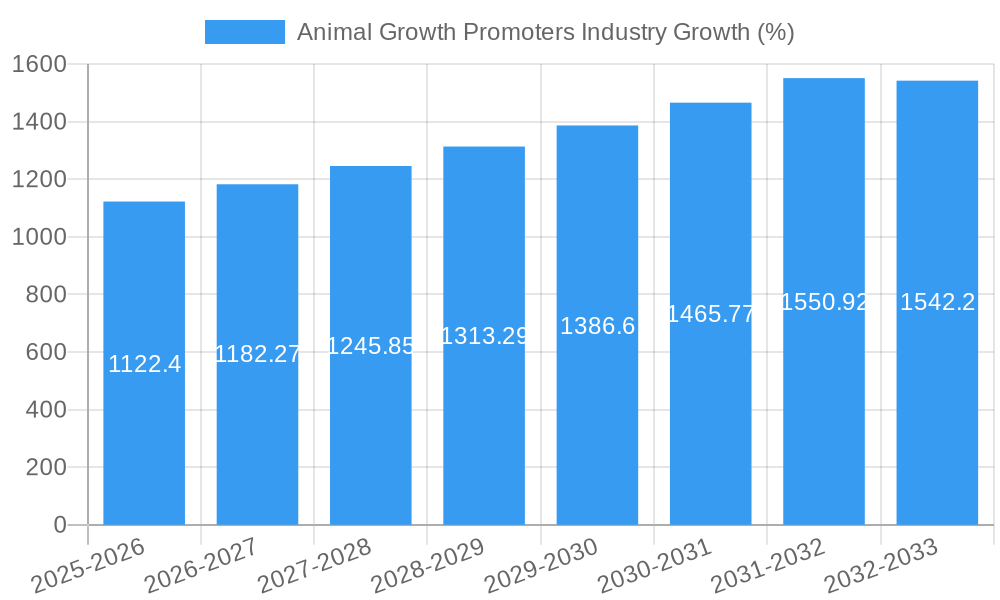
The animal growth promoters market experienced a CAGR of XX% during the historical period (2019-2024), driven by factors such as increasing livestock production, rising consumer demand for meat and dairy products, and the adoption of advanced feeding technologies. Technological disruptions, including the development of novel AGPs with enhanced efficacy and safety profiles, significantly contributed to market expansion. Consumer preference shifts towards sustainably produced animal products are creating new opportunities for AGP manufacturers. We project a CAGR of XX% for the forecast period (2025-2033), reaching a market value of XX million by 2033. Market penetration in developing economies is expected to increase, further fueling market expansion.
Dominant Regions, Countries, or Segments in Animal Growth Promoters Industry
The poultry segment dominates the animal growth promoters market, accounting for approximately XX% of the total market value in 2024, driven by high poultry consumption and intensive farming practices. North America and Europe are currently leading regional markets, but Asia-Pacific is exhibiting significant growth potential due to rapid expansion in livestock production.
- Dominant Animal Type: Poultry (XX%), followed by Swine (XX%) and Ruminant (XX%).
- Dominant Product Type: Probiotics (XX%), followed by Acidifiers (XX%) and Prebiotics (XX%).
- Key Regional Drivers:
- North America: High livestock production, stringent regulations, and strong consumer demand.
- Europe: Focus on sustainable agriculture and increasing adoption of natural alternatives.
- Asia-Pacific: Rapid growth in livestock farming and increasing disposable incomes.
Animal Growth Promoters Industry Product Landscape
The AGP market offers a diverse range of products, each with unique applications and performance characteristics. Innovations focus on enhancing efficacy, reducing environmental impact, and improving animal welfare. Advances in prebiotic and probiotic formulations are gaining traction, driven by the growing preference for natural alternatives to antibiotics. Companies are focusing on developing customized solutions for specific animal types and farming systems, offering improved performance metrics and cost-effectiveness.
Key Drivers, Barriers & Challenges in Animal Growth Promoters Industry
Key Drivers:
- Increasing global meat and dairy consumption.
- Growing demand for efficient and sustainable livestock production.
- Technological advancements in AGP development.
- Favorable government policies promoting livestock farming.
Key Challenges:
- Stringent regulatory frameworks and restrictions on antibiotic use.
- Concerns regarding antibiotic resistance and consumer preference for natural products.
- Fluctuations in raw material prices and supply chain disruptions.
- Intense competition and price pressure from various players. The industry faces an estimated XX% loss in revenue due to these supply chain issues in 2024.
Emerging Opportunities in Animal Growth Promoters Industry
Emerging opportunities lie in the development of novel AGPs with enhanced efficacy and safety profiles, including precision fermentation-based products. Untapped markets in developing economies present significant growth potential. There is also increasing demand for customized solutions tailored to specific animal species and farming systems. Evolving consumer preferences towards sustainable and ethically produced animal products offer further opportunities for innovative AGP manufacturers.
Growth Accelerators in the Animal Growth Promoters Industry Industry
Long-term growth will be accelerated by technological breakthroughs, strategic partnerships between AGP manufacturers and livestock producers, and market expansion into emerging economies. Increased investment in research and development, coupled with a focus on sustainable and environmentally friendly AGPs, will further drive market expansion.
Key Players Shaping the Animal Growth Promoters Industry Market
- Bluestar Adisseo
- Guangdong VTR Bio-Tech Co Ltd
- Biomin GmbH
- Novus International Inc
- Lotus Minechem Resources Pvt Ltd
- Kemin Industries
- Chr Hansen A/S
- BASF SE
- DSM
- Alltech Inc
- Dupont De Nemours Inc
- Cargill Inc
- Novozymes A/S
- Elanco Animal Health Incorporated
- Zoetis Inc
Notable Milestones in Animal Growth Promoters Industry Sector
- 2021: Launch of a novel probiotic blend by Chr. Hansen.
- 2022: Acquisition of a smaller AGP company by DSM.
- 2023: Introduction of a new phytogenic feed additive by Kemin Industries.
- 2024: Publication of significant research validating the efficacy of a new prebiotic.
In-Depth Animal Growth Promoters Industry Market Outlook
The future of the animal growth promoters market is promising, driven by consistent growth in global meat and dairy consumption and the continued development of innovative and sustainable AGPs. Strategic partnerships, focused R&D, and market penetration into emerging economies present substantial opportunities for established and emerging players. The market is poised for robust growth in the coming decade, driven by both technological innovation and increasing demand from a growing global population.
Animal Growth Promoters Industry Segmentation
-
1. Type
- 1.1. Probiotics
- 1.2. Prebiotics
- 1.3. Phytogenics
- 1.4. Acidifiers
- 1.5. Other Types
-
2. Animal Type
- 2.1. Ruminant
- 2.2. Poultry
- 2.3. Swine
- 2.4. Aquaculture
- 2.5. Other Animal Types
Animal Growth Promoters Industry Segmentation By Geography
-
1. North America
- 1.1. United States
- 1.2. Canada
- 1.3. Mexico
- 1.4. Rest of North America
-
2. Europe
- 2.1. Germany
- 2.2. United Kingdom
- 2.3. France
- 2.4. Russia
- 2.5. Spain
- 2.6. Rest of Europe
-
3. Asia Pacific
- 3.1. China
- 3.2. Japan
- 3.3. India
- 3.4. Australia
- 3.5. Rest of Asia Pacific
-
4. South America
- 4.1. Brazil
- 4.2. Argentina
- 4.3. Rest of South America
-
5. Africa
- 5.1. South Africa
- 5.2. Rest of Africa

Animal Growth Promoters Industry REPORT HIGHLIGHTS
| Aspects | Details |
|---|---|
| Study Period | 2019-2033 |
| Base Year | 2024 |
| Estimated Year | 2025 |
| Forecast Period | 2025-2033 |
| Historical Period | 2019-2024 |
| Growth Rate | CAGR of 5.30% from 2019-2033 |
| Segmentation |
|
Table of Contents
- 1. Introduction
- 1.1. Research Scope
- 1.2. Market Segmentation
- 1.3. Research Methodology
- 1.4. Definitions and Assumptions
- 2. Executive Summary
- 2.1. Introduction
- 3. Market Dynamics
- 3.1. Introduction
- 3.2. Market Drivers
- 3.2.1. Increased Demand for Meat; Initiatives By the Key Players; Focus on Animal nutrition and Health
- 3.3. Market Restrains
- 3.3.1. Shift Toward Vegan- Based Diet; Changing Raw Material Prices and Strict Government Rules to Restrict Market Growth
- 3.4. Market Trends
- 3.4.1. The Rise in Demand for Meat Boosting the Market
- 4. Market Factor Analysis
- 4.1. Porters Five Forces
- 4.2. Supply/Value Chain
- 4.3. PESTEL analysis
- 4.4. Market Entropy
- 4.5. Patent/Trademark Analysis
- 5. Global Animal Growth Promoters Industry Analysis, Insights and Forecast, 2019-2031
- 5.1. Market Analysis, Insights and Forecast - by Type
- 5.1.1. Probiotics
- 5.1.2. Prebiotics
- 5.1.3. Phytogenics
- 5.1.4. Acidifiers
- 5.1.5. Other Types
- 5.2. Market Analysis, Insights and Forecast - by Animal Type
- 5.2.1. Ruminant
- 5.2.2. Poultry
- 5.2.3. Swine
- 5.2.4. Aquaculture
- 5.2.5. Other Animal Types
- 5.3. Market Analysis, Insights and Forecast - by Region
- 5.3.1. North America
- 5.3.2. Europe
- 5.3.3. Asia Pacific
- 5.3.4. South America
- 5.3.5. Africa
- 5.1. Market Analysis, Insights and Forecast - by Type
- 6. North America Animal Growth Promoters Industry Analysis, Insights and Forecast, 2019-2031
- 6.1. Market Analysis, Insights and Forecast - by Type
- 6.1.1. Probiotics
- 6.1.2. Prebiotics
- 6.1.3. Phytogenics
- 6.1.4. Acidifiers
- 6.1.5. Other Types
- 6.2. Market Analysis, Insights and Forecast - by Animal Type
- 6.2.1. Ruminant
- 6.2.2. Poultry
- 6.2.3. Swine
- 6.2.4. Aquaculture
- 6.2.5. Other Animal Types
- 6.1. Market Analysis, Insights and Forecast - by Type
- 7. Europe Animal Growth Promoters Industry Analysis, Insights and Forecast, 2019-2031
- 7.1. Market Analysis, Insights and Forecast - by Type
- 7.1.1. Probiotics
- 7.1.2. Prebiotics
- 7.1.3. Phytogenics
- 7.1.4. Acidifiers
- 7.1.5. Other Types
- 7.2. Market Analysis, Insights and Forecast - by Animal Type
- 7.2.1. Ruminant
- 7.2.2. Poultry
- 7.2.3. Swine
- 7.2.4. Aquaculture
- 7.2.5. Other Animal Types
- 7.1. Market Analysis, Insights and Forecast - by Type
- 8. Asia Pacific Animal Growth Promoters Industry Analysis, Insights and Forecast, 2019-2031
- 8.1. Market Analysis, Insights and Forecast - by Type
- 8.1.1. Probiotics
- 8.1.2. Prebiotics
- 8.1.3. Phytogenics
- 8.1.4. Acidifiers
- 8.1.5. Other Types
- 8.2. Market Analysis, Insights and Forecast - by Animal Type
- 8.2.1. Ruminant
- 8.2.2. Poultry
- 8.2.3. Swine
- 8.2.4. Aquaculture
- 8.2.5. Other Animal Types
- 8.1. Market Analysis, Insights and Forecast - by Type
- 9. South America Animal Growth Promoters Industry Analysis, Insights and Forecast, 2019-2031
- 9.1. Market Analysis, Insights and Forecast - by Type
- 9.1.1. Probiotics
- 9.1.2. Prebiotics
- 9.1.3. Phytogenics
- 9.1.4. Acidifiers
- 9.1.5. Other Types
- 9.2. Market Analysis, Insights and Forecast - by Animal Type
- 9.2.1. Ruminant
- 9.2.2. Poultry
- 9.2.3. Swine
- 9.2.4. Aquaculture
- 9.2.5. Other Animal Types
- 9.1. Market Analysis, Insights and Forecast - by Type
- 10. Africa Animal Growth Promoters Industry Analysis, Insights and Forecast, 2019-2031
- 10.1. Market Analysis, Insights and Forecast - by Type
- 10.1.1. Probiotics
- 10.1.2. Prebiotics
- 10.1.3. Phytogenics
- 10.1.4. Acidifiers
- 10.1.5. Other Types
- 10.2. Market Analysis, Insights and Forecast - by Animal Type
- 10.2.1. Ruminant
- 10.2.2. Poultry
- 10.2.3. Swine
- 10.2.4. Aquaculture
- 10.2.5. Other Animal Types
- 10.1. Market Analysis, Insights and Forecast - by Type
- 11. North America Animal Growth Promoters Industry Analysis, Insights and Forecast, 2019-2031
- 11.1. Market Analysis, Insights and Forecast - By Country/Sub-region
- 11.1.1 United States
- 11.1.2 Canada
- 11.1.3 Mexico
- 11.1.4 Rest of North America
- 12. Europe Animal Growth Promoters Industry Analysis, Insights and Forecast, 2019-2031
- 12.1. Market Analysis, Insights and Forecast - By Country/Sub-region
- 12.1.1 Germany
- 12.1.2 United Kingdom
- 12.1.3 France
- 12.1.4 Russia
- 12.1.5 Spain
- 12.1.6 Rest of Europe
- 13. Asia Pacific Animal Growth Promoters Industry Analysis, Insights and Forecast, 2019-2031
- 13.1. Market Analysis, Insights and Forecast - By Country/Sub-region
- 13.1.1 China
- 13.1.2 Japan
- 13.1.3 India
- 13.1.4 Australia
- 13.1.5 Rest of Asia Pacific
- 14. South America Animal Growth Promoters Industry Analysis, Insights and Forecast, 2019-2031
- 14.1. Market Analysis, Insights and Forecast - By Country/Sub-region
- 14.1.1 Brazil
- 14.1.2 Argentina
- 14.1.3 Rest of South America
- 15. Africa Animal Growth Promoters Industry Analysis, Insights and Forecast, 2019-2031
- 15.1. Market Analysis, Insights and Forecast - By Country/Sub-region
- 15.1.1 South Africa
- 15.1.2 Rest of Africa
- 16. Competitive Analysis
- 16.1. Global Market Share Analysis 2024
- 16.2. Company Profiles
- 16.2.1 Bluestar Adisseo
- 16.2.1.1. Overview
- 16.2.1.2. Products
- 16.2.1.3. SWOT Analysis
- 16.2.1.4. Recent Developments
- 16.2.1.5. Financials (Based on Availability)
- 16.2.2 Guangdong VTR Bio-Tech Co Ltd
- 16.2.2.1. Overview
- 16.2.2.2. Products
- 16.2.2.3. SWOT Analysis
- 16.2.2.4. Recent Developments
- 16.2.2.5. Financials (Based on Availability)
- 16.2.3 Biomin GmbH
- 16.2.3.1. Overview
- 16.2.3.2. Products
- 16.2.3.3. SWOT Analysis
- 16.2.3.4. Recent Developments
- 16.2.3.5. Financials (Based on Availability)
- 16.2.4 Novus International Inc
- 16.2.4.1. Overview
- 16.2.4.2. Products
- 16.2.4.3. SWOT Analysis
- 16.2.4.4. Recent Developments
- 16.2.4.5. Financials (Based on Availability)
- 16.2.5 Lotus Minechem Resources Pvt Ltd
- 16.2.5.1. Overview
- 16.2.5.2. Products
- 16.2.5.3. SWOT Analysis
- 16.2.5.4. Recent Developments
- 16.2.5.5. Financials (Based on Availability)
- 16.2.6 Kemin Industries
- 16.2.6.1. Overview
- 16.2.6.2. Products
- 16.2.6.3. SWOT Analysis
- 16.2.6.4. Recent Developments
- 16.2.6.5. Financials (Based on Availability)
- 16.2.7 Chr Hansen A/
- 16.2.7.1. Overview
- 16.2.7.2. Products
- 16.2.7.3. SWOT Analysis
- 16.2.7.4. Recent Developments
- 16.2.7.5. Financials (Based on Availability)
- 16.2.8 BASF SE
- 16.2.8.1. Overview
- 16.2.8.2. Products
- 16.2.8.3. SWOT Analysis
- 16.2.8.4. Recent Developments
- 16.2.8.5. Financials (Based on Availability)
- 16.2.9 DSM
- 16.2.9.1. Overview
- 16.2.9.2. Products
- 16.2.9.3. SWOT Analysis
- 16.2.9.4. Recent Developments
- 16.2.9.5. Financials (Based on Availability)
- 16.2.10 Alltech Inc
- 16.2.10.1. Overview
- 16.2.10.2. Products
- 16.2.10.3. SWOT Analysis
- 16.2.10.4. Recent Developments
- 16.2.10.5. Financials (Based on Availability)
- 16.2.11 Dupont De Nemours Inc
- 16.2.11.1. Overview
- 16.2.11.2. Products
- 16.2.11.3. SWOT Analysis
- 16.2.11.4. Recent Developments
- 16.2.11.5. Financials (Based on Availability)
- 16.2.12 Cargill Inc
- 16.2.12.1. Overview
- 16.2.12.2. Products
- 16.2.12.3. SWOT Analysis
- 16.2.12.4. Recent Developments
- 16.2.12.5. Financials (Based on Availability)
- 16.2.13 Novozymes A/S
- 16.2.13.1. Overview
- 16.2.13.2. Products
- 16.2.13.3. SWOT Analysis
- 16.2.13.4. Recent Developments
- 16.2.13.5. Financials (Based on Availability)
- 16.2.14 Elanco Animal Health Incorporated
- 16.2.14.1. Overview
- 16.2.14.2. Products
- 16.2.14.3. SWOT Analysis
- 16.2.14.4. Recent Developments
- 16.2.14.5. Financials (Based on Availability)
- 16.2.15 Zoetis Inc
- 16.2.15.1. Overview
- 16.2.15.2. Products
- 16.2.15.3. SWOT Analysis
- 16.2.15.4. Recent Developments
- 16.2.15.5. Financials (Based on Availability)
- 16.2.1 Bluestar Adisseo
List of Figures
- Figure 1: Global Animal Growth Promoters Industry Revenue Breakdown (Million, %) by Region 2024 & 2032
- Figure 2: North America Animal Growth Promoters Industry Revenue (Million), by Country 2024 & 2032
- Figure 3: North America Animal Growth Promoters Industry Revenue Share (%), by Country 2024 & 2032
- Figure 4: Europe Animal Growth Promoters Industry Revenue (Million), by Country 2024 & 2032
- Figure 5: Europe Animal Growth Promoters Industry Revenue Share (%), by Country 2024 & 2032
- Figure 6: Asia Pacific Animal Growth Promoters Industry Revenue (Million), by Country 2024 & 2032
- Figure 7: Asia Pacific Animal Growth Promoters Industry Revenue Share (%), by Country 2024 & 2032
- Figure 8: South America Animal Growth Promoters Industry Revenue (Million), by Country 2024 & 2032
- Figure 9: South America Animal Growth Promoters Industry Revenue Share (%), by Country 2024 & 2032
- Figure 10: Africa Animal Growth Promoters Industry Revenue (Million), by Country 2024 & 2032
- Figure 11: Africa Animal Growth Promoters Industry Revenue Share (%), by Country 2024 & 2032
- Figure 12: North America Animal Growth Promoters Industry Revenue (Million), by Type 2024 & 2032
- Figure 13: North America Animal Growth Promoters Industry Revenue Share (%), by Type 2024 & 2032
- Figure 14: North America Animal Growth Promoters Industry Revenue (Million), by Animal Type 2024 & 2032
- Figure 15: North America Animal Growth Promoters Industry Revenue Share (%), by Animal Type 2024 & 2032
- Figure 16: North America Animal Growth Promoters Industry Revenue (Million), by Country 2024 & 2032
- Figure 17: North America Animal Growth Promoters Industry Revenue Share (%), by Country 2024 & 2032
- Figure 18: Europe Animal Growth Promoters Industry Revenue (Million), by Type 2024 & 2032
- Figure 19: Europe Animal Growth Promoters Industry Revenue Share (%), by Type 2024 & 2032
- Figure 20: Europe Animal Growth Promoters Industry Revenue (Million), by Animal Type 2024 & 2032
- Figure 21: Europe Animal Growth Promoters Industry Revenue Share (%), by Animal Type 2024 & 2032
- Figure 22: Europe Animal Growth Promoters Industry Revenue (Million), by Country 2024 & 2032
- Figure 23: Europe Animal Growth Promoters Industry Revenue Share (%), by Country 2024 & 2032
- Figure 24: Asia Pacific Animal Growth Promoters Industry Revenue (Million), by Type 2024 & 2032
- Figure 25: Asia Pacific Animal Growth Promoters Industry Revenue Share (%), by Type 2024 & 2032
- Figure 26: Asia Pacific Animal Growth Promoters Industry Revenue (Million), by Animal Type 2024 & 2032
- Figure 27: Asia Pacific Animal Growth Promoters Industry Revenue Share (%), by Animal Type 2024 & 2032
- Figure 28: Asia Pacific Animal Growth Promoters Industry Revenue (Million), by Country 2024 & 2032
- Figure 29: Asia Pacific Animal Growth Promoters Industry Revenue Share (%), by Country 2024 & 2032
- Figure 30: South America Animal Growth Promoters Industry Revenue (Million), by Type 2024 & 2032
- Figure 31: South America Animal Growth Promoters Industry Revenue Share (%), by Type 2024 & 2032
- Figure 32: South America Animal Growth Promoters Industry Revenue (Million), by Animal Type 2024 & 2032
- Figure 33: South America Animal Growth Promoters Industry Revenue Share (%), by Animal Type 2024 & 2032
- Figure 34: South America Animal Growth Promoters Industry Revenue (Million), by Country 2024 & 2032
- Figure 35: South America Animal Growth Promoters Industry Revenue Share (%), by Country 2024 & 2032
- Figure 36: Africa Animal Growth Promoters Industry Revenue (Million), by Type 2024 & 2032
- Figure 37: Africa Animal Growth Promoters Industry Revenue Share (%), by Type 2024 & 2032
- Figure 38: Africa Animal Growth Promoters Industry Revenue (Million), by Animal Type 2024 & 2032
- Figure 39: Africa Animal Growth Promoters Industry Revenue Share (%), by Animal Type 2024 & 2032
- Figure 40: Africa Animal Growth Promoters Industry Revenue (Million), by Country 2024 & 2032
- Figure 41: Africa Animal Growth Promoters Industry Revenue Share (%), by Country 2024 & 2032
List of Tables
- Table 1: Global Animal Growth Promoters Industry Revenue Million Forecast, by Region 2019 & 2032
- Table 2: Global Animal Growth Promoters Industry Revenue Million Forecast, by Type 2019 & 2032
- Table 3: Global Animal Growth Promoters Industry Revenue Million Forecast, by Animal Type 2019 & 2032
- Table 4: Global Animal Growth Promoters Industry Revenue Million Forecast, by Region 2019 & 2032
- Table 5: Global Animal Growth Promoters Industry Revenue Million Forecast, by Country 2019 & 2032
- Table 6: United States Animal Growth Promoters Industry Revenue (Million) Forecast, by Application 2019 & 2032
- Table 7: Canada Animal Growth Promoters Industry Revenue (Million) Forecast, by Application 2019 & 2032
- Table 8: Mexico Animal Growth Promoters Industry Revenue (Million) Forecast, by Application 2019 & 2032
- Table 9: Rest of North America Animal Growth Promoters Industry Revenue (Million) Forecast, by Application 2019 & 2032
- Table 10: Global Animal Growth Promoters Industry Revenue Million Forecast, by Country 2019 & 2032
- Table 11: Germany Animal Growth Promoters Industry Revenue (Million) Forecast, by Application 2019 & 2032
- Table 12: United Kingdom Animal Growth Promoters Industry Revenue (Million) Forecast, by Application 2019 & 2032
- Table 13: France Animal Growth Promoters Industry Revenue (Million) Forecast, by Application 2019 & 2032
- Table 14: Russia Animal Growth Promoters Industry Revenue (Million) Forecast, by Application 2019 & 2032
- Table 15: Spain Animal Growth Promoters Industry Revenue (Million) Forecast, by Application 2019 & 2032
- Table 16: Rest of Europe Animal Growth Promoters Industry Revenue (Million) Forecast, by Application 2019 & 2032
- Table 17: Global Animal Growth Promoters Industry Revenue Million Forecast, by Country 2019 & 2032
- Table 18: China Animal Growth Promoters Industry Revenue (Million) Forecast, by Application 2019 & 2032
- Table 19: Japan Animal Growth Promoters Industry Revenue (Million) Forecast, by Application 2019 & 2032
- Table 20: India Animal Growth Promoters Industry Revenue (Million) Forecast, by Application 2019 & 2032
- Table 21: Australia Animal Growth Promoters Industry Revenue (Million) Forecast, by Application 2019 & 2032
- Table 22: Rest of Asia Pacific Animal Growth Promoters Industry Revenue (Million) Forecast, by Application 2019 & 2032
- Table 23: Global Animal Growth Promoters Industry Revenue Million Forecast, by Country 2019 & 2032
- Table 24: Brazil Animal Growth Promoters Industry Revenue (Million) Forecast, by Application 2019 & 2032
- Table 25: Argentina Animal Growth Promoters Industry Revenue (Million) Forecast, by Application 2019 & 2032
- Table 26: Rest of South America Animal Growth Promoters Industry Revenue (Million) Forecast, by Application 2019 & 2032
- Table 27: Global Animal Growth Promoters Industry Revenue Million Forecast, by Country 2019 & 2032
- Table 28: South Africa Animal Growth Promoters Industry Revenue (Million) Forecast, by Application 2019 & 2032
- Table 29: Rest of Africa Animal Growth Promoters Industry Revenue (Million) Forecast, by Application 2019 & 2032
- Table 30: Global Animal Growth Promoters Industry Revenue Million Forecast, by Type 2019 & 2032
- Table 31: Global Animal Growth Promoters Industry Revenue Million Forecast, by Animal Type 2019 & 2032
- Table 32: Global Animal Growth Promoters Industry Revenue Million Forecast, by Country 2019 & 2032
- Table 33: United States Animal Growth Promoters Industry Revenue (Million) Forecast, by Application 2019 & 2032
- Table 34: Canada Animal Growth Promoters Industry Revenue (Million) Forecast, by Application 2019 & 2032
- Table 35: Mexico Animal Growth Promoters Industry Revenue (Million) Forecast, by Application 2019 & 2032
- Table 36: Rest of North America Animal Growth Promoters Industry Revenue (Million) Forecast, by Application 2019 & 2032
- Table 37: Global Animal Growth Promoters Industry Revenue Million Forecast, by Type 2019 & 2032
- Table 38: Global Animal Growth Promoters Industry Revenue Million Forecast, by Animal Type 2019 & 2032
- Table 39: Global Animal Growth Promoters Industry Revenue Million Forecast, by Country 2019 & 2032
- Table 40: Germany Animal Growth Promoters Industry Revenue (Million) Forecast, by Application 2019 & 2032
- Table 41: United Kingdom Animal Growth Promoters Industry Revenue (Million) Forecast, by Application 2019 & 2032
- Table 42: France Animal Growth Promoters Industry Revenue (Million) Forecast, by Application 2019 & 2032
- Table 43: Russia Animal Growth Promoters Industry Revenue (Million) Forecast, by Application 2019 & 2032
- Table 44: Spain Animal Growth Promoters Industry Revenue (Million) Forecast, by Application 2019 & 2032
- Table 45: Rest of Europe Animal Growth Promoters Industry Revenue (Million) Forecast, by Application 2019 & 2032
- Table 46: Global Animal Growth Promoters Industry Revenue Million Forecast, by Type 2019 & 2032
- Table 47: Global Animal Growth Promoters Industry Revenue Million Forecast, by Animal Type 2019 & 2032
- Table 48: Global Animal Growth Promoters Industry Revenue Million Forecast, by Country 2019 & 2032
- Table 49: China Animal Growth Promoters Industry Revenue (Million) Forecast, by Application 2019 & 2032
- Table 50: Japan Animal Growth Promoters Industry Revenue (Million) Forecast, by Application 2019 & 2032
- Table 51: India Animal Growth Promoters Industry Revenue (Million) Forecast, by Application 2019 & 2032
- Table 52: Australia Animal Growth Promoters Industry Revenue (Million) Forecast, by Application 2019 & 2032
- Table 53: Rest of Asia Pacific Animal Growth Promoters Industry Revenue (Million) Forecast, by Application 2019 & 2032
- Table 54: Global Animal Growth Promoters Industry Revenue Million Forecast, by Type 2019 & 2032
- Table 55: Global Animal Growth Promoters Industry Revenue Million Forecast, by Animal Type 2019 & 2032
- Table 56: Global Animal Growth Promoters Industry Revenue Million Forecast, by Country 2019 & 2032
- Table 57: Brazil Animal Growth Promoters Industry Revenue (Million) Forecast, by Application 2019 & 2032
- Table 58: Argentina Animal Growth Promoters Industry Revenue (Million) Forecast, by Application 2019 & 2032
- Table 59: Rest of South America Animal Growth Promoters Industry Revenue (Million) Forecast, by Application 2019 & 2032
- Table 60: Global Animal Growth Promoters Industry Revenue Million Forecast, by Type 2019 & 2032
- Table 61: Global Animal Growth Promoters Industry Revenue Million Forecast, by Animal Type 2019 & 2032
- Table 62: Global Animal Growth Promoters Industry Revenue Million Forecast, by Country 2019 & 2032
- Table 63: South Africa Animal Growth Promoters Industry Revenue (Million) Forecast, by Application 2019 & 2032
- Table 64: Rest of Africa Animal Growth Promoters Industry Revenue (Million) Forecast, by Application 2019 & 2032
Frequently Asked Questions
1. What is the projected Compound Annual Growth Rate (CAGR) of the Animal Growth Promoters Industry?
The projected CAGR is approximately 5.30%.
2. Which companies are prominent players in the Animal Growth Promoters Industry?
Key companies in the market include Bluestar Adisseo, Guangdong VTR Bio-Tech Co Ltd, Biomin GmbH, Novus International Inc, Lotus Minechem Resources Pvt Ltd, Kemin Industries, Chr Hansen A/, BASF SE, DSM, Alltech Inc, Dupont De Nemours Inc, Cargill Inc, Novozymes A/S, Elanco Animal Health Incorporated, Zoetis Inc.
3. What are the main segments of the Animal Growth Promoters Industry?
The market segments include Type, Animal Type.
4. Can you provide details about the market size?
The market size is estimated to be USD 20.80 Million as of 2022.
5. What are some drivers contributing to market growth?
Increased Demand for Meat; Initiatives By the Key Players; Focus on Animal nutrition and Health.
6. What are the notable trends driving market growth?
The Rise in Demand for Meat Boosting the Market.
7. Are there any restraints impacting market growth?
Shift Toward Vegan- Based Diet; Changing Raw Material Prices and Strict Government Rules to Restrict Market Growth.
8. Can you provide examples of recent developments in the market?
N/A
9. What pricing options are available for accessing the report?
Pricing options include single-user, multi-user, and enterprise licenses priced at USD 4750, USD 5250, and USD 8750 respectively.
10. Is the market size provided in terms of value or volume?
The market size is provided in terms of value, measured in Million.
11. Are there any specific market keywords associated with the report?
Yes, the market keyword associated with the report is "Animal Growth Promoters Industry," which aids in identifying and referencing the specific market segment covered.
12. How do I determine which pricing option suits my needs best?
The pricing options vary based on user requirements and access needs. Individual users may opt for single-user licenses, while businesses requiring broader access may choose multi-user or enterprise licenses for cost-effective access to the report.
13. Are there any additional resources or data provided in the Animal Growth Promoters Industry report?
While the report offers comprehensive insights, it's advisable to review the specific contents or supplementary materials provided to ascertain if additional resources or data are available.
14. How can I stay updated on further developments or reports in the Animal Growth Promoters Industry?
To stay informed about further developments, trends, and reports in the Animal Growth Promoters Industry, consider subscribing to industry newsletters, following relevant companies and organizations, or regularly checking reputable industry news sources and publications.
Methodology
Step 1 - Identification of Relevant Samples Size from Population Database


Step 2 - Approaches for Defining Global Market Size (Value, Volume* & Price*)

Note*: In applicable scenarios
Step 3 - Data Sources
Primary Research
- Web Analytics
- Survey Reports
- Research Institute
- Latest Research Reports
- Opinion Leaders
Secondary Research
- Annual Reports
- White Paper
- Latest Press Release
- Industry Association
- Paid Database
- Investor Presentations

Step 4 - Data Triangulation
Involves using different sources of information in order to increase the validity of a study
These sources are likely to be stakeholders in a program - participants, other researchers, program staff, other community members, and so on.
Then we put all data in single framework & apply various statistical tools to find out the dynamic on the market.
During the analysis stage, feedback from the stakeholder groups would be compared to determine areas of agreement as well as areas of divergence


