Amphibious Aircraft Market Market’s Strategic Roadmap: Insights for 2025-2033

Amphibious Aircraft Market by Production Analysis, by Consumption Analysis, by Import Market Analysis (Value & Volume), by Export Market Analysis (Value & Volume), by Price Trend Analysis, by North America (United States, Canada, Mexico), by South America (Brazil, Argentina, Rest of South America), by Europe (United Kingdom, Germany, France, Italy, Spain, Russia, Benelux, Nordics, Rest of Europe), by Middle East & Africa (Turkey, Israel, GCC, North Africa, South Africa, Rest of Middle East & Africa), by Asia Pacific (China, India, Japan, South Korea, ASEAN, Oceania, Rest of Asia Pacific) Forecast 2025-2033

Jun 25 2025
Base Year: 2024

234 Pages
Main Logo

Amphibious Aircraft Market Market’s Strategic Roadmap: Insights for 2025-2033


Home
Industries
Aerospace & Defense
sponsor image
sponsor image
sponsor image
sponsor image

Tailored for you

  • In-depth Analysis Tailored to Specified Regions or Segments
  • Company Profiles Customized to User Preferences
  • Comprehensive Insights Focused on Specific Segments or Regions
  • Customized Evaluation of Competitive Landscape to Meet Your Needs
  • Tailored Customization to Address Other Specific Requirements
Ask for customization


Key Insights

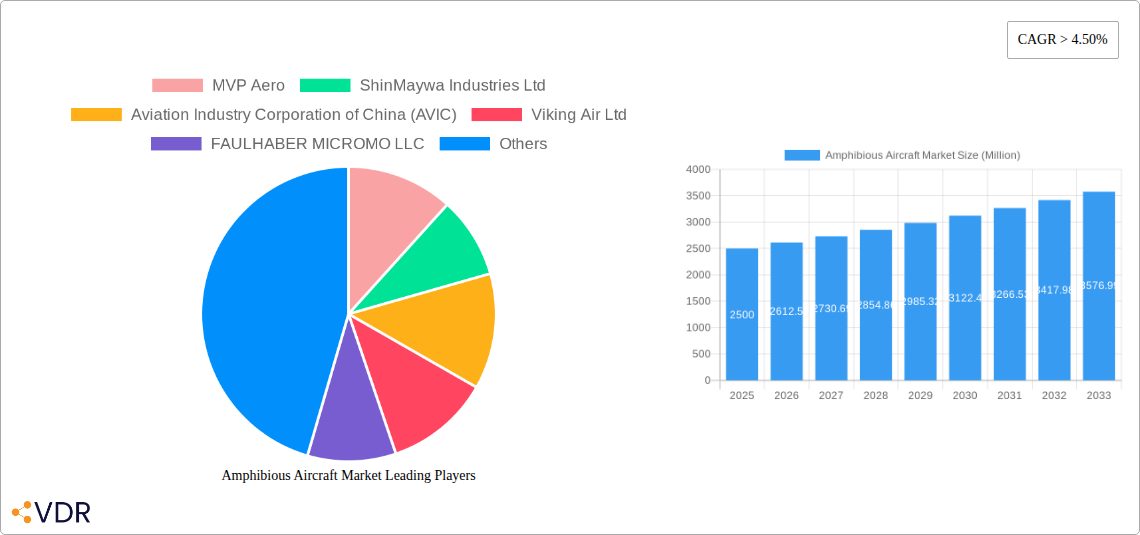
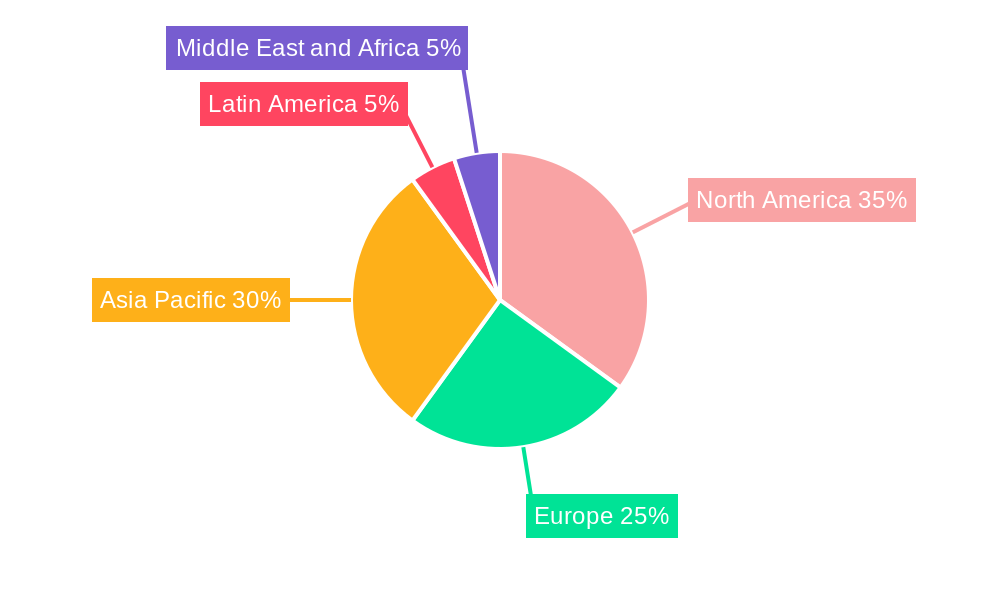
The amphibious aircraft market, valued at approximately $2.5 billion in 2025, is poised for robust growth, exhibiting a Compound Annual Growth Rate (CAGR) exceeding 4.50% from 2025 to 2033. This expansion is driven by several key factors. Increasing demand for versatile aircraft capable of operating from both land and water is fueling market growth, particularly in regions with extensive coastlines or inland waterways. Furthermore, advancements in aircraft design and technology, such as improved engine efficiency and enhanced safety features, are making amphibious aircraft more attractive to both civilian and military users. The civilian segment, encompassing applications like tourism, search and rescue, and environmental monitoring, is expected to witness significant growth, driven by rising tourism and increased awareness of environmental conservation. The military segment will continue to play a vital role, with ongoing demand for amphibious aircraft in coastal patrol, surveillance, and disaster relief operations. However, high acquisition and maintenance costs, coupled with stringent regulatory requirements, are expected to act as market restraints. The market is segmented by application (civilian and military) and engine type (piston and turboprop), with the turboprop segment projected to hold a larger market share due to its superior performance and range capabilities. Geographic distribution reflects a concentration in North America and Asia-Pacific, with growth potential in emerging markets of Latin America and the Middle East and Africa.

The competitive landscape is characterized by a mix of established players and emerging companies. Major manufacturers like Viking Air Ltd, Aviation Industry Corporation of China (AVIC), and ShinMaywa Industries Ltd are focusing on technological advancements and strategic partnerships to maintain their market positions. The presence of smaller, specialized manufacturers like ICON Aircraft Inc and Aero Adventure LLC indicates a dynamic market with opportunities for niche players catering to specific needs. Overall, the market is anticipated to witness a significant expansion in the forecast period, driven by both technological progress and the expanding need for versatile aerial platforms across various applications. The increasing adoption of sustainable aviation practices will influence the direction of future developments.

Amphibious Aircraft Market Research Report - Market Size, Growth & Forecast

Amphibious Aircraft Market: A Comprehensive Market Report (2019-2033)

This comprehensive report provides an in-depth analysis of the Amphibious Aircraft Market, encompassing market dynamics, growth trends, regional analysis, competitive landscape, and future outlook. The study period covers 2019-2033, with a base year of 2025 and a forecast period of 2025-2033. The report segments the market by application (civilian and military) and engine type (piston and turboprop), offering granular insights into various market sub-segments. The total market size is predicted to reach xx Million units by 2033.

Amphibious Aircraft Market Market Dynamics & Structure

The amphibious aircraft market is characterized by moderate concentration, with key players holding significant market share. Technological innovation, particularly in materials science and propulsion systems, is a key driver, alongside evolving regulatory frameworks that impact certification and operational approvals. Competitive substitutes, such as helicopters and specialized boats, exert pressure on market growth. End-user demographics, including government agencies, private operators, and commercial entities, significantly shape market demand. M&A activity remains relatively low, with xx deals recorded in the historical period (2019-2024), indicating opportunities for consolidation and strategic expansion.

  • Market Concentration: Moderately concentrated, with top 5 players holding approximately xx% market share in 2025.
  • Technological Innovation: Focus on lightweight materials, hybrid-electric propulsion, and advanced avionics.
  • Regulatory Framework: Stringent safety regulations and certification processes influence market entry and expansion.
  • Competitive Substitutes: Helicopters and specialized boats pose competition in specific application segments.
  • End-User Demographics: Government (Military & Civilian), Private Operators, Commercial Entities.
  • M&A Trends: Low activity historically (xx deals 2019-2024), potential for increased consolidation.

Amphibious Aircraft Market Growth Trends & Insights

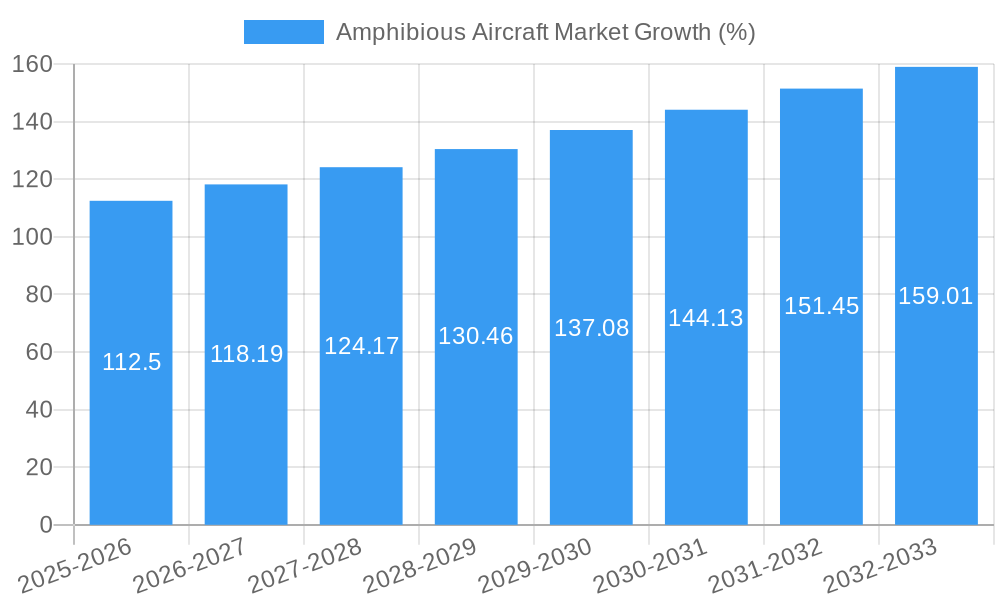
The amphibious aircraft market experienced a Compound Annual Growth Rate (CAGR) of xx% during the historical period (2019-2024), driven by increasing demand for versatile aircraft in diverse applications. Market penetration in emerging economies remains relatively low, presenting significant growth opportunities. Technological disruptions, such as the development of hybrid-electric propulsion systems and advanced materials, are expected to further enhance aircraft performance and efficiency. Shifting consumer preferences towards environmentally friendly solutions are also influencing market trends. The market size is projected to reach xx Million units by 2033, with a CAGR of xx% during the forecast period (2025-2033). Market penetration in key segments is expected to increase to xx% by 2033.

Amphibious Aircraft Market Growth

Dominant Regions, Countries, or Segments in Amphibious Aircraft Market

North America currently dominates the amphibious aircraft market, driven by strong demand from both civilian and military sectors. This dominance is attributed to robust infrastructure, supportive government policies, and a large base of private aircraft operators. The civilian segment exhibits higher growth potential compared to the military segment, fueled by increasing recreational activities and tourism in coastal regions. The turboprop engine type holds a larger market share compared to piston engines, driven by its superior performance characteristics in amphibious operations. Asia-Pacific is poised for significant growth driven by increasing infrastructure development and rising disposable incomes.

  • North America: Strong demand from civilian and military sectors; robust infrastructure; supportive government policies.
  • Europe: Steady growth driven by increasing tourism and search and rescue operations.
  • Asia-Pacific: High growth potential due to infrastructure development and rising disposable incomes.
  • Civilian Segment: Higher growth potential compared to the military segment due to increasing recreational activities and tourism.
  • Turboprop Engine: Dominant market share due to superior performance in amphibious operations.

Amphibious Aircraft Market Product Landscape

The amphibious aircraft market features a diverse range of products, encompassing single-engine and multi-engine aircraft designed for various applications. Innovations focus on enhancing safety, efficiency, and performance, leveraging advanced materials and technologies. Unique selling propositions include versatile operation capabilities, enhanced safety features, and superior fuel efficiency. Technological advancements in areas such as hybrid-electric propulsion systems are expected to revolutionize the industry in the coming years.

Key Drivers, Barriers & Challenges in Amphibious Aircraft Market

Key Drivers:

  • Increasing demand for versatile aircraft in diverse applications (search and rescue, surveillance, tourism).
  • Technological advancements leading to improved safety, efficiency, and performance.
  • Supportive government policies and investments in infrastructure development.

Key Challenges:

  • High initial investment costs and operational expenses.
  • Stringent safety regulations and certification processes.
  • Intense competition from alternative transportation modes (helicopters, boats).
  • Supply chain disruptions impacting production and delivery timelines (quantifiable impact: xx% delay in xx% of projects in 2024).

Emerging Opportunities in Amphibious Aircraft Market

  • Expansion into emerging markets with developing aviation infrastructure.
  • Development of specialized amphibious aircraft for niche applications (e.g., environmental monitoring).
  • Integration of advanced technologies (e.g., autonomous flight systems, advanced avionics).
  • Growing demand for environmentally friendly aircraft with reduced emissions.

Growth Accelerators in the Amphibious Aircraft Market Industry

Technological breakthroughs in propulsion systems, advanced materials, and avionics are key growth catalysts. Strategic partnerships between manufacturers and technology providers are fostering innovation and accelerating product development. Market expansion strategies focusing on untapped markets and emerging economies are further contributing to market growth.

Key Players Shaping the Amphibious Aircraft Market Market

  • MVP Aero
  • ShinMaywa Industries Ltd
  • Aviation Industry Corporation of China (AVIC)
  • Viking Air Ltd
  • FAULHABER MICROMO LLC
  • Atol Avion
  • Vickers Aircraft Company Limited
  • LISA Airplanes
  • United Aircraft Corporation
  • Equator Aircraft AS
  • Flywhale Aircraft GmbH & Co KG
  • Aero Adventure LLC
  • Seawings International
  • ICON Aircraft Inc

Notable Milestones in Amphibious Aircraft Market Sector

  • 2022 Q4: ICON Aircraft receives FAA certification for its A5 amphibious aircraft.
  • 2023 Q1: MVP Aero announces a strategic partnership with a leading battery manufacturer for hybrid-electric propulsion development.
  • 2024 Q2: Viking Air completes the acquisition of a smaller amphibious aircraft manufacturer.

In-Depth Amphibious Aircraft Market Market Outlook

The amphibious aircraft market is poised for significant growth over the forecast period, driven by continued technological advancements and expanding market demand. Strategic opportunities exist for companies focusing on innovation, strategic partnerships, and market expansion into new regions and applications. The market's future success hinges on addressing challenges related to high costs and stringent regulations while capitalizing on emerging trends such as sustainable aviation fuels and autonomous flight technologies.

Amphibious Aircraft Market Segmentation

  • 1. Production Analysis
  • 2. Consumption Analysis
  • 3. Import Market Analysis (Value & Volume)
  • 4. Export Market Analysis (Value & Volume)
  • 5. Price Trend Analysis

Amphibious Aircraft Market Segmentation By Geography

  • 1. North America
    • 1.1. United States
    • 1.2. Canada
    • 1.3. Mexico
  • 2. South America
    • 2.1. Brazil
    • 2.2. Argentina
    • 2.3. Rest of South America
  • 3. Europe
    • 3.1. United Kingdom
    • 3.2. Germany
    • 3.3. France
    • 3.4. Italy
    • 3.5. Spain
    • 3.6. Russia
    • 3.7. Benelux
    • 3.8. Nordics
    • 3.9. Rest of Europe
  • 4. Middle East & Africa
    • 4.1. Turkey
    • 4.2. Israel
    • 4.3. GCC
    • 4.4. North Africa
    • 4.5. South Africa
    • 4.6. Rest of Middle East & Africa
  • 5. Asia Pacific
    • 5.1. China
    • 5.2. India
    • 5.3. Japan
    • 5.4. South Korea
    • 5.5. ASEAN
    • 5.6. Oceania
    • 5.7. Rest of Asia Pacific
Amphibious Aircraft Market Regional Share


Amphibious Aircraft Market REPORT HIGHLIGHTS

AspectsDetails
Study Period 2019-2033
Base Year 2024
Estimated Year 2025
Forecast Period2025-2033
Historical Period2019-2024
Growth RateCAGR of > 4.50% from 2019-2033
Segmentation
    • By Production Analysis
    • By Consumption Analysis
    • By Import Market Analysis (Value & Volume)
    • By Export Market Analysis (Value & Volume)
    • By Price Trend Analysis
  • By Geography
    • North America
      • United States
      • Canada
      • Mexico
    • South America
      • Brazil
      • Argentina
      • Rest of South America
    • Europe
      • United Kingdom
      • Germany
      • France
      • Italy
      • Spain
      • Russia
      • Benelux
      • Nordics
      • Rest of Europe
    • Middle East & Africa
      • Turkey
      • Israel
      • GCC
      • North Africa
      • South Africa
      • Rest of Middle East & Africa
    • Asia Pacific
      • China
      • India
      • Japan
      • South Korea
      • ASEAN
      • Oceania
      • Rest of Asia Pacific


Table of Contents

  1. 1. Introduction
    • 1.1. Research Scope
    • 1.2. Market Segmentation
    • 1.3. Research Methodology
    • 1.4. Definitions and Assumptions
  2. 2. Executive Summary
    • 2.1. Introduction
  3. 3. Market Dynamics
    • 3.1. Introduction
      • 3.2. Market Drivers
        • 3.2.1. Increase in Internet of Things (IoT) and Autonomous Systems; Rise in Demand for Military and Defense Satellite Communication Solutions
      • 3.3. Market Restrains
        • 3.3.1. Cybersecurity Threats to Satellite Communication; Interference in Transmission of Data
      • 3.4. Market Trends
        • 3.4.1. Military Segment of the Market is Expected to Witness Decent Growth Rate During the Forecast Period
  4. 4. Market Factor Analysis
    • 4.1. Porters Five Forces
    • 4.2. Supply/Value Chain
    • 4.3. PESTEL analysis
    • 4.4. Market Entropy
    • 4.5. Patent/Trademark Analysis
  5. 5. Global Amphibious Aircraft Market Analysis, Insights and Forecast, 2019-2031
    • 5.1. Market Analysis, Insights and Forecast - by Production Analysis
      • 5.2. Market Analysis, Insights and Forecast - by Consumption Analysis
        • 5.3. Market Analysis, Insights and Forecast - by Import Market Analysis (Value & Volume)
          • 5.4. Market Analysis, Insights and Forecast - by Export Market Analysis (Value & Volume)
            • 5.5. Market Analysis, Insights and Forecast - by Price Trend Analysis
              • 5.6. Market Analysis, Insights and Forecast - by Region
                • 5.6.1. North America
                • 5.6.2. South America
                • 5.6.3. Europe
                • 5.6.4. Middle East & Africa
                • 5.6.5. Asia Pacific
            • 6. North America Amphibious Aircraft Market Analysis, Insights and Forecast, 2019-2031
              • 6.1. Market Analysis, Insights and Forecast - by Production Analysis
                • 6.2. Market Analysis, Insights and Forecast - by Consumption Analysis
                  • 6.3. Market Analysis, Insights and Forecast - by Import Market Analysis (Value & Volume)
                    • 6.4. Market Analysis, Insights and Forecast - by Export Market Analysis (Value & Volume)
                      • 6.5. Market Analysis, Insights and Forecast - by Price Trend Analysis
                      • 7. South America Amphibious Aircraft Market Analysis, Insights and Forecast, 2019-2031
                        • 7.1. Market Analysis, Insights and Forecast - by Production Analysis
                          • 7.2. Market Analysis, Insights and Forecast - by Consumption Analysis
                            • 7.3. Market Analysis, Insights and Forecast - by Import Market Analysis (Value & Volume)
                              • 7.4. Market Analysis, Insights and Forecast - by Export Market Analysis (Value & Volume)
                                • 7.5. Market Analysis, Insights and Forecast - by Price Trend Analysis
                                • 8. Europe Amphibious Aircraft Market Analysis, Insights and Forecast, 2019-2031
                                  • 8.1. Market Analysis, Insights and Forecast - by Production Analysis
                                    • 8.2. Market Analysis, Insights and Forecast - by Consumption Analysis
                                      • 8.3. Market Analysis, Insights and Forecast - by Import Market Analysis (Value & Volume)
                                        • 8.4. Market Analysis, Insights and Forecast - by Export Market Analysis (Value & Volume)
                                          • 8.5. Market Analysis, Insights and Forecast - by Price Trend Analysis
                                          • 9. Middle East & Africa Amphibious Aircraft Market Analysis, Insights and Forecast, 2019-2031
                                            • 9.1. Market Analysis, Insights and Forecast - by Production Analysis
                                              • 9.2. Market Analysis, Insights and Forecast - by Consumption Analysis
                                                • 9.3. Market Analysis, Insights and Forecast - by Import Market Analysis (Value & Volume)
                                                  • 9.4. Market Analysis, Insights and Forecast - by Export Market Analysis (Value & Volume)
                                                    • 9.5. Market Analysis, Insights and Forecast - by Price Trend Analysis
                                                    • 10. Asia Pacific Amphibious Aircraft Market Analysis, Insights and Forecast, 2019-2031
                                                      • 10.1. Market Analysis, Insights and Forecast - by Production Analysis
                                                        • 10.2. Market Analysis, Insights and Forecast - by Consumption Analysis
                                                          • 10.3. Market Analysis, Insights and Forecast - by Import Market Analysis (Value & Volume)
                                                            • 10.4. Market Analysis, Insights and Forecast - by Export Market Analysis (Value & Volume)
                                                              • 10.5. Market Analysis, Insights and Forecast - by Price Trend Analysis
                                                              • 11. North America Amphibious Aircraft Market Analysis, Insights and Forecast, 2019-2031
                                                                  • 11.1. Market Analysis, Insights and Forecast - By Country/Sub-region
                                                                    • 11.1.1 United States
                                                                    • 11.1.2 Canada
                                                              • 12. Asia Pacific Amphibious Aircraft Market Analysis, Insights and Forecast, 2019-2031
                                                                  • 12.1. Market Analysis, Insights and Forecast - By Country/Sub-region
                                                                    • 12.1.1 China
                                                                    • 12.1.2 Japan
                                                                    • 12.1.3 India
                                                                    • 12.1.4 Rest of Asia Pacific
                                                              • 13. Europe Amphibious Aircraft Market Analysis, Insights and Forecast, 2019-2031
                                                                  • 13.1. Market Analysis, Insights and Forecast - By Country/Sub-region
                                                                    • 13.1.1 United Kingdom
                                                                    • 13.1.2 Germany
                                                                    • 13.1.3 France
                                                                    • 13.1.4 Rest of Europe
                                                              • 14. Latin America Amphibious Aircraft Market Analysis, Insights and Forecast, 2019-2031
                                                                  • 14.1. Market Analysis, Insights and Forecast - By Country/Sub-region
                                                                    • 14.1.1 Mexico
                                                                    • 14.1.2 Brazil
                                                                    • 14.1.3 Rest of Latin America
                                                              • 15. Middle East and Africa Amphibious Aircraft Market Analysis, Insights and Forecast, 2019-2031
                                                                  • 15.1. Market Analysis, Insights and Forecast - By Country/Sub-region
                                                                    • 15.1.1 United Arab Emirates
                                                                    • 15.1.2 Saudi Arabia
                                                                    • 15.1.3 Rest of Middle East and Africa
                                                              • 16. Competitive Analysis
                                                                • 16.1. Global Market Share Analysis 2024
                                                                  • 16.2. Company Profiles
                                                                    • 16.2.1 MVP Aero
                                                                      • 16.2.1.1. Overview
                                                                      • 16.2.1.2. Products
                                                                      • 16.2.1.3. SWOT Analysis
                                                                      • 16.2.1.4. Recent Developments
                                                                      • 16.2.1.5. Financials (Based on Availability)
                                                                    • 16.2.2 ShinMaywa Industries Ltd
                                                                      • 16.2.2.1. Overview
                                                                      • 16.2.2.2. Products
                                                                      • 16.2.2.3. SWOT Analysis
                                                                      • 16.2.2.4. Recent Developments
                                                                      • 16.2.2.5. Financials (Based on Availability)
                                                                    • 16.2.3 Aviation Industry Corporation of China (AVIC)
                                                                      • 16.2.3.1. Overview
                                                                      • 16.2.3.2. Products
                                                                      • 16.2.3.3. SWOT Analysis
                                                                      • 16.2.3.4. Recent Developments
                                                                      • 16.2.3.5. Financials (Based on Availability)
                                                                    • 16.2.4 Viking Air Ltd
                                                                      • 16.2.4.1. Overview
                                                                      • 16.2.4.2. Products
                                                                      • 16.2.4.3. SWOT Analysis
                                                                      • 16.2.4.4. Recent Developments
                                                                      • 16.2.4.5. Financials (Based on Availability)
                                                                    • 16.2.5 FAULHABER MICROMO LLC
                                                                      • 16.2.5.1. Overview
                                                                      • 16.2.5.2. Products
                                                                      • 16.2.5.3. SWOT Analysis
                                                                      • 16.2.5.4. Recent Developments
                                                                      • 16.2.5.5. Financials (Based on Availability)
                                                                    • 16.2.6 Atol Avion
                                                                      • 16.2.6.1. Overview
                                                                      • 16.2.6.2. Products
                                                                      • 16.2.6.3. SWOT Analysis
                                                                      • 16.2.6.4. Recent Developments
                                                                      • 16.2.6.5. Financials (Based on Availability)
                                                                    • 16.2.7 Vickers Aircraft Company Limited
                                                                      • 16.2.7.1. Overview
                                                                      • 16.2.7.2. Products
                                                                      • 16.2.7.3. SWOT Analysis
                                                                      • 16.2.7.4. Recent Developments
                                                                      • 16.2.7.5. Financials (Based on Availability)
                                                                    • 16.2.8 LISA Airplanes
                                                                      • 16.2.8.1. Overview
                                                                      • 16.2.8.2. Products
                                                                      • 16.2.8.3. SWOT Analysis
                                                                      • 16.2.8.4. Recent Developments
                                                                      • 16.2.8.5. Financials (Based on Availability)
                                                                    • 16.2.9 United Aircraft Corporation
                                                                      • 16.2.9.1. Overview
                                                                      • 16.2.9.2. Products
                                                                      • 16.2.9.3. SWOT Analysis
                                                                      • 16.2.9.4. Recent Developments
                                                                      • 16.2.9.5. Financials (Based on Availability)
                                                                    • 16.2.10 Equator Aircraft AS
                                                                      • 16.2.10.1. Overview
                                                                      • 16.2.10.2. Products
                                                                      • 16.2.10.3. SWOT Analysis
                                                                      • 16.2.10.4. Recent Developments
                                                                      • 16.2.10.5. Financials (Based on Availability)
                                                                    • 16.2.11 Flywhale Aircraft GmbH & Co KG
                                                                      • 16.2.11.1. Overview
                                                                      • 16.2.11.2. Products
                                                                      • 16.2.11.3. SWOT Analysis
                                                                      • 16.2.11.4. Recent Developments
                                                                      • 16.2.11.5. Financials (Based on Availability)
                                                                    • 16.2.12 Aero Adventure LLC
                                                                      • 16.2.12.1. Overview
                                                                      • 16.2.12.2. Products
                                                                      • 16.2.12.3. SWOT Analysis
                                                                      • 16.2.12.4. Recent Developments
                                                                      • 16.2.12.5. Financials (Based on Availability)
                                                                    • 16.2.13 Seawings International
                                                                      • 16.2.13.1. Overview
                                                                      • 16.2.13.2. Products
                                                                      • 16.2.13.3. SWOT Analysis
                                                                      • 16.2.13.4. Recent Developments
                                                                      • 16.2.13.5. Financials (Based on Availability)
                                                                    • 16.2.14 ICON Aircraft Inc
                                                                      • 16.2.14.1. Overview
                                                                      • 16.2.14.2. Products
                                                                      • 16.2.14.3. SWOT Analysis
                                                                      • 16.2.14.4. Recent Developments
                                                                      • 16.2.14.5. Financials (Based on Availability)

                                                              List of Figures

                                                              1. Figure 1: Global Amphibious Aircraft Market Revenue Breakdown (Million, %) by Region 2024 & 2032
                                                              2. Figure 2: North America Amphibious Aircraft Market Revenue (Million), by Country 2024 & 2032
                                                              3. Figure 3: North America Amphibious Aircraft Market Revenue Share (%), by Country 2024 & 2032
                                                              4. Figure 4: Asia Pacific Amphibious Aircraft Market Revenue (Million), by Country 2024 & 2032
                                                              5. Figure 5: Asia Pacific Amphibious Aircraft Market Revenue Share (%), by Country 2024 & 2032
                                                              6. Figure 6: Europe Amphibious Aircraft Market Revenue (Million), by Country 2024 & 2032
                                                              7. Figure 7: Europe Amphibious Aircraft Market Revenue Share (%), by Country 2024 & 2032
                                                              8. Figure 8: Latin America Amphibious Aircraft Market Revenue (Million), by Country 2024 & 2032
                                                              9. Figure 9: Latin America Amphibious Aircraft Market Revenue Share (%), by Country 2024 & 2032
                                                              10. Figure 10: Middle East and Africa Amphibious Aircraft Market Revenue (Million), by Country 2024 & 2032
                                                              11. Figure 11: Middle East and Africa Amphibious Aircraft Market Revenue Share (%), by Country 2024 & 2032
                                                              12. Figure 12: North America Amphibious Aircraft Market Revenue (Million), by Production Analysis 2024 & 2032
                                                              13. Figure 13: North America Amphibious Aircraft Market Revenue Share (%), by Production Analysis 2024 & 2032
                                                              14. Figure 14: North America Amphibious Aircraft Market Revenue (Million), by Consumption Analysis 2024 & 2032
                                                              15. Figure 15: North America Amphibious Aircraft Market Revenue Share (%), by Consumption Analysis 2024 & 2032
                                                              16. Figure 16: North America Amphibious Aircraft Market Revenue (Million), by Import Market Analysis (Value & Volume) 2024 & 2032
                                                              17. Figure 17: North America Amphibious Aircraft Market Revenue Share (%), by Import Market Analysis (Value & Volume) 2024 & 2032
                                                              18. Figure 18: North America Amphibious Aircraft Market Revenue (Million), by Export Market Analysis (Value & Volume) 2024 & 2032
                                                              19. Figure 19: North America Amphibious Aircraft Market Revenue Share (%), by Export Market Analysis (Value & Volume) 2024 & 2032
                                                              20. Figure 20: North America Amphibious Aircraft Market Revenue (Million), by Price Trend Analysis 2024 & 2032
                                                              21. Figure 21: North America Amphibious Aircraft Market Revenue Share (%), by Price Trend Analysis 2024 & 2032
                                                              22. Figure 22: North America Amphibious Aircraft Market Revenue (Million), by Country 2024 & 2032
                                                              23. Figure 23: North America Amphibious Aircraft Market Revenue Share (%), by Country 2024 & 2032
                                                              24. Figure 24: South America Amphibious Aircraft Market Revenue (Million), by Production Analysis 2024 & 2032
                                                              25. Figure 25: South America Amphibious Aircraft Market Revenue Share (%), by Production Analysis 2024 & 2032
                                                              26. Figure 26: South America Amphibious Aircraft Market Revenue (Million), by Consumption Analysis 2024 & 2032
                                                              27. Figure 27: South America Amphibious Aircraft Market Revenue Share (%), by Consumption Analysis 2024 & 2032
                                                              28. Figure 28: South America Amphibious Aircraft Market Revenue (Million), by Import Market Analysis (Value & Volume) 2024 & 2032
                                                              29. Figure 29: South America Amphibious Aircraft Market Revenue Share (%), by Import Market Analysis (Value & Volume) 2024 & 2032
                                                              30. Figure 30: South America Amphibious Aircraft Market Revenue (Million), by Export Market Analysis (Value & Volume) 2024 & 2032
                                                              31. Figure 31: South America Amphibious Aircraft Market Revenue Share (%), by Export Market Analysis (Value & Volume) 2024 & 2032
                                                              32. Figure 32: South America Amphibious Aircraft Market Revenue (Million), by Price Trend Analysis 2024 & 2032
                                                              33. Figure 33: South America Amphibious Aircraft Market Revenue Share (%), by Price Trend Analysis 2024 & 2032
                                                              34. Figure 34: South America Amphibious Aircraft Market Revenue (Million), by Country 2024 & 2032
                                                              35. Figure 35: South America Amphibious Aircraft Market Revenue Share (%), by Country 2024 & 2032
                                                              36. Figure 36: Europe Amphibious Aircraft Market Revenue (Million), by Production Analysis 2024 & 2032
                                                              37. Figure 37: Europe Amphibious Aircraft Market Revenue Share (%), by Production Analysis 2024 & 2032
                                                              38. Figure 38: Europe Amphibious Aircraft Market Revenue (Million), by Consumption Analysis 2024 & 2032
                                                              39. Figure 39: Europe Amphibious Aircraft Market Revenue Share (%), by Consumption Analysis 2024 & 2032
                                                              40. Figure 40: Europe Amphibious Aircraft Market Revenue (Million), by Import Market Analysis (Value & Volume) 2024 & 2032
                                                              41. Figure 41: Europe Amphibious Aircraft Market Revenue Share (%), by Import Market Analysis (Value & Volume) 2024 & 2032
                                                              42. Figure 42: Europe Amphibious Aircraft Market Revenue (Million), by Export Market Analysis (Value & Volume) 2024 & 2032
                                                              43. Figure 43: Europe Amphibious Aircraft Market Revenue Share (%), by Export Market Analysis (Value & Volume) 2024 & 2032
                                                              44. Figure 44: Europe Amphibious Aircraft Market Revenue (Million), by Price Trend Analysis 2024 & 2032
                                                              45. Figure 45: Europe Amphibious Aircraft Market Revenue Share (%), by Price Trend Analysis 2024 & 2032
                                                              46. Figure 46: Europe Amphibious Aircraft Market Revenue (Million), by Country 2024 & 2032
                                                              47. Figure 47: Europe Amphibious Aircraft Market Revenue Share (%), by Country 2024 & 2032
                                                              48. Figure 48: Middle East & Africa Amphibious Aircraft Market Revenue (Million), by Production Analysis 2024 & 2032
                                                              49. Figure 49: Middle East & Africa Amphibious Aircraft Market Revenue Share (%), by Production Analysis 2024 & 2032
                                                              50. Figure 50: Middle East & Africa Amphibious Aircraft Market Revenue (Million), by Consumption Analysis 2024 & 2032
                                                              51. Figure 51: Middle East & Africa Amphibious Aircraft Market Revenue Share (%), by Consumption Analysis 2024 & 2032
                                                              52. Figure 52: Middle East & Africa Amphibious Aircraft Market Revenue (Million), by Import Market Analysis (Value & Volume) 2024 & 2032
                                                              53. Figure 53: Middle East & Africa Amphibious Aircraft Market Revenue Share (%), by Import Market Analysis (Value & Volume) 2024 & 2032
                                                              54. Figure 54: Middle East & Africa Amphibious Aircraft Market Revenue (Million), by Export Market Analysis (Value & Volume) 2024 & 2032
                                                              55. Figure 55: Middle East & Africa Amphibious Aircraft Market Revenue Share (%), by Export Market Analysis (Value & Volume) 2024 & 2032
                                                              56. Figure 56: Middle East & Africa Amphibious Aircraft Market Revenue (Million), by Price Trend Analysis 2024 & 2032
                                                              57. Figure 57: Middle East & Africa Amphibious Aircraft Market Revenue Share (%), by Price Trend Analysis 2024 & 2032
                                                              58. Figure 58: Middle East & Africa Amphibious Aircraft Market Revenue (Million), by Country 2024 & 2032
                                                              59. Figure 59: Middle East & Africa Amphibious Aircraft Market Revenue Share (%), by Country 2024 & 2032
                                                              60. Figure 60: Asia Pacific Amphibious Aircraft Market Revenue (Million), by Production Analysis 2024 & 2032
                                                              61. Figure 61: Asia Pacific Amphibious Aircraft Market Revenue Share (%), by Production Analysis 2024 & 2032
                                                              62. Figure 62: Asia Pacific Amphibious Aircraft Market Revenue (Million), by Consumption Analysis 2024 & 2032
                                                              63. Figure 63: Asia Pacific Amphibious Aircraft Market Revenue Share (%), by Consumption Analysis 2024 & 2032
                                                              64. Figure 64: Asia Pacific Amphibious Aircraft Market Revenue (Million), by Import Market Analysis (Value & Volume) 2024 & 2032
                                                              65. Figure 65: Asia Pacific Amphibious Aircraft Market Revenue Share (%), by Import Market Analysis (Value & Volume) 2024 & 2032
                                                              66. Figure 66: Asia Pacific Amphibious Aircraft Market Revenue (Million), by Export Market Analysis (Value & Volume) 2024 & 2032
                                                              67. Figure 67: Asia Pacific Amphibious Aircraft Market Revenue Share (%), by Export Market Analysis (Value & Volume) 2024 & 2032
                                                              68. Figure 68: Asia Pacific Amphibious Aircraft Market Revenue (Million), by Price Trend Analysis 2024 & 2032
                                                              69. Figure 69: Asia Pacific Amphibious Aircraft Market Revenue Share (%), by Price Trend Analysis 2024 & 2032
                                                              70. Figure 70: Asia Pacific Amphibious Aircraft Market Revenue (Million), by Country 2024 & 2032
                                                              71. Figure 71: Asia Pacific Amphibious Aircraft Market Revenue Share (%), by Country 2024 & 2032

                                                              List of Tables

                                                              1. Table 1: Global Amphibious Aircraft Market Revenue Million Forecast, by Region 2019 & 2032
                                                              2. Table 2: Global Amphibious Aircraft Market Revenue Million Forecast, by Production Analysis 2019 & 2032
                                                              3. Table 3: Global Amphibious Aircraft Market Revenue Million Forecast, by Consumption Analysis 2019 & 2032
                                                              4. Table 4: Global Amphibious Aircraft Market Revenue Million Forecast, by Import Market Analysis (Value & Volume) 2019 & 2032
                                                              5. Table 5: Global Amphibious Aircraft Market Revenue Million Forecast, by Export Market Analysis (Value & Volume) 2019 & 2032
                                                              6. Table 6: Global Amphibious Aircraft Market Revenue Million Forecast, by Price Trend Analysis 2019 & 2032
                                                              7. Table 7: Global Amphibious Aircraft Market Revenue Million Forecast, by Region 2019 & 2032
                                                              8. Table 8: Global Amphibious Aircraft Market Revenue Million Forecast, by Country 2019 & 2032
                                                              9. Table 9: United States Amphibious Aircraft Market Revenue (Million) Forecast, by Application 2019 & 2032
                                                              10. Table 10: Canada Amphibious Aircraft Market Revenue (Million) Forecast, by Application 2019 & 2032
                                                              11. Table 11: Global Amphibious Aircraft Market Revenue Million Forecast, by Country 2019 & 2032
                                                              12. Table 12: China Amphibious Aircraft Market Revenue (Million) Forecast, by Application 2019 & 2032
                                                              13. Table 13: Japan Amphibious Aircraft Market Revenue (Million) Forecast, by Application 2019 & 2032
                                                              14. Table 14: India Amphibious Aircraft Market Revenue (Million) Forecast, by Application 2019 & 2032
                                                              15. Table 15: Rest of Asia Pacific Amphibious Aircraft Market Revenue (Million) Forecast, by Application 2019 & 2032
                                                              16. Table 16: Global Amphibious Aircraft Market Revenue Million Forecast, by Country 2019 & 2032
                                                              17. Table 17: United Kingdom Amphibious Aircraft Market Revenue (Million) Forecast, by Application 2019 & 2032
                                                              18. Table 18: Germany Amphibious Aircraft Market Revenue (Million) Forecast, by Application 2019 & 2032
                                                              19. Table 19: France Amphibious Aircraft Market Revenue (Million) Forecast, by Application 2019 & 2032
                                                              20. Table 20: Rest of Europe Amphibious Aircraft Market Revenue (Million) Forecast, by Application 2019 & 2032
                                                              21. Table 21: Global Amphibious Aircraft Market Revenue Million Forecast, by Country 2019 & 2032
                                                              22. Table 22: Mexico Amphibious Aircraft Market Revenue (Million) Forecast, by Application 2019 & 2032
                                                              23. Table 23: Brazil Amphibious Aircraft Market Revenue (Million) Forecast, by Application 2019 & 2032
                                                              24. Table 24: Rest of Latin America Amphibious Aircraft Market Revenue (Million) Forecast, by Application 2019 & 2032
                                                              25. Table 25: Global Amphibious Aircraft Market Revenue Million Forecast, by Country 2019 & 2032
                                                              26. Table 26: United Arab Emirates Amphibious Aircraft Market Revenue (Million) Forecast, by Application 2019 & 2032
                                                              27. Table 27: Saudi Arabia Amphibious Aircraft Market Revenue (Million) Forecast, by Application 2019 & 2032
                                                              28. Table 28: Rest of Middle East and Africa Amphibious Aircraft Market Revenue (Million) Forecast, by Application 2019 & 2032
                                                              29. Table 29: Global Amphibious Aircraft Market Revenue Million Forecast, by Production Analysis 2019 & 2032
                                                              30. Table 30: Global Amphibious Aircraft Market Revenue Million Forecast, by Consumption Analysis 2019 & 2032
                                                              31. Table 31: Global Amphibious Aircraft Market Revenue Million Forecast, by Import Market Analysis (Value & Volume) 2019 & 2032
                                                              32. Table 32: Global Amphibious Aircraft Market Revenue Million Forecast, by Export Market Analysis (Value & Volume) 2019 & 2032
                                                              33. Table 33: Global Amphibious Aircraft Market Revenue Million Forecast, by Price Trend Analysis 2019 & 2032
                                                              34. Table 34: Global Amphibious Aircraft Market Revenue Million Forecast, by Country 2019 & 2032
                                                              35. Table 35: United States Amphibious Aircraft Market Revenue (Million) Forecast, by Application 2019 & 2032
                                                              36. Table 36: Canada Amphibious Aircraft Market Revenue (Million) Forecast, by Application 2019 & 2032
                                                              37. Table 37: Mexico Amphibious Aircraft Market Revenue (Million) Forecast, by Application 2019 & 2032
                                                              38. Table 38: Global Amphibious Aircraft Market Revenue Million Forecast, by Production Analysis 2019 & 2032
                                                              39. Table 39: Global Amphibious Aircraft Market Revenue Million Forecast, by Consumption Analysis 2019 & 2032
                                                              40. Table 40: Global Amphibious Aircraft Market Revenue Million Forecast, by Import Market Analysis (Value & Volume) 2019 & 2032
                                                              41. Table 41: Global Amphibious Aircraft Market Revenue Million Forecast, by Export Market Analysis (Value & Volume) 2019 & 2032
                                                              42. Table 42: Global Amphibious Aircraft Market Revenue Million Forecast, by Price Trend Analysis 2019 & 2032
                                                              43. Table 43: Global Amphibious Aircraft Market Revenue Million Forecast, by Country 2019 & 2032
                                                              44. Table 44: Brazil Amphibious Aircraft Market Revenue (Million) Forecast, by Application 2019 & 2032
                                                              45. Table 45: Argentina Amphibious Aircraft Market Revenue (Million) Forecast, by Application 2019 & 2032
                                                              46. Table 46: Rest of South America Amphibious Aircraft Market Revenue (Million) Forecast, by Application 2019 & 2032
                                                              47. Table 47: Global Amphibious Aircraft Market Revenue Million Forecast, by Production Analysis 2019 & 2032
                                                              48. Table 48: Global Amphibious Aircraft Market Revenue Million Forecast, by Consumption Analysis 2019 & 2032
                                                              49. Table 49: Global Amphibious Aircraft Market Revenue Million Forecast, by Import Market Analysis (Value & Volume) 2019 & 2032
                                                              50. Table 50: Global Amphibious Aircraft Market Revenue Million Forecast, by Export Market Analysis (Value & Volume) 2019 & 2032
                                                              51. Table 51: Global Amphibious Aircraft Market Revenue Million Forecast, by Price Trend Analysis 2019 & 2032
                                                              52. Table 52: Global Amphibious Aircraft Market Revenue Million Forecast, by Country 2019 & 2032
                                                              53. Table 53: United Kingdom Amphibious Aircraft Market Revenue (Million) Forecast, by Application 2019 & 2032
                                                              54. Table 54: Germany Amphibious Aircraft Market Revenue (Million) Forecast, by Application 2019 & 2032
                                                              55. Table 55: France Amphibious Aircraft Market Revenue (Million) Forecast, by Application 2019 & 2032
                                                              56. Table 56: Italy Amphibious Aircraft Market Revenue (Million) Forecast, by Application 2019 & 2032
                                                              57. Table 57: Spain Amphibious Aircraft Market Revenue (Million) Forecast, by Application 2019 & 2032
                                                              58. Table 58: Russia Amphibious Aircraft Market Revenue (Million) Forecast, by Application 2019 & 2032
                                                              59. Table 59: Benelux Amphibious Aircraft Market Revenue (Million) Forecast, by Application 2019 & 2032
                                                              60. Table 60: Nordics Amphibious Aircraft Market Revenue (Million) Forecast, by Application 2019 & 2032
                                                              61. Table 61: Rest of Europe Amphibious Aircraft Market Revenue (Million) Forecast, by Application 2019 & 2032
                                                              62. Table 62: Global Amphibious Aircraft Market Revenue Million Forecast, by Production Analysis 2019 & 2032
                                                              63. Table 63: Global Amphibious Aircraft Market Revenue Million Forecast, by Consumption Analysis 2019 & 2032
                                                              64. Table 64: Global Amphibious Aircraft Market Revenue Million Forecast, by Import Market Analysis (Value & Volume) 2019 & 2032
                                                              65. Table 65: Global Amphibious Aircraft Market Revenue Million Forecast, by Export Market Analysis (Value & Volume) 2019 & 2032
                                                              66. Table 66: Global Amphibious Aircraft Market Revenue Million Forecast, by Price Trend Analysis 2019 & 2032
                                                              67. Table 67: Global Amphibious Aircraft Market Revenue Million Forecast, by Country 2019 & 2032
                                                              68. Table 68: Turkey Amphibious Aircraft Market Revenue (Million) Forecast, by Application 2019 & 2032
                                                              69. Table 69: Israel Amphibious Aircraft Market Revenue (Million) Forecast, by Application 2019 & 2032
                                                              70. Table 70: GCC Amphibious Aircraft Market Revenue (Million) Forecast, by Application 2019 & 2032
                                                              71. Table 71: North Africa Amphibious Aircraft Market Revenue (Million) Forecast, by Application 2019 & 2032
                                                              72. Table 72: South Africa Amphibious Aircraft Market Revenue (Million) Forecast, by Application 2019 & 2032
                                                              73. Table 73: Rest of Middle East & Africa Amphibious Aircraft Market Revenue (Million) Forecast, by Application 2019 & 2032
                                                              74. Table 74: Global Amphibious Aircraft Market Revenue Million Forecast, by Production Analysis 2019 & 2032
                                                              75. Table 75: Global Amphibious Aircraft Market Revenue Million Forecast, by Consumption Analysis 2019 & 2032
                                                              76. Table 76: Global Amphibious Aircraft Market Revenue Million Forecast, by Import Market Analysis (Value & Volume) 2019 & 2032
                                                              77. Table 77: Global Amphibious Aircraft Market Revenue Million Forecast, by Export Market Analysis (Value & Volume) 2019 & 2032
                                                              78. Table 78: Global Amphibious Aircraft Market Revenue Million Forecast, by Price Trend Analysis 2019 & 2032
                                                              79. Table 79: Global Amphibious Aircraft Market Revenue Million Forecast, by Country 2019 & 2032
                                                              80. Table 80: China Amphibious Aircraft Market Revenue (Million) Forecast, by Application 2019 & 2032
                                                              81. Table 81: India Amphibious Aircraft Market Revenue (Million) Forecast, by Application 2019 & 2032
                                                              82. Table 82: Japan Amphibious Aircraft Market Revenue (Million) Forecast, by Application 2019 & 2032
                                                              83. Table 83: South Korea Amphibious Aircraft Market Revenue (Million) Forecast, by Application 2019 & 2032
                                                              84. Table 84: ASEAN Amphibious Aircraft Market Revenue (Million) Forecast, by Application 2019 & 2032
                                                              85. Table 85: Oceania Amphibious Aircraft Market Revenue (Million) Forecast, by Application 2019 & 2032
                                                              86. Table 86: Rest of Asia Pacific Amphibious Aircraft Market Revenue (Million) Forecast, by Application 2019 & 2032


                                                              Frequently Asked Questions

                                                              1. What is the projected Compound Annual Growth Rate (CAGR) of the Amphibious Aircraft Market?

                                                              The projected CAGR is approximately > 4.50%.

                                                              2. Which companies are prominent players in the Amphibious Aircraft Market?

                                                              Key companies in the market include MVP Aero, ShinMaywa Industries Ltd, Aviation Industry Corporation of China (AVIC), Viking Air Ltd, FAULHABER MICROMO LLC, Atol Avion, Vickers Aircraft Company Limited, LISA Airplanes, United Aircraft Corporation, Equator Aircraft AS, Flywhale Aircraft GmbH & Co KG, Aero Adventure LLC, Seawings International, ICON Aircraft Inc.

                                                              3. What are the main segments of the Amphibious Aircraft Market?

                                                              The market segments include Production Analysis, Consumption Analysis, Import Market Analysis (Value & Volume), Export Market Analysis (Value & Volume), Price Trend Analysis.

                                                              4. Can you provide details about the market size?

                                                              The market size is estimated to be USD XX Million as of 2022.

                                                              5. What are some drivers contributing to market growth?

                                                              Increase in Internet of Things (IoT) and Autonomous Systems; Rise in Demand for Military and Defense Satellite Communication Solutions.

                                                              6. What are the notable trends driving market growth?

                                                              Military Segment of the Market is Expected to Witness Decent Growth Rate During the Forecast Period.

                                                              7. Are there any restraints impacting market growth?

                                                              Cybersecurity Threats to Satellite Communication; Interference in Transmission of Data.

                                                              8. Can you provide examples of recent developments in the market?

                                                              N/A

                                                              9. What pricing options are available for accessing the report?

                                                              Pricing options include single-user, multi-user, and enterprise licenses priced at USD 4750, USD 5250, and USD 8750 respectively.

                                                              10. Is the market size provided in terms of value or volume?

                                                              The market size is provided in terms of value, measured in Million.

                                                              11. Are there any specific market keywords associated with the report?

                                                              Yes, the market keyword associated with the report is "Amphibious Aircraft Market," which aids in identifying and referencing the specific market segment covered.

                                                              12. How do I determine which pricing option suits my needs best?

                                                              The pricing options vary based on user requirements and access needs. Individual users may opt for single-user licenses, while businesses requiring broader access may choose multi-user or enterprise licenses for cost-effective access to the report.

                                                              13. Are there any additional resources or data provided in the Amphibious Aircraft Market report?

                                                              While the report offers comprehensive insights, it's advisable to review the specific contents or supplementary materials provided to ascertain if additional resources or data are available.

                                                              14. How can I stay updated on further developments or reports in the Amphibious Aircraft Market?

                                                              To stay informed about further developments, trends, and reports in the Amphibious Aircraft Market, consider subscribing to industry newsletters, following relevant companies and organizations, or regularly checking reputable industry news sources and publications.


                                                              Methodology

                                                              Step 1 - Identification of Relevant Samples Size from Population Database

                                                              Step Chart
                                                              Bar Chart
                                                              Method Chart

                                                              Step 2 - Approaches for Defining Global Market Size (Value, Volume* & Price*)

                                                              Approach Chart
                                                              Top-down and bottom-up approaches are used to validate the global market size and estimate the market size for manufactures, regional segments, product, and application.

                                                              Note*: In applicable scenarios

                                                              Step 3 - Data Sources

                                                              Primary Research

                                                              • Web Analytics
                                                              • Survey Reports
                                                              • Research Institute
                                                              • Latest Research Reports
                                                              • Opinion Leaders

                                                              Secondary Research

                                                              • Annual Reports
                                                              • White Paper
                                                              • Latest Press Release
                                                              • Industry Association
                                                              • Paid Database
                                                              • Investor Presentations
                                                              Analyst Chart

                                                              Step 4 - Data Triangulation

                                                              Involves using different sources of information in order to increase the validity of a study

                                                              These sources are likely to be stakeholders in a program - participants, other researchers, program staff, other community members, and so on.

                                                              Then we put all data in single framework & apply various statistical tools to find out the dynamic on the market.

                                                              During the analysis stage, feedback from the stakeholder groups would be compared to determine areas of agreement as well as areas of divergence

                                                              Additionally, after gathering mixed and scattered data from a wide range of sources, data is triangulated and correlated to come up with estimated figures which are further validated through primary mediums or industry experts, opinion leaders.

                                                              About Visionary Data Reports

                                                              Visionary Data Reports provides future-focused market research, advanced analytics, and strategic insights for technology, healthcare, green energy, and finance. Our reports help you anticipate trends, innovate, and lead in your industry. Our expert team combines primary research, data science, and industry knowledge to deliver actionable intelligence. We offer syndicated reports, custom analytics, and consulting services tailored to your business needs. At Visionary Data Reports, we are committed to quality, transparency, and client satisfaction. Every report is rigorously validated to ensure accuracy and relevance. Our global perspective and forward-thinking approach help you understand both current and emerging market dynamics.

                                                              Stay ahead with Visionary Data Reports. Subscribe to our newsletter for the latest insights and research highlights, and follow us on social media for real-time updates. Visionary Data Reports – Your Guide to Tomorrow’s Opportunities.

                                                              artwork spiralartwork spiralRelated Reports
                                                              artwork underline

                                                              Analyzing the Future of Aircraft Fire Protection System Industry: Key Trends to 2033

                                                              The Aircraft Fire Protection System market is booming, projected to reach $2.145 billion by 2033 with a 5.45% CAGR. Discover key drivers, trends, restraints, and leading companies shaping this crucial aviation safety sector. Explore market segmentation by aircraft type and application.

                                                              July 2025
                                                              Base Year: 2024
                                                              No Of Pages: 234
                                                              Price: $4750

                                                              C4ISR Systems Industry Future Pathways: Strategic Insights to 2033

                                                              The C4ISR Systems market is booming, projected to reach [estimated 2033 market size] by 2033, driven by escalating geopolitical tensions and defense modernization. Explore market trends, key players (Lockheed Martin, Boeing, Thales), and regional growth forecasts in this comprehensive analysis.

                                                              July 2025
                                                              Base Year: 2024
                                                              No Of Pages: 234
                                                              Price: $4750

                                                              Defense Market in Colombia Decoded: Comprehensive Analysis and Forecasts 2025-2033

                                                              Discover the growth trajectory of Colombia's defense market, projected to reach [Value in 2033, calculated from CAGR] by 2033. This in-depth analysis explores market drivers, trends, restraints, and key players including Textron, Lockheed Martin, and Boeing, highlighting lucrative opportunities in this dynamic sector.

                                                              July 2025
                                                              Base Year: 2024
                                                              No Of Pages: 197
                                                              Price: $3800

                                                              Asia-Pacific Border Security Market Future-Proofing Growth: Strategic Insights and Analysis 2025-2033

                                                              The Asia-Pacific border security market is booming, projected to reach \$30.27 billion by 2033, driven by rising geopolitical tensions and technological advancements in C4ISR, radar, and biometric systems. Explore market trends, key players, and regional insights in this comprehensive analysis.

                                                              July 2025
                                                              Base Year: 2024
                                                              No Of Pages: 234
                                                              Price: $4750

                                                              Challenges to Overcome in Attack Helicopter Market Market Growth: Analysis 2025-2033

                                                              The global attack helicopter market is booming, projected to exceed $XX million by 2033 with a CAGR of over 4%. Driven by geopolitical tensions and technological advancements, this report analyzes market trends, key players (Lockheed Martin, Boeing, Airbus), regional growth (North America, Asia-Pacific), and future forecasts. Learn more about this dynamic sector.

                                                              July 2025
                                                              Base Year: 2024
                                                              No Of Pages: 234
                                                              Price: $4750

                                                              Military Aircraft Collision Avoidance Systems Market in North America: Market Dynamics and Forecasts 2025-2033

                                                              The Military Aircraft Collision Avoidance Systems (MACAS) market is booming, projected to surpass $3.4 billion by 2033 with a CAGR exceeding 4%. Driven by advanced technologies like TCAS, TAWS, and SVS, this market offers lucrative opportunities for key players like L3Harris and Honeywell. Explore market trends, regional insights, and key segments in this detailed analysis.

                                                              July 2025
                                                              Base Year: 2024
                                                              No Of Pages: 234
                                                              Price: $4750

                                                              Charting Rocket Propulsion Market Growth: CAGR Projections for 2025-2033

                                                              The Rocket Propulsion Market is booming, projected to reach \$XX Billion by 2033 with a CAGR exceeding 8.5%! Explore market trends, key players (SpaceX, Blue Origin, etc.), segment analysis (solid, liquid, hybrid), and regional insights in this comprehensive report. Discover investment opportunities in this dynamic industry.

                                                              July 2025
                                                              Base Year: 2024
                                                              No Of Pages: 234
                                                              Price: $4750

                                                              Strategic Insights into Maritime Security Market Market Trends

                                                              The global maritime security market is experiencing steady growth driven by heightened security concerns and technological advancements. Explore market size, trends, key players (BAE Systems, Saab, Honeywell), and regional insights for the period 2019-2033. Discover the future of maritime surveillance and security.

                                                              July 2025
                                                              Base Year: 2024
                                                              No Of Pages: 197
                                                              Price: $3800

                                                              Military Aircraft Digital Glass Cockpit Systems Market Insights: Growth at XX CAGR Through 2033

                                                              The Military Aircraft Digital Glass Cockpit Systems market is booming, exceeding a 3% CAGR. Explore key drivers, trends, and restraints shaping this sector, including leading companies like L3Harris and Honeywell. Discover regional market shares and future growth projections through 2033.

                                                              July 2025
                                                              Base Year: 2024
                                                              No Of Pages: 234
                                                              Price: $4750

                                                              North America Commercial Aircraft In-Flight Entertainment System Market 2025-2033 Overview: Trends, Competitor Dynamics, and Opportunities

                                                              The North America Commercial Aircraft In-Flight Entertainment System market is booming, with a 7.11% CAGR. Discover key trends, market size projections (2025-2033), leading companies (Thales, Panasonic), and regional breakdowns. Learn how advanced connectivity and personalized content are shaping passenger experience.

                                                              July 2025
                                                              Base Year: 2024
                                                              No Of Pages: 197
                                                              Price: $3800

                                                              Satellite Payload Market’s Role in Shaping Industry Trends 2025-2033

                                                              The global satellite payload market is booming, projected to reach $31.4 billion by 2033 with an 8.54% CAGR. Driven by increased demand for communication, navigation, and surveillance, this report analyzes market segments (GEO, MEO, LEO, commercial, military), key players (SpaceX, Lockheed Martin, Airbus), and regional growth. Discover key trends and investment opportunities in this rapidly expanding sector.

                                                              July 2025
                                                              Base Year: 2024
                                                              No Of Pages: 234
                                                              Price: $4750

                                                              Passenger Emergency Oxygen Deployment Systems Market Market Demand Dynamics: Insights 2025-2033

                                                              The Passenger Emergency Oxygen Deployment Systems market is booming, projected to reach $3.24 billion by 2033 with a 7.42% CAGR. Driven by safety regulations and air travel growth, this market analysis reveals key trends, regional insights, and leading companies like Safran and RTX Corporation. Explore market segmentation, growth drivers, and competitive landscape.

                                                              July 2025
                                                              Base Year: 2024
                                                              No Of Pages: 234
                                                              Price: $4750

                                                              Regional Growth Projections for C5ISR Industry Industry

                                                              The C5ISR market is booming, driven by geopolitical tensions and technological advancements. This analysis reveals key market trends, growth projections, regional breakdowns, and leading companies in the industry, providing insights for investors and stakeholders. Explore the future of command, control, communications, computers, intelligence, surveillance, and reconnaissance.

                                                              July 2025
                                                              Base Year: 2024
                                                              No Of Pages: 234
                                                              Price: $4750

                                                              Europe Inflight Systems Market Growth Opportunities and Market Forecast 2025-2033: A Strategic Analysis

                                                              The European Inflight Systems Market is booming, projected to reach €242.5 million by 2033 with a CAGR of 2.67%. Discover key trends, growth drivers, and leading companies shaping the future of in-flight entertainment and connectivity in Europe. Explore market segmentation by class, country, and product type.

                                                              July 2025
                                                              Base Year: 2024
                                                              No Of Pages: 197
                                                              Price: $3800

                                                              Ammunition Market in NATO Market’s Decade-Long Growth Trends and Future Projections 2025-2033

                                                              The NATO Ammunition Market is booming, projected to reach over $12 billion by 2033, fueled by geopolitical tensions and defense modernization. Explore market trends, key players (RUAG, Rheinmetall, General Dynamics), and regional insights in this comprehensive analysis. Discover growth opportunities in precision-guided munitions and smart ammunition.

                                                              July 2025
                                                              Base Year: 2024
                                                              No Of Pages: 234
                                                              Price: $4750

                                                              Smart Textiles For Military Market Market’s Consumer Insights and Trends

                                                              Discover the explosive growth of the Smart Textiles for Military market, projected at a 15.37% CAGR. This in-depth analysis explores key drivers, trends, and challenges, including applications in camouflage, health monitoring, and energy harvesting. Learn about leading companies and regional market shares for strategic insights.

                                                              July 2025
                                                              Base Year: 2024
                                                              No Of Pages: 234
                                                              Price: $4750

                                                              Strategic Vision for Japan Defense Market Industry Trends

                                                              The Japan Defense Market is booming, projected to reach ¥62.65 billion by 2033 with a 3.4% CAGR. This in-depth analysis covers market size, key players (Thales, Lockheed Martin, Mitsubishi Heavy Industries), regional trends (Kanto, Kansai), and growth drivers. Discover the latest insights into Japan's defense spending and technological advancements.

                                                              July 2025
                                                              Base Year: 2024
                                                              No Of Pages: 197
                                                              Price: $3800

                                                              Exploring Consumer Shifts in GCC Aircraft MRO Industry Market 2025-2033

                                                              The GCC Aircraft MRO market is booming, projected to reach $3.25B in 2025 with a 14.46% CAGR. Discover key drivers, trends, and challenges shaping this lucrative industry, including insights into major players and regional market shares in the UAE, Saudi Arabia, and beyond. Explore the future of aircraft maintenance, repair, and overhaul in the Middle East.

                                                              July 2025
                                                              Base Year: 2024
                                                              No Of Pages: 197
                                                              Price: $3800

                                                              Understanding Growth Challenges in MEA Airport Passenger Screening Systems Industry Market 2025-2033

                                                              The MEA Airport Passenger Screening Systems market is booming, projected to reach [estimated 2033 value based on CAGR from chart data] by 2033. Driven by rising passenger numbers and enhanced security needs, this report analyzes market size, growth, key players (Vanderlande, Leidos, Garrett), and regional trends in Saudi Arabia, UAE, Qatar, and more. Discover the latest insights on advanced imaging technology, full-body scanners, and metal detectors in airport security.

                                                              July 2025
                                                              Base Year: 2024
                                                              No Of Pages: 234
                                                              Price: $4750

                                                              Asia-Pacific Commercial Aircraft Cabin Seating Market Decoded: Comprehensive Analysis and Forecasts 2025-2033

                                                              The Asia-Pacific commercial aircraft cabin seating market is booming, with a 7.32% CAGR. Discover key drivers, trends, and restraints impacting this dynamic sector, including insights into leading companies, regional market share, and future growth projections to 2033. Learn about the impact of narrowbody vs. widebody aircraft and the role of countries like China and India.

                                                              July 2025
                                                              Base Year: 2024
                                                              No Of Pages: 197
                                                              Price: $3800
                                                              • Home
                                                              • About Us
                                                              • Industries
                                                                • Aerospace & Defense
                                                                • Agriculture
                                                                • Animal Nutrition & Wellness
                                                                • Automotive
                                                                • Chemicals & Materials
                                                                • Consumer Goods and Services
                                                                • Energy & Power
                                                                • Financial Services and Investment Intelligence
                                                                • Food & Beverage
                                                                • Home and Property Improvement
                                                                • Hospitality and Tourism
                                                                • Logistics
                                                                • Manufacturing Products and Services
                                                                • Packaging
                                                                • Professional and Commercial Services
                                                                • Real Estate and Construction
                                                                • Retail
                                                                • Technology, Media and Telecom
                                                                • Healthcare
                                                              • Services
                                                              • Contact
                                                              Main Logo
                                                              • Home
                                                              • About Us
                                                              • Industries
                                                                • Aerospace & Defense
                                                                • Agriculture
                                                                • Animal Nutrition & Wellness
                                                                • Automotive
                                                                • Chemicals & Materials
                                                                • Consumer Goods and Services
                                                                • Energy & Power
                                                                • Financial Services and Investment Intelligence
                                                                • Food & Beverage
                                                                • Home and Property Improvement
                                                                • Hospitality and Tourism
                                                                • Logistics
                                                                • Manufacturing Products and Services
                                                                • Packaging
                                                                • Professional and Commercial Services
                                                                • Real Estate and Construction
                                                                • Retail
                                                                • Technology, Media and Telecom
                                                                • Healthcare
                                                              • Services
                                                              • Contact
                                                              +17162654855
                                                              [email protected]

                                                              +17162654855

                                                              [email protected]

                                                              Business Address

                                                              Head Office

                                                              Office no. A 5010, fifth floor, Solitaire Business Hub, Near Phoenix mall, Pune, Maharashtra 411014

                                                              Contact Information

                                                              Craig Francis

                                                              Business Development Head

                                                              +17162654855

                                                              [email protected]

                                                              Connect With Us

                                                              Secure Payment Partners

                                                              payment image
                                                              RetailLogisticsPackagingAutomotiveHealthcareAgricultureEnergy & PowerFood & BeverageAerospace & DefenseChemicals & MaterialsHospitality and TourismAnimal Nutrition & WellnessConsumer Goods and ServicesReal Estate and ConstructionHome and Property ImprovementTechnology, Media and TelecomManufacturing Products and ServicesFinancial Services and Investment Intelligence

                                                              © 2025 All rights reserved


                                                              Privacy Policy
                                                              Terms and Conditions
                                                              FAQ