
Key Insights
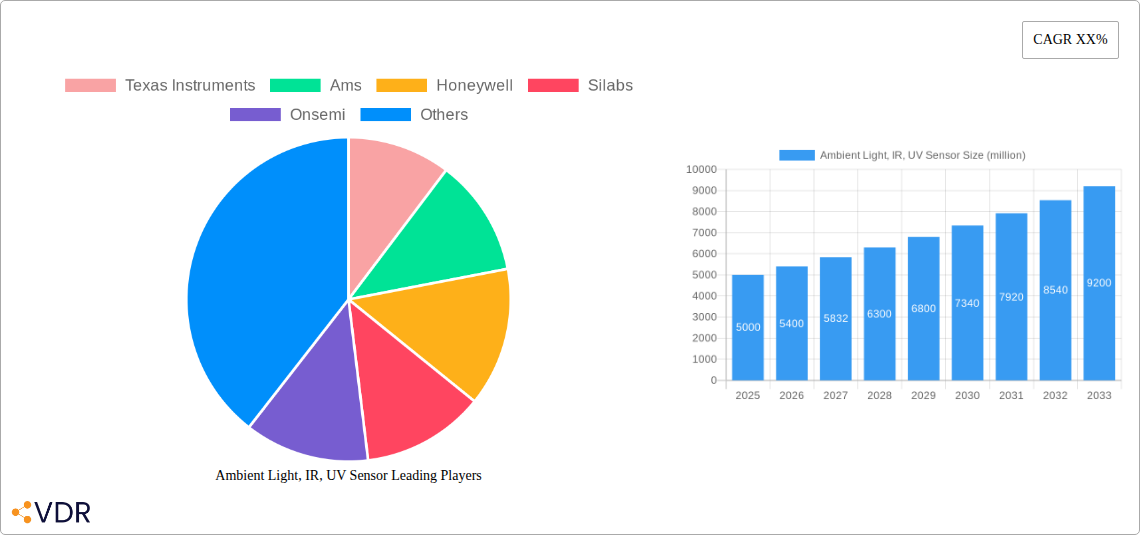
The global market for ambient light, IR, and UV sensors is experiencing robust growth, driven by increasing demand across diverse sectors. The market, estimated at $5 billion in 2025, is projected to expand at a compound annual growth rate (CAGR) of 8% from 2025 to 2033, reaching approximately $9 billion by 2033. This growth is fueled by several key factors. The proliferation of smartphones, wearables, and automotive applications incorporating advanced sensor technologies is a significant driver. Furthermore, the rising adoption of automation and smart technologies in industrial settings, coupled with the growing need for environmental monitoring and healthcare applications, is bolstering market expansion. Technological advancements leading to smaller, more energy-efficient, and cost-effective sensors further contribute to this upward trajectory. Segmentation within the market shows strong growth in high-performance sensors used in advanced imaging, autonomous vehicles, and medical diagnostics. Major players like Texas Instruments, AMS, Honeywell, and others are heavily investing in research and development, focusing on improving sensor accuracy, sensitivity, and integration capabilities.
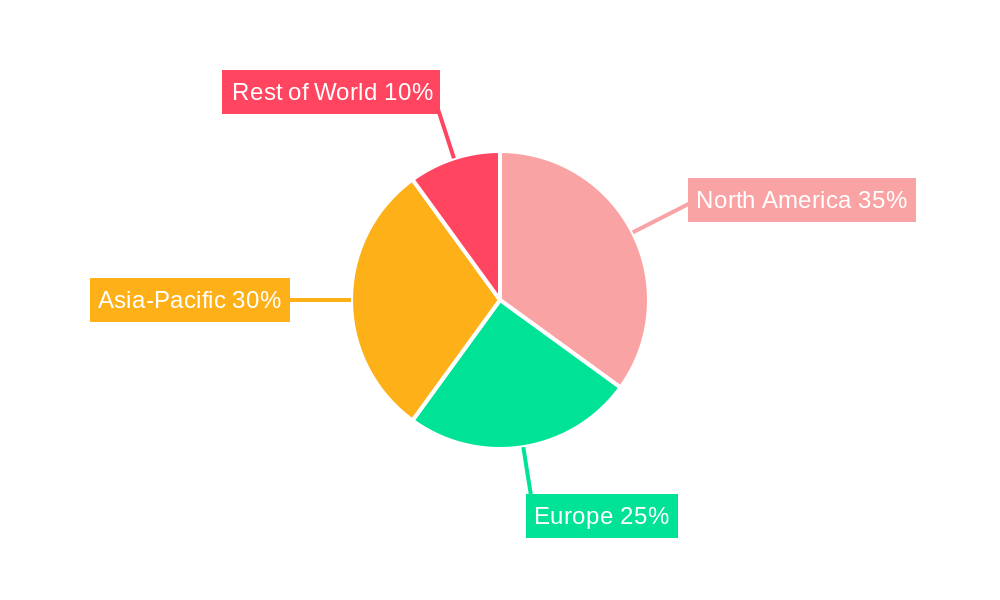
Market restraints include the potential for supply chain disruptions and the ongoing challenge of ensuring sensor reliability and durability in diverse environmental conditions. However, the long-term outlook remains positive, driven by continuous innovation and the increasing integration of sensors into a broader range of applications. Regional analysis suggests North America and Asia-Pacific are currently the largest markets, but growth opportunities are also emerging in developing economies due to increasing infrastructure development and rising disposable incomes. Competitive dynamics are intense, with established players facing pressure from new entrants offering innovative solutions and cost-effective alternatives. The strategic focus of key market players is shifting towards providing complete sensor solutions, including software and data analytics capabilities, thereby enhancing value proposition to end-users.
Ambient Light, IR, UV Sensor Market Report: 2019-2033
This comprehensive report provides an in-depth analysis of the Ambient Light, IR, and UV Sensor market, encompassing market dynamics, growth trends, regional dominance, product landscape, key players, and future outlook. The study period covers 2019-2033, with 2025 as the base and estimated year, and a forecast period of 2025-2033. The historical period analyzed is 2019-2024. This report is crucial for industry professionals, investors, and strategists seeking a detailed understanding of this rapidly evolving market.
Ambient Light, IR, UV Sensor Market Dynamics & Structure
The Ambient Light, IR, and UV Sensor market is characterized by a moderately concentrated landscape with several key players holding significant market share. Texas Instruments, AMS, and Honeywell are among the leading companies, but the market also sees participation from a number of smaller players. Technological innovation, particularly in miniaturization, improved sensitivity, and lower power consumption, is a key driver. Stringent regulatory frameworks concerning safety and environmental impact also shape market trends. Competitive product substitutes, such as alternative sensing technologies, present ongoing challenges. End-user demographics are diverse, spanning automotive, consumer electronics, industrial automation, healthcare, and environmental monitoring. M&A activity has been moderate, with several strategic acquisitions aimed at expanding product portfolios and geographical reach.
- Market Concentration: Moderately concentrated, with top 5 players holding approximately xx% market share in 2025.
- Technological Innovation: Focus on miniaturization, higher sensitivity, lower power consumption, and improved integration.
- Regulatory Landscape: Compliance with safety and environmental standards influences product design and manufacturing.
- Competitive Substitutes: Emerging technologies like LiDAR and other sensing methods pose competitive pressure.
- End-User Demographics: Automotive, consumer electronics, industrial automation, healthcare, and environmental monitoring are key segments.
- M&A Activity: Moderate activity, with xx major deals recorded between 2019 and 2024.
Ambient Light, IR, UV Sensor Growth Trends & Insights
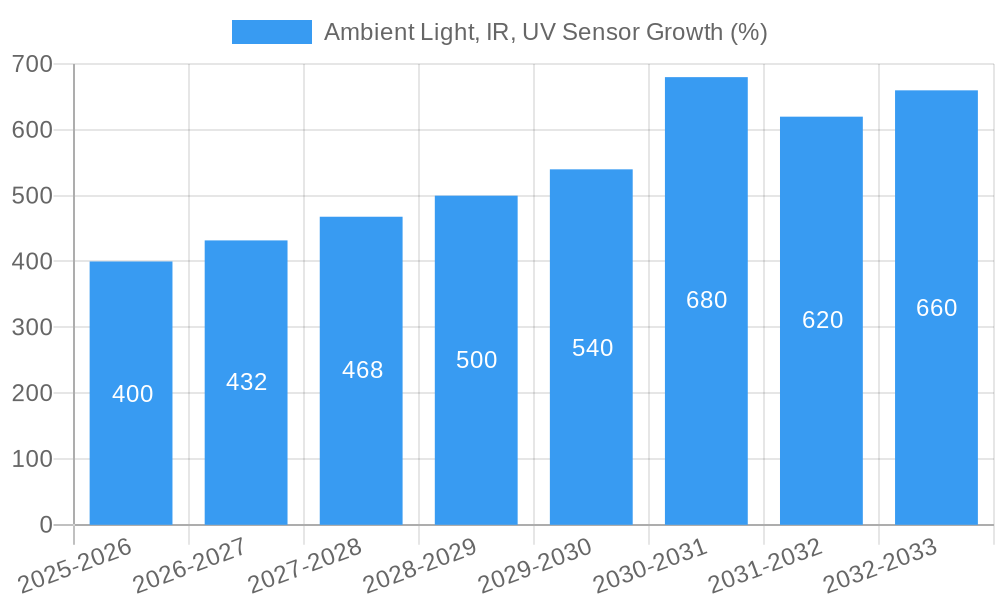
The Ambient Light, IR, and UV Sensor market exhibits robust growth, driven by increasing demand across diverse applications. Market size expanded from xx million units in 2019 to xx million units in 2024, exhibiting a CAGR of xx%. The automotive sector, fueled by the rising adoption of advanced driver-assistance systems (ADAS) and autonomous driving features, is a significant growth contributor. The consumer electronics segment also shows strong growth, driven by the increasing integration of sensors in smartphones, wearables, and smart home devices. Technological advancements, such as the development of smaller, more energy-efficient sensors, have further accelerated market growth. Shifting consumer preferences towards smart and connected devices are key factors behind this expansion. Market penetration continues to increase across various sectors, with a projected penetration rate of xx% by 2033.
Dominant Regions, Countries, or Segments in Ambient Light, IR, UV Sensor
North America and Asia-Pacific currently dominate the Ambient Light, IR, and UV Sensor market, holding approximately xx% and yy% market share respectively in 2025. This dominance is attributed to several factors:
- North America: Strong presence of major sensor manufacturers, robust automotive and industrial sectors, and early adoption of advanced technologies.
- Asia-Pacific: Rapid growth in consumer electronics, automotive, and industrial automation sectors, coupled with favorable government policies and expanding infrastructure.
- Europe: A significant market, driven by the increasing adoption of smart technologies in various sectors.
These regions benefit from strong economic growth, well-established manufacturing ecosystems, and supportive regulatory environments. The automotive sector, especially in North America and Europe, is a key contributor to regional dominance. The Asia-Pacific region shows high potential for future growth due to its expanding consumer electronics market and rapid industrialization.
Ambient Light, IR, UV Sensor Product Landscape
The market offers a diverse range of ambient light, IR, and UV sensors, varying in features, performance, and applications. Innovations focus on enhancing sensitivity, reducing power consumption, and integrating multiple sensing functionalities into single compact packages. The latest sensors offer advanced features like improved signal processing, higher accuracy, and wider operating temperature ranges. Unique selling propositions often emphasize miniaturization, cost-effectiveness, and high integration levels for seamless incorporation into various devices and systems.
Key Drivers, Barriers & Challenges in Ambient Light, IR, UV Sensor
Key Drivers:
- Growing demand for automation across diverse industries.
- Increasing adoption of smart devices and IoT technologies.
- Rising demand for advanced safety features in vehicles.
- Development of compact and energy-efficient sensors.
Challenges:
- Intense competition among manufacturers.
- Supply chain disruptions impacting production.
- Stringent regulatory compliance requirements, potentially increasing costs. These hurdles may impact market growth by roughly xx% by 2030.
Emerging Opportunities in Ambient Light, IR, UV Sensor
Emerging opportunities lie in the integration of these sensors into various next-generation technologies: wearable health monitoring devices, advanced robotics, improved environmental monitoring systems, and sophisticated agricultural applications. The expansion of the Internet of Things (IoT) also presents a significant opportunity for growth. Untapped markets in developing economies represent considerable potential for future expansion.
Growth Accelerators in the Ambient Light, IR, UV Sensor Industry
Technological advancements, strategic partnerships, and market expansion strategies are key growth accelerators. Continuous innovation in sensor technology, such as the development of advanced materials and manufacturing processes, contributes to cost reduction and performance enhancement. Strategic collaborations between sensor manufacturers and system integrators facilitate efficient product deployment and wider market reach. Expansion into new geographical markets and application areas further stimulates market growth.
Key Players Shaping the Ambient Light, IR, UV Sensor Market
- Texas Instruments
- AMS
- Honeywell
- Silabs
- Onsemi
- Microchip Technology
- Osram
- Broadcom (Avago)
- Murata
- Vishay
- Drager
- ST Microelectronics
- LAPIS Semiconductor
- Vernier
- Scitec Instruments
- Solar Light Company
- Apogee
Notable Milestones in Ambient Light, IR, UV Sensor Sector
- 2020: AMS launched its next-generation ambient light sensor with enhanced performance.
- 2021: Texas Instruments announced a strategic partnership to expand its sensor portfolio.
- 2022: Several key players introduced sensors with integrated AI capabilities.
- 2023: Significant investments in research and development across multiple sensor manufacturers.
- 2024: Increased M&A activity, with a focus on consolidating market share.
In-Depth Ambient Light, IR, UV Sensor Market Outlook
The Ambient Light, IR, and UV Sensor market is poised for continued strong growth, driven by technological innovation, expanding application areas, and increasing demand across various sectors. Future market potential is significant, with opportunities for companies to capitalize on emerging trends like the growth of IoT, the expansion into untapped markets, and the development of innovative sensor applications. Strategic partnerships and investments in R&D will be crucial for success in this competitive landscape.
Ambient Light, IR, UV Sensor Segmentation
-
1. Application
- 1.1. Electronic Product
- 1.2. Lighting System
- 1.3. Others
-
2. Types
- 2.1. Ambient Light Sensors
- 2.2. IR Sensors
- 2.3. UV Sensors
Ambient Light, IR, UV Sensor Segmentation By Geography
-
1. North America
- 1.1. United States
- 1.2. Canada
- 1.3. Mexico
-
2. South America
- 2.1. Brazil
- 2.2. Argentina
- 2.3. Rest of South America
-
3. Europe
- 3.1. United Kingdom
- 3.2. Germany
- 3.3. France
- 3.4. Italy
- 3.5. Spain
- 3.6. Russia
- 3.7. Benelux
- 3.8. Nordics
- 3.9. Rest of Europe
-
4. Middle East & Africa
- 4.1. Turkey
- 4.2. Israel
- 4.3. GCC
- 4.4. North Africa
- 4.5. South Africa
- 4.6. Rest of Middle East & Africa
-
5. Asia Pacific
- 5.1. China
- 5.2. India
- 5.3. Japan
- 5.4. South Korea
- 5.5. ASEAN
- 5.6. Oceania
- 5.7. Rest of Asia Pacific
Ambient Light, IR, UV Sensor REPORT HIGHLIGHTS
| Aspects | Details |
|---|---|
| Study Period | 2019-2033 |
| Base Year | 2024 |
| Estimated Year | 2025 |
| Forecast Period | 2025-2033 |
| Historical Period | 2019-2024 |
| Growth Rate | CAGR of XX% from 2019-2033 |
| Segmentation |
|
Table of Contents
- 1. Introduction
- 1.1. Research Scope
- 1.2. Market Segmentation
- 1.3. Research Methodology
- 1.4. Definitions and Assumptions
- 2. Executive Summary
- 2.1. Introduction
- 3. Market Dynamics
- 3.1. Introduction
- 3.2. Market Drivers
- 3.3. Market Restrains
- 3.4. Market Trends
- 4. Market Factor Analysis
- 4.1. Porters Five Forces
- 4.2. Supply/Value Chain
- 4.3. PESTEL analysis
- 4.4. Market Entropy
- 4.5. Patent/Trademark Analysis
- 5. Global Ambient Light, IR, UV Sensor Analysis, Insights and Forecast, 2019-2031
- 5.1. Market Analysis, Insights and Forecast - by Application
- 5.1.1. Electronic Product
- 5.1.2. Lighting System
- 5.1.3. Others
- 5.2. Market Analysis, Insights and Forecast - by Types
- 5.2.1. Ambient Light Sensors
- 5.2.2. IR Sensors
- 5.2.3. UV Sensors
- 5.3. Market Analysis, Insights and Forecast - by Region
- 5.3.1. North America
- 5.3.2. South America
- 5.3.3. Europe
- 5.3.4. Middle East & Africa
- 5.3.5. Asia Pacific
- 5.1. Market Analysis, Insights and Forecast - by Application
- 6. North America Ambient Light, IR, UV Sensor Analysis, Insights and Forecast, 2019-2031
- 6.1. Market Analysis, Insights and Forecast - by Application
- 6.1.1. Electronic Product
- 6.1.2. Lighting System
- 6.1.3. Others
- 6.2. Market Analysis, Insights and Forecast - by Types
- 6.2.1. Ambient Light Sensors
- 6.2.2. IR Sensors
- 6.2.3. UV Sensors
- 6.1. Market Analysis, Insights and Forecast - by Application
- 7. South America Ambient Light, IR, UV Sensor Analysis, Insights and Forecast, 2019-2031
- 7.1. Market Analysis, Insights and Forecast - by Application
- 7.1.1. Electronic Product
- 7.1.2. Lighting System
- 7.1.3. Others
- 7.2. Market Analysis, Insights and Forecast - by Types
- 7.2.1. Ambient Light Sensors
- 7.2.2. IR Sensors
- 7.2.3. UV Sensors
- 7.1. Market Analysis, Insights and Forecast - by Application
- 8. Europe Ambient Light, IR, UV Sensor Analysis, Insights and Forecast, 2019-2031
- 8.1. Market Analysis, Insights and Forecast - by Application
- 8.1.1. Electronic Product
- 8.1.2. Lighting System
- 8.1.3. Others
- 8.2. Market Analysis, Insights and Forecast - by Types
- 8.2.1. Ambient Light Sensors
- 8.2.2. IR Sensors
- 8.2.3. UV Sensors
- 8.1. Market Analysis, Insights and Forecast - by Application
- 9. Middle East & Africa Ambient Light, IR, UV Sensor Analysis, Insights and Forecast, 2019-2031
- 9.1. Market Analysis, Insights and Forecast - by Application
- 9.1.1. Electronic Product
- 9.1.2. Lighting System
- 9.1.3. Others
- 9.2. Market Analysis, Insights and Forecast - by Types
- 9.2.1. Ambient Light Sensors
- 9.2.2. IR Sensors
- 9.2.3. UV Sensors
- 9.1. Market Analysis, Insights and Forecast - by Application
- 10. Asia Pacific Ambient Light, IR, UV Sensor Analysis, Insights and Forecast, 2019-2031
- 10.1. Market Analysis, Insights and Forecast - by Application
- 10.1.1. Electronic Product
- 10.1.2. Lighting System
- 10.1.3. Others
- 10.2. Market Analysis, Insights and Forecast - by Types
- 10.2.1. Ambient Light Sensors
- 10.2.2. IR Sensors
- 10.2.3. UV Sensors
- 10.1. Market Analysis, Insights and Forecast - by Application
- 11. Competitive Analysis
- 11.1. Global Market Share Analysis 2024
- 11.2. Company Profiles
- 11.2.1 Texas Instruments
- 11.2.1.1. Overview
- 11.2.1.2. Products
- 11.2.1.3. SWOT Analysis
- 11.2.1.4. Recent Developments
- 11.2.1.5. Financials (Based on Availability)
- 11.2.2 Ams
- 11.2.2.1. Overview
- 11.2.2.2. Products
- 11.2.2.3. SWOT Analysis
- 11.2.2.4. Recent Developments
- 11.2.2.5. Financials (Based on Availability)
- 11.2.3 Honeywell
- 11.2.3.1. Overview
- 11.2.3.2. Products
- 11.2.3.3. SWOT Analysis
- 11.2.3.4. Recent Developments
- 11.2.3.5. Financials (Based on Availability)
- 11.2.4 Silabs
- 11.2.4.1. Overview
- 11.2.4.2. Products
- 11.2.4.3. SWOT Analysis
- 11.2.4.4. Recent Developments
- 11.2.4.5. Financials (Based on Availability)
- 11.2.5 Onsemi
- 11.2.5.1. Overview
- 11.2.5.2. Products
- 11.2.5.3. SWOT Analysis
- 11.2.5.4. Recent Developments
- 11.2.5.5. Financials (Based on Availability)
- 11.2.6 Microchip Technology
- 11.2.6.1. Overview
- 11.2.6.2. Products
- 11.2.6.3. SWOT Analysis
- 11.2.6.4. Recent Developments
- 11.2.6.5. Financials (Based on Availability)
- 11.2.7 Osram
- 11.2.7.1. Overview
- 11.2.7.2. Products
- 11.2.7.3. SWOT Analysis
- 11.2.7.4. Recent Developments
- 11.2.7.5. Financials (Based on Availability)
- 11.2.8 Broadcom(Avago)
- 11.2.8.1. Overview
- 11.2.8.2. Products
- 11.2.8.3. SWOT Analysis
- 11.2.8.4. Recent Developments
- 11.2.8.5. Financials (Based on Availability)
- 11.2.9 Murata
- 11.2.9.1. Overview
- 11.2.9.2. Products
- 11.2.9.3. SWOT Analysis
- 11.2.9.4. Recent Developments
- 11.2.9.5. Financials (Based on Availability)
- 11.2.10 Vishay
- 11.2.10.1. Overview
- 11.2.10.2. Products
- 11.2.10.3. SWOT Analysis
- 11.2.10.4. Recent Developments
- 11.2.10.5. Financials (Based on Availability)
- 11.2.11 Drager
- 11.2.11.1. Overview
- 11.2.11.2. Products
- 11.2.11.3. SWOT Analysis
- 11.2.11.4. Recent Developments
- 11.2.11.5. Financials (Based on Availability)
- 11.2.12 ST Microelectronics
- 11.2.12.1. Overview
- 11.2.12.2. Products
- 11.2.12.3. SWOT Analysis
- 11.2.12.4. Recent Developments
- 11.2.12.5. Financials (Based on Availability)
- 11.2.13 LAPIS Semiconductor
- 11.2.13.1. Overview
- 11.2.13.2. Products
- 11.2.13.3. SWOT Analysis
- 11.2.13.4. Recent Developments
- 11.2.13.5. Financials (Based on Availability)
- 11.2.14 Vernier
- 11.2.14.1. Overview
- 11.2.14.2. Products
- 11.2.14.3. SWOT Analysis
- 11.2.14.4. Recent Developments
- 11.2.14.5. Financials (Based on Availability)
- 11.2.15 Scitec Instruments
- 11.2.15.1. Overview
- 11.2.15.2. Products
- 11.2.15.3. SWOT Analysis
- 11.2.15.4. Recent Developments
- 11.2.15.5. Financials (Based on Availability)
- 11.2.16 Solar Light Company
- 11.2.16.1. Overview
- 11.2.16.2. Products
- 11.2.16.3. SWOT Analysis
- 11.2.16.4. Recent Developments
- 11.2.16.5. Financials (Based on Availability)
- 11.2.17 Apogee
- 11.2.17.1. Overview
- 11.2.17.2. Products
- 11.2.17.3. SWOT Analysis
- 11.2.17.4. Recent Developments
- 11.2.17.5. Financials (Based on Availability)
- 11.2.1 Texas Instruments
List of Figures
- Figure 1: Global Ambient Light, IR, UV Sensor Revenue Breakdown (million, %) by Region 2024 & 2032
- Figure 2: North America Ambient Light, IR, UV Sensor Revenue (million), by Application 2024 & 2032
- Figure 3: North America Ambient Light, IR, UV Sensor Revenue Share (%), by Application 2024 & 2032
- Figure 4: North America Ambient Light, IR, UV Sensor Revenue (million), by Types 2024 & 2032
- Figure 5: North America Ambient Light, IR, UV Sensor Revenue Share (%), by Types 2024 & 2032
- Figure 6: North America Ambient Light, IR, UV Sensor Revenue (million), by Country 2024 & 2032
- Figure 7: North America Ambient Light, IR, UV Sensor Revenue Share (%), by Country 2024 & 2032
- Figure 8: South America Ambient Light, IR, UV Sensor Revenue (million), by Application 2024 & 2032
- Figure 9: South America Ambient Light, IR, UV Sensor Revenue Share (%), by Application 2024 & 2032
- Figure 10: South America Ambient Light, IR, UV Sensor Revenue (million), by Types 2024 & 2032
- Figure 11: South America Ambient Light, IR, UV Sensor Revenue Share (%), by Types 2024 & 2032
- Figure 12: South America Ambient Light, IR, UV Sensor Revenue (million), by Country 2024 & 2032
- Figure 13: South America Ambient Light, IR, UV Sensor Revenue Share (%), by Country 2024 & 2032
- Figure 14: Europe Ambient Light, IR, UV Sensor Revenue (million), by Application 2024 & 2032
- Figure 15: Europe Ambient Light, IR, UV Sensor Revenue Share (%), by Application 2024 & 2032
- Figure 16: Europe Ambient Light, IR, UV Sensor Revenue (million), by Types 2024 & 2032
- Figure 17: Europe Ambient Light, IR, UV Sensor Revenue Share (%), by Types 2024 & 2032
- Figure 18: Europe Ambient Light, IR, UV Sensor Revenue (million), by Country 2024 & 2032
- Figure 19: Europe Ambient Light, IR, UV Sensor Revenue Share (%), by Country 2024 & 2032
- Figure 20: Middle East & Africa Ambient Light, IR, UV Sensor Revenue (million), by Application 2024 & 2032
- Figure 21: Middle East & Africa Ambient Light, IR, UV Sensor Revenue Share (%), by Application 2024 & 2032
- Figure 22: Middle East & Africa Ambient Light, IR, UV Sensor Revenue (million), by Types 2024 & 2032
- Figure 23: Middle East & Africa Ambient Light, IR, UV Sensor Revenue Share (%), by Types 2024 & 2032
- Figure 24: Middle East & Africa Ambient Light, IR, UV Sensor Revenue (million), by Country 2024 & 2032
- Figure 25: Middle East & Africa Ambient Light, IR, UV Sensor Revenue Share (%), by Country 2024 & 2032
- Figure 26: Asia Pacific Ambient Light, IR, UV Sensor Revenue (million), by Application 2024 & 2032
- Figure 27: Asia Pacific Ambient Light, IR, UV Sensor Revenue Share (%), by Application 2024 & 2032
- Figure 28: Asia Pacific Ambient Light, IR, UV Sensor Revenue (million), by Types 2024 & 2032
- Figure 29: Asia Pacific Ambient Light, IR, UV Sensor Revenue Share (%), by Types 2024 & 2032
- Figure 30: Asia Pacific Ambient Light, IR, UV Sensor Revenue (million), by Country 2024 & 2032
- Figure 31: Asia Pacific Ambient Light, IR, UV Sensor Revenue Share (%), by Country 2024 & 2032
List of Tables
- Table 1: Global Ambient Light, IR, UV Sensor Revenue million Forecast, by Region 2019 & 2032
- Table 2: Global Ambient Light, IR, UV Sensor Revenue million Forecast, by Application 2019 & 2032
- Table 3: Global Ambient Light, IR, UV Sensor Revenue million Forecast, by Types 2019 & 2032
- Table 4: Global Ambient Light, IR, UV Sensor Revenue million Forecast, by Region 2019 & 2032
- Table 5: Global Ambient Light, IR, UV Sensor Revenue million Forecast, by Application 2019 & 2032
- Table 6: Global Ambient Light, IR, UV Sensor Revenue million Forecast, by Types 2019 & 2032
- Table 7: Global Ambient Light, IR, UV Sensor Revenue million Forecast, by Country 2019 & 2032
- Table 8: United States Ambient Light, IR, UV Sensor Revenue (million) Forecast, by Application 2019 & 2032
- Table 9: Canada Ambient Light, IR, UV Sensor Revenue (million) Forecast, by Application 2019 & 2032
- Table 10: Mexico Ambient Light, IR, UV Sensor Revenue (million) Forecast, by Application 2019 & 2032
- Table 11: Global Ambient Light, IR, UV Sensor Revenue million Forecast, by Application 2019 & 2032
- Table 12: Global Ambient Light, IR, UV Sensor Revenue million Forecast, by Types 2019 & 2032
- Table 13: Global Ambient Light, IR, UV Sensor Revenue million Forecast, by Country 2019 & 2032
- Table 14: Brazil Ambient Light, IR, UV Sensor Revenue (million) Forecast, by Application 2019 & 2032
- Table 15: Argentina Ambient Light, IR, UV Sensor Revenue (million) Forecast, by Application 2019 & 2032
- Table 16: Rest of South America Ambient Light, IR, UV Sensor Revenue (million) Forecast, by Application 2019 & 2032
- Table 17: Global Ambient Light, IR, UV Sensor Revenue million Forecast, by Application 2019 & 2032
- Table 18: Global Ambient Light, IR, UV Sensor Revenue million Forecast, by Types 2019 & 2032
- Table 19: Global Ambient Light, IR, UV Sensor Revenue million Forecast, by Country 2019 & 2032
- Table 20: United Kingdom Ambient Light, IR, UV Sensor Revenue (million) Forecast, by Application 2019 & 2032
- Table 21: Germany Ambient Light, IR, UV Sensor Revenue (million) Forecast, by Application 2019 & 2032
- Table 22: France Ambient Light, IR, UV Sensor Revenue (million) Forecast, by Application 2019 & 2032
- Table 23: Italy Ambient Light, IR, UV Sensor Revenue (million) Forecast, by Application 2019 & 2032
- Table 24: Spain Ambient Light, IR, UV Sensor Revenue (million) Forecast, by Application 2019 & 2032
- Table 25: Russia Ambient Light, IR, UV Sensor Revenue (million) Forecast, by Application 2019 & 2032
- Table 26: Benelux Ambient Light, IR, UV Sensor Revenue (million) Forecast, by Application 2019 & 2032
- Table 27: Nordics Ambient Light, IR, UV Sensor Revenue (million) Forecast, by Application 2019 & 2032
- Table 28: Rest of Europe Ambient Light, IR, UV Sensor Revenue (million) Forecast, by Application 2019 & 2032
- Table 29: Global Ambient Light, IR, UV Sensor Revenue million Forecast, by Application 2019 & 2032
- Table 30: Global Ambient Light, IR, UV Sensor Revenue million Forecast, by Types 2019 & 2032
- Table 31: Global Ambient Light, IR, UV Sensor Revenue million Forecast, by Country 2019 & 2032
- Table 32: Turkey Ambient Light, IR, UV Sensor Revenue (million) Forecast, by Application 2019 & 2032
- Table 33: Israel Ambient Light, IR, UV Sensor Revenue (million) Forecast, by Application 2019 & 2032
- Table 34: GCC Ambient Light, IR, UV Sensor Revenue (million) Forecast, by Application 2019 & 2032
- Table 35: North Africa Ambient Light, IR, UV Sensor Revenue (million) Forecast, by Application 2019 & 2032
- Table 36: South Africa Ambient Light, IR, UV Sensor Revenue (million) Forecast, by Application 2019 & 2032
- Table 37: Rest of Middle East & Africa Ambient Light, IR, UV Sensor Revenue (million) Forecast, by Application 2019 & 2032
- Table 38: Global Ambient Light, IR, UV Sensor Revenue million Forecast, by Application 2019 & 2032
- Table 39: Global Ambient Light, IR, UV Sensor Revenue million Forecast, by Types 2019 & 2032
- Table 40: Global Ambient Light, IR, UV Sensor Revenue million Forecast, by Country 2019 & 2032
- Table 41: China Ambient Light, IR, UV Sensor Revenue (million) Forecast, by Application 2019 & 2032
- Table 42: India Ambient Light, IR, UV Sensor Revenue (million) Forecast, by Application 2019 & 2032
- Table 43: Japan Ambient Light, IR, UV Sensor Revenue (million) Forecast, by Application 2019 & 2032
- Table 44: South Korea Ambient Light, IR, UV Sensor Revenue (million) Forecast, by Application 2019 & 2032
- Table 45: ASEAN Ambient Light, IR, UV Sensor Revenue (million) Forecast, by Application 2019 & 2032
- Table 46: Oceania Ambient Light, IR, UV Sensor Revenue (million) Forecast, by Application 2019 & 2032
- Table 47: Rest of Asia Pacific Ambient Light, IR, UV Sensor Revenue (million) Forecast, by Application 2019 & 2032
Frequently Asked Questions
1. What is the projected Compound Annual Growth Rate (CAGR) of the Ambient Light, IR, UV Sensor?
The projected CAGR is approximately XX%.
2. Which companies are prominent players in the Ambient Light, IR, UV Sensor?
Key companies in the market include Texas Instruments, Ams, Honeywell, Silabs, Onsemi, Microchip Technology, Osram, Broadcom(Avago), Murata, Vishay, Drager, ST Microelectronics, LAPIS Semiconductor, Vernier, Scitec Instruments, Solar Light Company, Apogee.
3. What are the main segments of the Ambient Light, IR, UV Sensor?
The market segments include Application, Types.
4. Can you provide details about the market size?
The market size is estimated to be USD XXX million as of 2022.
5. What are some drivers contributing to market growth?
N/A
6. What are the notable trends driving market growth?
N/A
7. Are there any restraints impacting market growth?
N/A
8. Can you provide examples of recent developments in the market?
N/A
9. What pricing options are available for accessing the report?
Pricing options include single-user, multi-user, and enterprise licenses priced at USD 4900.00, USD 7350.00, and USD 9800.00 respectively.
10. Is the market size provided in terms of value or volume?
The market size is provided in terms of value, measured in million.
11. Are there any specific market keywords associated with the report?
Yes, the market keyword associated with the report is "Ambient Light, IR, UV Sensor," which aids in identifying and referencing the specific market segment covered.
12. How do I determine which pricing option suits my needs best?
The pricing options vary based on user requirements and access needs. Individual users may opt for single-user licenses, while businesses requiring broader access may choose multi-user or enterprise licenses for cost-effective access to the report.
13. Are there any additional resources or data provided in the Ambient Light, IR, UV Sensor report?
While the report offers comprehensive insights, it's advisable to review the specific contents or supplementary materials provided to ascertain if additional resources or data are available.
14. How can I stay updated on further developments or reports in the Ambient Light, IR, UV Sensor?
To stay informed about further developments, trends, and reports in the Ambient Light, IR, UV Sensor, consider subscribing to industry newsletters, following relevant companies and organizations, or regularly checking reputable industry news sources and publications.
Methodology
Step 1 - Identification of Relevant Samples Size from Population Database


Step 2 - Approaches for Defining Global Market Size (Value, Volume* & Price*)

Note*: In applicable scenarios
Step 3 - Data Sources
Primary Research
- Web Analytics
- Survey Reports
- Research Institute
- Latest Research Reports
- Opinion Leaders
Secondary Research
- Annual Reports
- White Paper
- Latest Press Release
- Industry Association
- Paid Database
- Investor Presentations

Step 4 - Data Triangulation
Involves using different sources of information in order to increase the validity of a study
These sources are likely to be stakeholders in a program - participants, other researchers, program staff, other community members, and so on.
Then we put all data in single framework & apply various statistical tools to find out the dynamic on the market.
During the analysis stage, feedback from the stakeholder groups would be compared to determine areas of agreement as well as areas of divergence


