

Key Insights
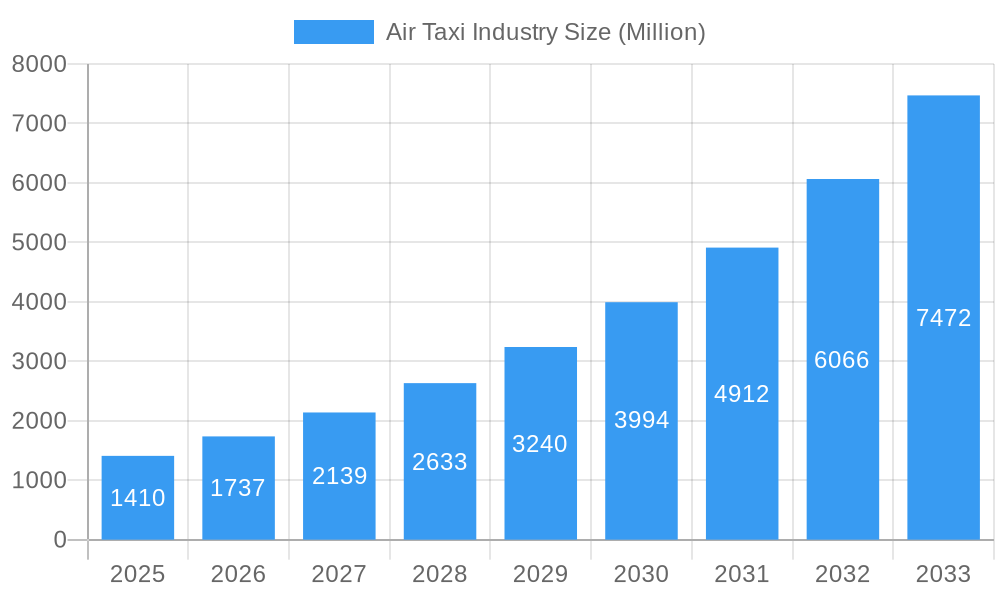
The air taxi industry is poised for explosive growth, projected to reach a market size of $1.41 billion in 2025 and experience a compound annual growth rate (CAGR) of 23.32% from 2025 to 2033. Several factors drive this expansion. Increasing urbanization and traffic congestion in major cities create a strong demand for faster, more efficient transportation alternatives. Technological advancements in electric vertical takeoff and landing (eVTOL) aircraft, coupled with improvements in autonomous flight systems and battery technology, are making air taxis a more viable and cost-effective solution. Furthermore, supportive government regulations and increasing investments from both established aerospace companies and emerging startups are fueling industry development. The market is segmented by mode of operation, with piloted and autonomous air taxis representing distinct yet interconnected segments. While piloted air taxis currently dominate, the autonomous segment is expected to witness substantial growth as technology matures and regulatory approvals are secured. Competition is intense, with key players including Textron Inc, Lilium GmbH, Joby Aero Inc, and Airbus SE vying for market share. Regional variations in adoption rates are anticipated, with North America and Europe leading the early stages due to robust regulatory frameworks and advanced technological infrastructure. However, the Asia-Pacific region presents significant long-term growth potential given its dense population centers and burgeoning economies.
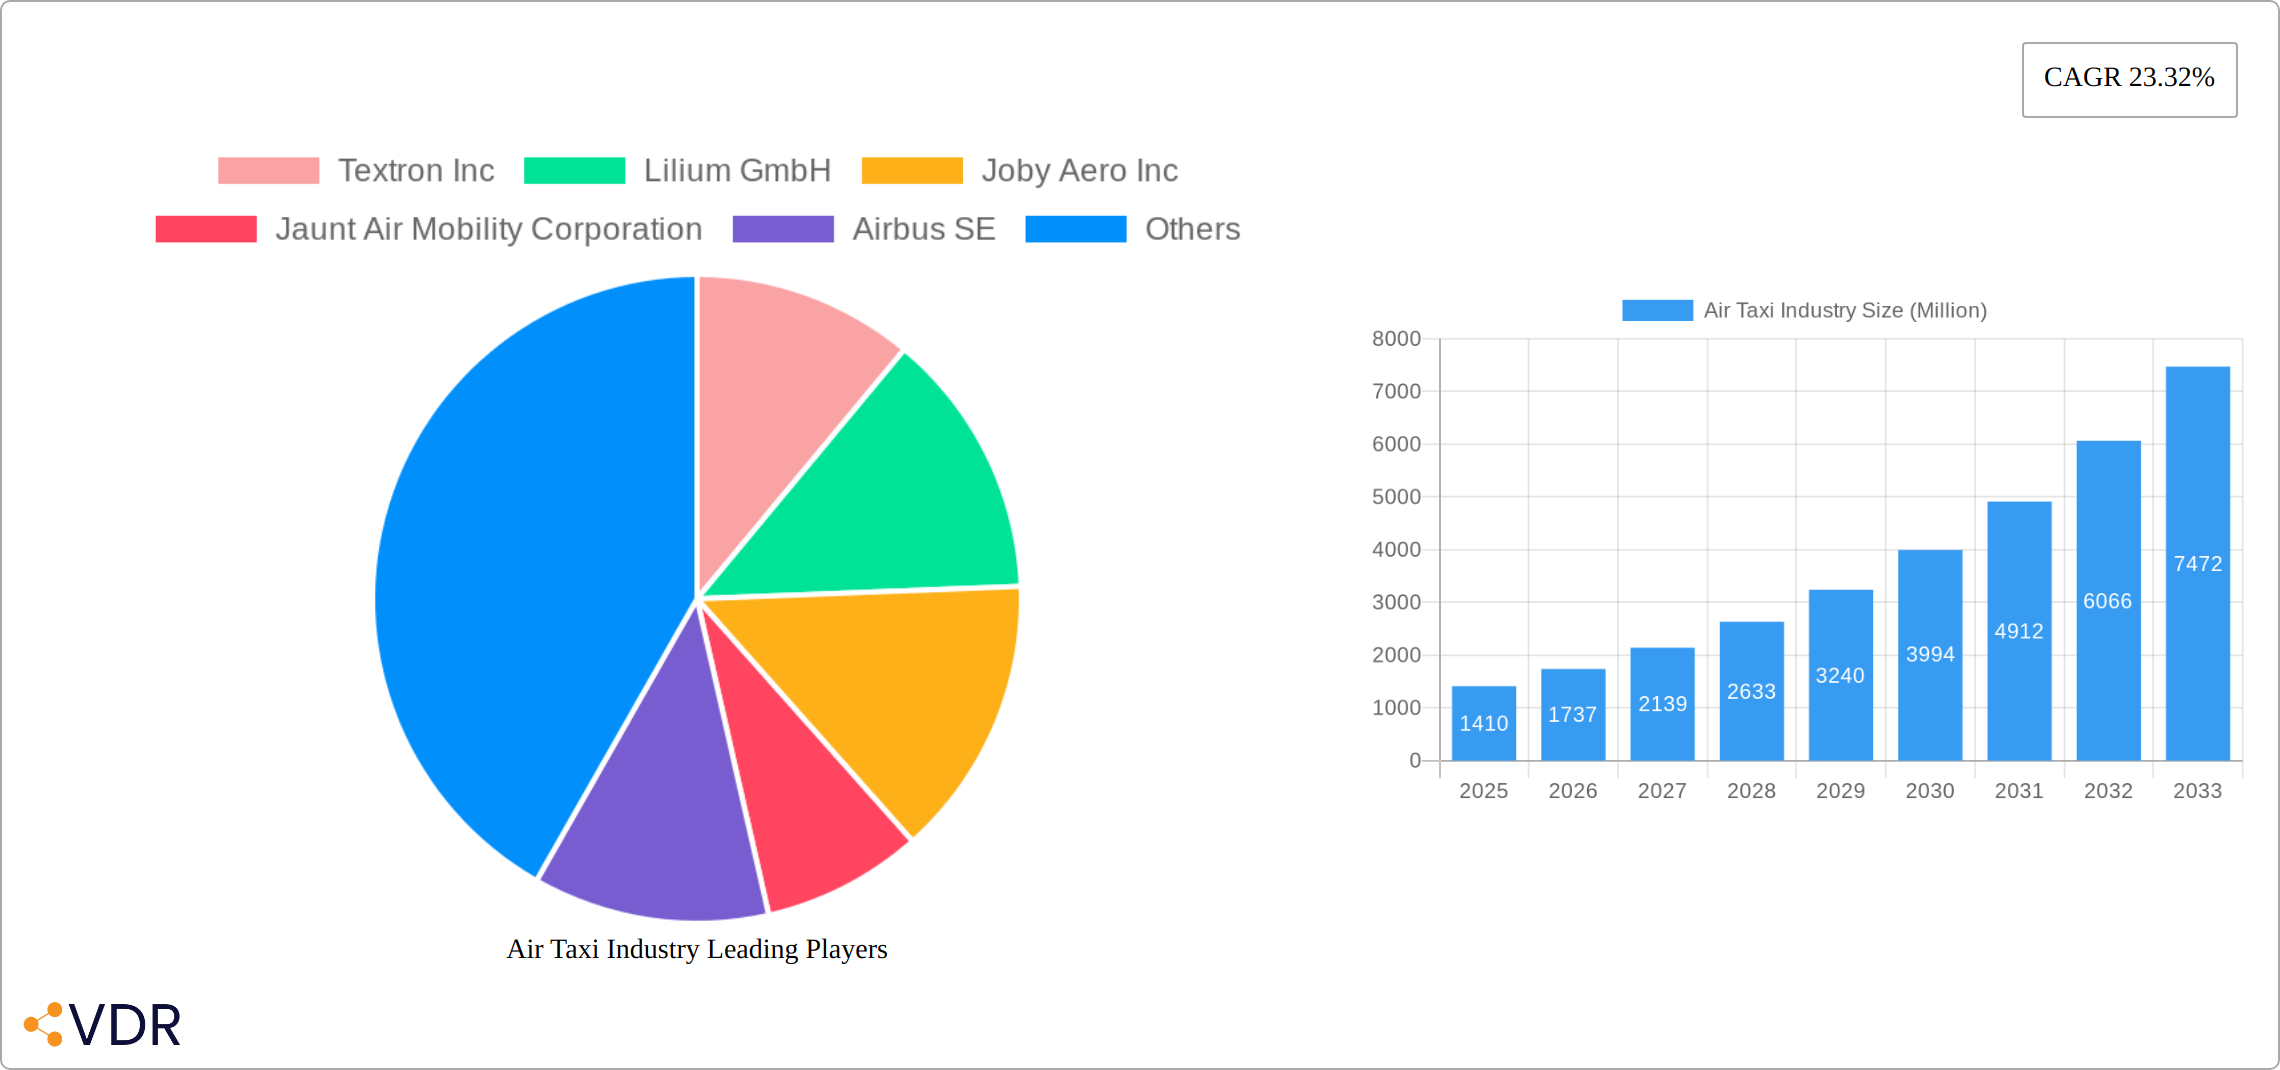
Air Taxi Industry Market Size (In Billion)
The industry faces certain challenges. High initial investment costs for aircraft development and infrastructure are a major barrier to entry. Safety concerns, particularly regarding autonomous flight operations, require careful consideration and stringent safety protocols. Public acceptance and overcoming potential anxieties surrounding air taxi technology are also crucial for widespread adoption. Overcoming regulatory hurdles and ensuring seamless integration with existing air traffic management systems are essential for the safe and efficient operation of air taxis. Despite these challenges, the long-term outlook for the air taxi industry remains exceptionally positive, promising to revolutionize urban transportation and create new economic opportunities. The market's trajectory will be significantly influenced by the rate of technological innovation, regulatory approvals, and public acceptance. Strategic partnerships and mergers and acquisitions are also expected to shape the competitive landscape in the years to come.
Air Taxi Industry Company Market Share
Air Taxi Industry Market Report: 2019-2033
This comprehensive report provides a detailed analysis of the burgeoning air taxi industry, encompassing market dynamics, growth trends, competitive landscapes, and future outlook. With a study period spanning 2019-2033, a base year of 2025, and a forecast period of 2025-2033, this report offers invaluable insights for industry professionals, investors, and strategic decision-makers. The report segments the market by Mode of Operation (Piloted and Autonomous) providing a granular understanding of the parent and child markets. The total market value is predicted to reach xx Million by 2033.
Air Taxi Industry Market Dynamics & Structure
The air taxi market is characterized by high dynamism, driven by technological advancements, evolving regulatory landscapes, and increasing investments. Market concentration is currently low, with several players vying for dominance. However, consolidation through mergers and acquisitions (M&A) is expected to increase in the coming years. The study period saw xx M&A deals, with a predicted increase to xx deals by 2033. Technological innovation, particularly in battery technology and autonomous flight systems, is a primary driver.
- Market Concentration: Low, with fragmented players. Market share is expected to consolidate by 2033.
- Technological Innovation: Significant advancements in electric propulsion, autonomous flight control, and air traffic management systems are driving growth.
- Regulatory Frameworks: Varying regulatory landscapes across countries present both opportunities and challenges. Harmonization efforts are crucial for industry expansion.
- Competitive Product Substitutes: Traditional helicopter services and ride-sharing platforms remain competitive.
- End-User Demographics: Primarily targeting high-net-worth individuals and businesses for initial adoption, with potential expansion to a broader consumer base.
- M&A Trends: Increasing M&A activity suggests consolidation and strategic partnerships.
Air Taxi Industry Growth Trends & Insights
The air taxi market is experiencing rapid growth, driven by increasing demand for faster and more efficient urban transportation. The market size increased from xx Million in 2019 to xx Million in 2024, with a projected CAGR of xx% from 2025 to 2033. Market penetration is currently low but is expected to increase significantly as technology matures and regulatory frameworks evolve. Technological disruptions such as the development of advanced air mobility (AAM) infrastructure and improved battery technology are key growth catalysts. Consumer behavior shifts towards a preference for convenience and sustainable transport options are also fueling market expansion. Adoption rates are expected to increase significantly due to factors like rising urban populations and traffic congestion in major cities.
Dominant Regions, Countries, or Segments in Air Taxi Industry
The North American and European markets are currently leading the air taxi industry, driven by strong regulatory support, substantial investments, and the presence of key players. Within the Mode of Operation segment, the piloted segment currently holds the largest market share due to the existing technological maturity and regulatory approval in this segment, while the autonomous segment is expected to experience exponential growth over the forecast period due to ongoing advancements in autonomous flight technology.
- North America: High growth driven by strong government support and significant investments.
- Europe: Significant regulatory developments and technological advancements.
- Asia-Pacific: Emerging market with high growth potential due to increasing urbanization and investment in infrastructure.
- Piloted Segment: Larger market share currently due to technological maturity and regulatory approval.
- Autonomous Segment: High growth potential, but currently hampered by technology and regulatory hurdles.
Air Taxi Industry Product Landscape
The air taxi industry showcases a dynamic range of aircraft designs, from compact single-passenger vehicles to larger models accommodating multiple passengers. Key features include electric propulsion systems minimizing emissions, sophisticated flight control systems enabling autonomous operation, and integrated safety features prioritizing passenger comfort and security. These vehicles offer compelling unique selling propositions centered on speed, convenience, and sustainability, presenting a viable alternative to conventional ground transportation. Ongoing technological advancements are focused on expanding flight range, increasing payload capacity, and enhancing the overall efficiency of electric vertical takeoff and landing (eVTOL) aircraft. This includes innovations in battery technology, motor design, and aerodynamic optimization for improved performance and reduced energy consumption.
Key Drivers, Barriers & Challenges in Air Taxi Industry
Key Drivers:
- Rapid advancements in eVTOL technology, including improved battery technology, lighter-weight materials, and more efficient propulsion systems.
- Escalating urban congestion and the growing demand for significantly faster and more efficient inter-city and intra-city transportation options.
- Increased government support and substantial investments in Advanced Air Mobility (AAM) infrastructure, including vertiports and air traffic management systems.
- Heightened environmental concerns and the rising global demand for sustainable and eco-friendly transportation solutions.
Key Challenges & Restraints:
- Navigating complex and evolving regulatory hurdles and certification processes, which often involve lengthy delays and substantial complexities.
- Addressing the high development costs associated with eVTOL aircraft and the need to achieve economies of scale to make the technology commercially viable.
- Mitigating safety concerns related to autonomous flight operations and ensuring the highest levels of passenger safety and reliability.
- Overcoming supply chain limitations and potential disruptions, particularly concerning the availability of critical materials such as rare earth elements for batteries, which can significantly impact production and development timelines.
- Public acceptance and addressing potential concerns regarding noise pollution and community impact.
Emerging Opportunities in Air Taxi Industry
- Significant untapped market potential in developing economies experiencing rapid urbanization and a growing need for efficient transportation solutions.
- Seamless integration with existing transportation networks, creating multi-modal transport systems that offer passengers a comprehensive travel experience.
- Expanding applications beyond passenger transport to encompass cargo delivery, emergency medical services, and other specialized transportation needs.
- Strategic development of dedicated air taxi hubs and comprehensive charging infrastructure to support the growing network of eVTOL aircraft.
- Development of innovative business models, such as ride-sharing platforms and subscription services, to make air taxi services more accessible and affordable.
Growth Accelerators in the Air Taxi Industry Industry
Significant long-term growth will be driven by breakthroughs in battery technology, increasing flight range and payload capacity, while strategic partnerships between aircraft manufacturers, infrastructure developers, and technology providers will play a crucial role in accelerating market penetration. Expanding the adoption across various sectors and geographical locations will further fuel market expansion.
Key Players Shaping the Air Taxi Industry Market
Notable Milestones in Air Taxi Industry Sector
- 2020: Joby Aero secures FAA G-1 certification, a significant step towards commercial operation.
- 2021: Lilium completes the first passenger flight of its five-seater aircraft, demonstrating the viability of larger-scale eVTOL aircraft.
- 2022: Volocopter receives type certification for its VoloCity eVTOL, paving the way for commercial operations in select markets.
- 2023: Wisk Aero conducts its first public demonstration flight, showcasing the progress of autonomous eVTOL technology.
- 2024: Airbus completes successful testing of CityAirbus NextGen, highlighting ongoing advancements in eVTOL design and performance. (Further milestones to be added based on actual data)
In-Depth Air Taxi Industry Market Outlook
The future of the air taxi industry presents extraordinary potential for growth and innovation. Continued technological advancements, supportive regulatory frameworks, and sustained investment will drive substantial market expansion. The industry is poised for rapid growth, with significant opportunities for companies capable of overcoming technological challenges, securing necessary regulatory approvals, and establishing robust business models within this nascent sector. The projected market value, estimated to reach xx Million by 2033, underscores the immense growth potential and attractiveness of this transformative industry. Success will depend on factors like effective partnerships, strategic collaborations, and a focus on sustainable and scalable operations.
Air Taxi Industry Segmentation
-
1. Mode of Operation
- 1.1. Piloted
- 1.2. Autonomous
Air Taxi Industry Segmentation By Geography
-
1. North America
- 1.1. United States
- 1.2. Canada
-
2. Europe
- 2.1. Germany
- 2.2. United Kingdom
- 2.3. France
- 2.4. Russia
- 2.5. Rest of Europe
-
3. Asia Pacific
- 3.1. India
- 3.2. China
- 3.3. Japan
- 3.4. South Korea
- 3.5. Australia
- 3.6. Rest of Asia Pacific
-
4. Latin America
- 4.1. Brazil
- 4.2. Mexico
- 4.3. Rest of Latin America
-
5. Middle East and Africa
- 5.1. Saudi Arabia
- 5.2. Egypt
- 5.3. Israel
- 5.4. Rest of Middle East and Africa
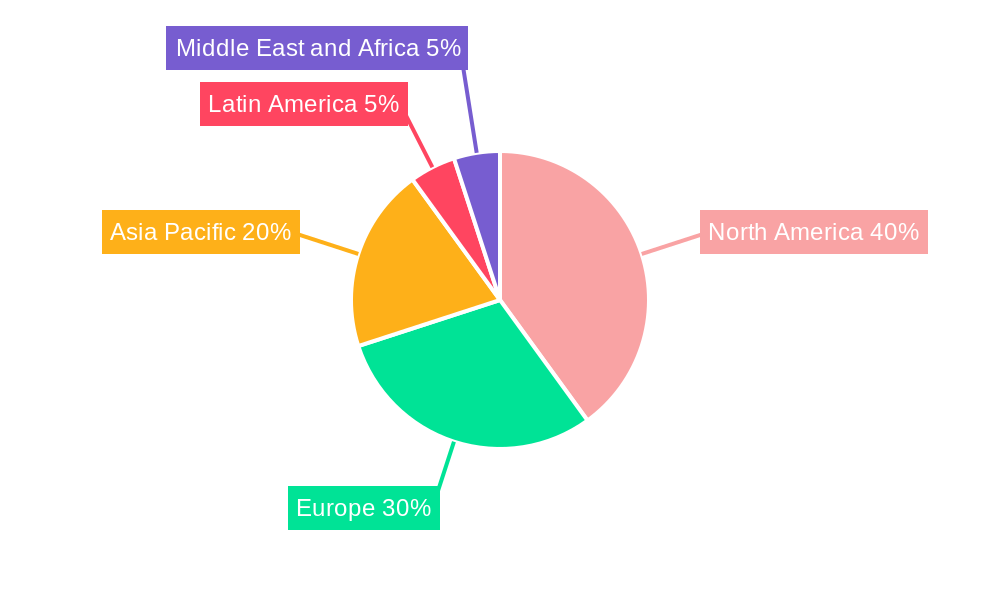
Air Taxi Industry Regional Market Share
Geographic Coverage of Air Taxi Industry
Air Taxi Industry REPORT HIGHLIGHTS
| Aspects | Details |
|---|---|
| Study Period | 2020-2034 |
| Base Year | 2025 |
| Estimated Year | 2026 |
| Forecast Period | 2026-2034 |
| Historical Period | 2020-2025 |
| Growth Rate | CAGR of 23.32% from 2020-2034 |
| Segmentation |
|
Table of Contents
- 1. Introduction
- 1.1. Research Scope
- 1.2. Market Segmentation
- 1.3. Research Objective
- 1.4. Definitions and Assumptions
- 2. Executive Summary
- 2.1. Market Snapshot
- 3. Market Dynamics
- 3.1. Market Drivers
- 3.2. Market Restrains
- 3.3. Market Trends
- 3.4. Market Opportunities
- 4. Market Factor Analysis
- 4.1. Porters Five Forces
- 4.1.1. Bargaining Power of Suppliers
- 4.1.2. Bargaining Power of Buyers
- 4.1.3. Threat of New Entrants
- 4.1.4. Threat of Substitutes
- 4.1.5. Competitive Rivalry
- 4.2. PESTEL analysis
- 4.3. BCG Analysis
- 4.3.1. Stars (High Growth, High Market Share)
- 4.3.2. Cash Cows (Low Growth, High Market Share)
- 4.3.3. Question Mark (High Growth, Low Market Share)
- 4.3.4. Dogs (Low Growth, Low Market Share)
- 4.4. Ansoff Matrix Analysis
- 4.5. Supply Chain Analysis
- 4.6. Regulatory Landscape
- 4.7. Current Market Potential and Opportunity Assessment (TAM–SAM–SOM Framework)
- 4.8. VDR Analyst Note
- 4.1. Porters Five Forces
- 5. Market Analysis, Insights and Forecast 2021-2033
- 5.1. Market Analysis, Insights and Forecast - by Mode of Operation
- 5.1.1. Piloted
- 5.1.2. Autonomous
- 5.2. Market Analysis, Insights and Forecast - by Region
- 5.2.1. North America
- 5.2.2. Europe
- 5.2.3. Asia Pacific
- 5.2.4. Latin America
- 5.2.5. Middle East and Africa
- 5.1. Market Analysis, Insights and Forecast - by Mode of Operation
- 6. Global Air Taxi Industry Analysis, Insights and Forecast, 2021-2033
- 6.1. Market Analysis, Insights and Forecast - by Mode of Operation
- 6.1.1. Piloted
- 6.1.2. Autonomous
- 6.1. Market Analysis, Insights and Forecast - by Mode of Operation
- 7. North America Air Taxi Industry Analysis, Insights and Forecast, 2021-2033
- 7.1. Market Analysis, Insights and Forecast - by Mode of Operation
- 7.1.1. Piloted
- 7.1.2. Autonomous
- 7.1. Market Analysis, Insights and Forecast - by Mode of Operation
- 8. Europe Air Taxi Industry Analysis, Insights and Forecast, 2021-2033
- 8.1. Market Analysis, Insights and Forecast - by Mode of Operation
- 8.1.1. Piloted
- 8.1.2. Autonomous
- 8.1. Market Analysis, Insights and Forecast - by Mode of Operation
- 9. Asia Pacific Air Taxi Industry Analysis, Insights and Forecast, 2021-2033
- 9.1. Market Analysis, Insights and Forecast - by Mode of Operation
- 9.1.1. Piloted
- 9.1.2. Autonomous
- 9.1. Market Analysis, Insights and Forecast - by Mode of Operation
- 10. Latin America Air Taxi Industry Analysis, Insights and Forecast, 2021-2033
- 10.1. Market Analysis, Insights and Forecast - by Mode of Operation
- 10.1.1. Piloted
- 10.1.2. Autonomous
- 10.1. Market Analysis, Insights and Forecast - by Mode of Operation
- 11. Middle East and Africa Air Taxi Industry Analysis, Insights and Forecast, 2021-2033
- 11.1. Market Analysis, Insights and Forecast - by Mode of Operation
- 11.1.1. Piloted
- 11.1.2. Autonomous
- 11.1. Market Analysis, Insights and Forecast - by Mode of Operation
- 12. Competitive Analysis
- 12.1. Company Profiles
- 12.1.1 Textron Inc
- 12.1.1.1. Company Overview
- 12.1.1.2. Products
- 12.1.1.3. Company Financials
- 12.1.1.4. SWOT Analysis
- 12.1.2 Lilium GmbH
- 12.1.2.1. Company Overview
- 12.1.2.2. Products
- 12.1.2.3. Company Financials
- 12.1.2.4. SWOT Analysis
- 12.1.3 Joby Aero Inc
- 12.1.3.1. Company Overview
- 12.1.3.2. Products
- 12.1.3.3. Company Financials
- 12.1.3.4. SWOT Analysis
- 12.1.4 Jaunt Air Mobility Corporation
- 12.1.4.1. Company Overview
- 12.1.4.2. Products
- 12.1.4.3. Company Financials
- 12.1.4.4. SWOT Analysis
- 12.1.5 Airbus SE
- 12.1.5.1. Company Overview
- 12.1.5.2. Products
- 12.1.5.3. Company Financials
- 12.1.5.4. SWOT Analysis
- 12.1.6 Hyundai Motor Company
- 12.1.6.1. Company Overview
- 12.1.6.2. Products
- 12.1.6.3. Company Financials
- 12.1.6.4. SWOT Analysis
- 12.1.7 Volocopter GmbH
- 12.1.7.1. Company Overview
- 12.1.7.2. Products
- 12.1.7.3. Company Financials
- 12.1.7.4. SWOT Analysis
- 12.1.8 Wisk Aero LL
- 12.1.8.1. Company Overview
- 12.1.8.2. Products
- 12.1.8.3. Company Financials
- 12.1.8.4. SWOT Analysis
- 12.1.9 Guangzhou EHang Intelligent Technology Co Ltd
- 12.1.9.1. Company Overview
- 12.1.9.2. Products
- 12.1.9.3. Company Financials
- 12.1.9.4. SWOT Analysis
- 12.1.10 The Boeing Company
- 12.1.10.1. Company Overview
- 12.1.10.2. Products
- 12.1.10.3. Company Financials
- 12.1.10.4. SWOT Analysis
- 12.1.1 Textron Inc
- 12.2. Market Entropy
- 12.2.1 Company's Key Areas Served
- 12.2.2 Recent Developments
- 12.3. Company Market Share Analysis 2025
- 12.3.1 Top 5 Companies Market Share Analysis
- 12.3.2 Top 3 Companies Market Share Analysis
- 12.4. List of Potential Customers
- 13. Research Methodology
List of Figures
- Figure 1: Global Air Taxi Industry Revenue Breakdown (Million, %) by Region 2025 & 2033
- Figure 2: North America Air Taxi Industry Revenue (Million), by Mode of Operation 2025 & 2033
- Figure 3: North America Air Taxi Industry Revenue Share (%), by Mode of Operation 2025 & 2033
- Figure 4: North America Air Taxi Industry Revenue (Million), by Country 2025 & 2033
- Figure 5: North America Air Taxi Industry Revenue Share (%), by Country 2025 & 2033
- Figure 6: Europe Air Taxi Industry Revenue (Million), by Mode of Operation 2025 & 2033
- Figure 7: Europe Air Taxi Industry Revenue Share (%), by Mode of Operation 2025 & 2033
- Figure 8: Europe Air Taxi Industry Revenue (Million), by Country 2025 & 2033
- Figure 9: Europe Air Taxi Industry Revenue Share (%), by Country 2025 & 2033
- Figure 10: Asia Pacific Air Taxi Industry Revenue (Million), by Mode of Operation 2025 & 2033
- Figure 11: Asia Pacific Air Taxi Industry Revenue Share (%), by Mode of Operation 2025 & 2033
- Figure 12: Asia Pacific Air Taxi Industry Revenue (Million), by Country 2025 & 2033
- Figure 13: Asia Pacific Air Taxi Industry Revenue Share (%), by Country 2025 & 2033
- Figure 14: Latin America Air Taxi Industry Revenue (Million), by Mode of Operation 2025 & 2033
- Figure 15: Latin America Air Taxi Industry Revenue Share (%), by Mode of Operation 2025 & 2033
- Figure 16: Latin America Air Taxi Industry Revenue (Million), by Country 2025 & 2033
- Figure 17: Latin America Air Taxi Industry Revenue Share (%), by Country 2025 & 2033
- Figure 18: Middle East and Africa Air Taxi Industry Revenue (Million), by Mode of Operation 2025 & 2033
- Figure 19: Middle East and Africa Air Taxi Industry Revenue Share (%), by Mode of Operation 2025 & 2033
- Figure 20: Middle East and Africa Air Taxi Industry Revenue (Million), by Country 2025 & 2033
- Figure 21: Middle East and Africa Air Taxi Industry Revenue Share (%), by Country 2025 & 2033
List of Tables
- Table 1: Global Air Taxi Industry Revenue Million Forecast, by Mode of Operation 2020 & 2033
- Table 2: Global Air Taxi Industry Revenue Million Forecast, by Region 2020 & 2033
- Table 3: Global Air Taxi Industry Revenue Million Forecast, by Mode of Operation 2020 & 2033
- Table 4: Global Air Taxi Industry Revenue Million Forecast, by Country 2020 & 2033
- Table 5: United States Air Taxi Industry Revenue (Million) Forecast, by Application 2020 & 2033
- Table 6: Canada Air Taxi Industry Revenue (Million) Forecast, by Application 2020 & 2033
- Table 7: Global Air Taxi Industry Revenue Million Forecast, by Mode of Operation 2020 & 2033
- Table 8: Global Air Taxi Industry Revenue Million Forecast, by Country 2020 & 2033
- Table 9: Germany Air Taxi Industry Revenue (Million) Forecast, by Application 2020 & 2033
- Table 10: United Kingdom Air Taxi Industry Revenue (Million) Forecast, by Application 2020 & 2033
- Table 11: France Air Taxi Industry Revenue (Million) Forecast, by Application 2020 & 2033
- Table 12: Russia Air Taxi Industry Revenue (Million) Forecast, by Application 2020 & 2033
- Table 13: Rest of Europe Air Taxi Industry Revenue (Million) Forecast, by Application 2020 & 2033
- Table 14: Global Air Taxi Industry Revenue Million Forecast, by Mode of Operation 2020 & 2033
- Table 15: Global Air Taxi Industry Revenue Million Forecast, by Country 2020 & 2033
- Table 16: India Air Taxi Industry Revenue (Million) Forecast, by Application 2020 & 2033
- Table 17: China Air Taxi Industry Revenue (Million) Forecast, by Application 2020 & 2033
- Table 18: Japan Air Taxi Industry Revenue (Million) Forecast, by Application 2020 & 2033
- Table 19: South Korea Air Taxi Industry Revenue (Million) Forecast, by Application 2020 & 2033
- Table 20: Australia Air Taxi Industry Revenue (Million) Forecast, by Application 2020 & 2033
- Table 21: Rest of Asia Pacific Air Taxi Industry Revenue (Million) Forecast, by Application 2020 & 2033
- Table 22: Global Air Taxi Industry Revenue Million Forecast, by Mode of Operation 2020 & 2033
- Table 23: Global Air Taxi Industry Revenue Million Forecast, by Country 2020 & 2033
- Table 24: Brazil Air Taxi Industry Revenue (Million) Forecast, by Application 2020 & 2033
- Table 25: Mexico Air Taxi Industry Revenue (Million) Forecast, by Application 2020 & 2033
- Table 26: Rest of Latin America Air Taxi Industry Revenue (Million) Forecast, by Application 2020 & 2033
- Table 27: Global Air Taxi Industry Revenue Million Forecast, by Mode of Operation 2020 & 2033
- Table 28: Global Air Taxi Industry Revenue Million Forecast, by Country 2020 & 2033
- Table 29: Saudi Arabia Air Taxi Industry Revenue (Million) Forecast, by Application 2020 & 2033
- Table 30: Egypt Air Taxi Industry Revenue (Million) Forecast, by Application 2020 & 2033
- Table 31: Israel Air Taxi Industry Revenue (Million) Forecast, by Application 2020 & 2033
- Table 32: Rest of Middle East and Africa Air Taxi Industry Revenue (Million) Forecast, by Application 2020 & 2033
Frequently Asked Questions
1. What is the projected Compound Annual Growth Rate (CAGR) of the Air Taxi Industry?
The projected CAGR is approximately 23.32%.
2. Which companies are prominent players in the Air Taxi Industry?
Key companies in the market include Textron Inc, Lilium GmbH, Joby Aero Inc, Jaunt Air Mobility Corporation, Airbus SE, Hyundai Motor Company, Volocopter GmbH, Wisk Aero LL, Guangzhou EHang Intelligent Technology Co Ltd, The Boeing Company.
3. What are the main segments of the Air Taxi Industry?
The market segments include Mode of Operation.
4. Can you provide details about the market size?
The market size is estimated to be USD 1.41 Million as of 2022.
5. What are some drivers contributing to market growth?
N/A
6. What are the notable trends driving market growth?
Piloted Segment to Dominate Market Share During the Forecast Period.
7. Are there any restraints impacting market growth?
N/A
8. Can you provide examples of recent developments in the market?
N/A
9. What pricing options are available for accessing the report?
Pricing options include single-user, multi-user, and enterprise licenses priced at USD 4750, USD 5250, and USD 8750 respectively.
10. Is the market size provided in terms of value or volume?
The market size is provided in terms of value, measured in Million.
11. Are there any specific market keywords associated with the report?
Yes, the market keyword associated with the report is "Air Taxi Industry," which aids in identifying and referencing the specific market segment covered.
12. How do I determine which pricing option suits my needs best?
The pricing options vary based on user requirements and access needs. Individual users may opt for single-user licenses, while businesses requiring broader access may choose multi-user or enterprise licenses for cost-effective access to the report.
13. Are there any additional resources or data provided in the Air Taxi Industry report?
While the report offers comprehensive insights, it's advisable to review the specific contents or supplementary materials provided to ascertain if additional resources or data are available.
14. How can I stay updated on further developments or reports in the Air Taxi Industry?
To stay informed about further developments, trends, and reports in the Air Taxi Industry, consider subscribing to industry newsletters, following relevant companies and organizations, or regularly checking reputable industry news sources and publications.
Methodology
Step 1 - Identification of Relevant Samples Size from Population Database


Step 2 - Approaches for Defining Global Market Size (Value, Volume* & Price*)

Note*: In applicable scenarios
Step 3 - Data Sources
Primary Research
- Web Analytics
- Survey Reports
- Research Institute
- Latest Research Reports
- Opinion Leaders
Secondary Research
- Annual Reports
- White Paper
- Latest Press Release
- Industry Association
- Paid Database
- Investor Presentations

Step 4 - Data Triangulation
Involves using different sources of information in order to increase the validity of a study
These sources are likely to be stakeholders in a program - participants, other researchers, program staff, other community members, and so on.
Then we put all data in single framework & apply various statistical tools to find out the dynamic on the market.
During the analysis stage, feedback from the stakeholder groups would be compared to determine areas of agreement as well as areas of divergence