

Key Insights
The African lubricants market, valued at $2.52 billion in 2024, is poised for substantial expansion. This growth is primarily propelled by a rapidly developing automotive sector, increasing industrialization, and significant infrastructure projects across the continent. Key market segments comprise passenger vehicles, commercial vehicles, and motorcycles, with engine oils, greases, and hydraulic fluids representing the dominant product categories. South Africa leads the market, followed by Nigeria, Egypt, and Morocco, attributed to their comparatively robust economies and higher vehicle ownership. The demand for high-performance lubricants designed for advanced engine technologies and adherence to stringent environmental regulations further bolsters market expansion. However, potential headwinds include volatile crude oil prices, logistical challenges in certain regions, and the prevalence of counterfeit products.
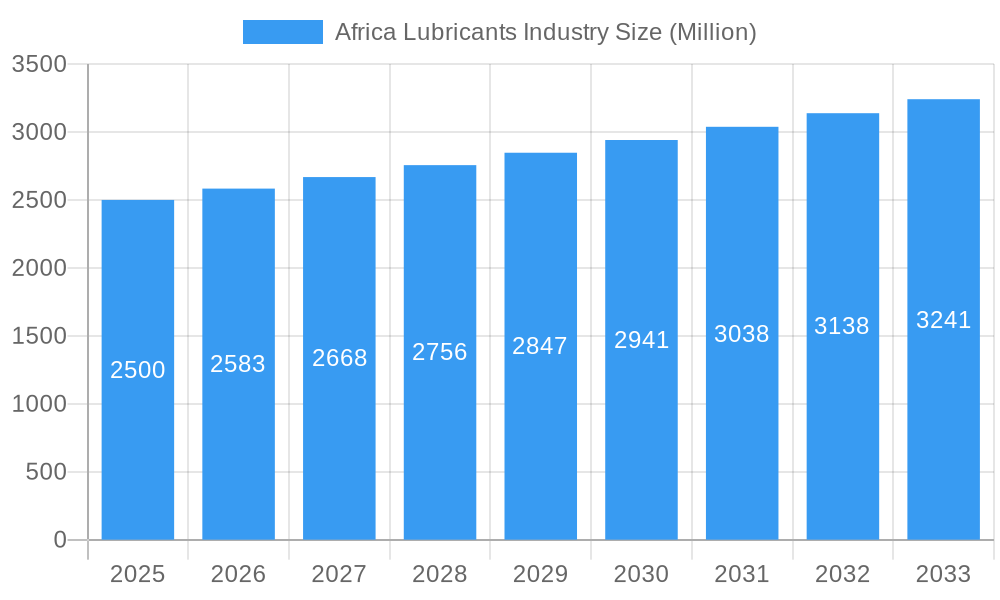
Africa Lubricants Industry Market Size (In Billion)
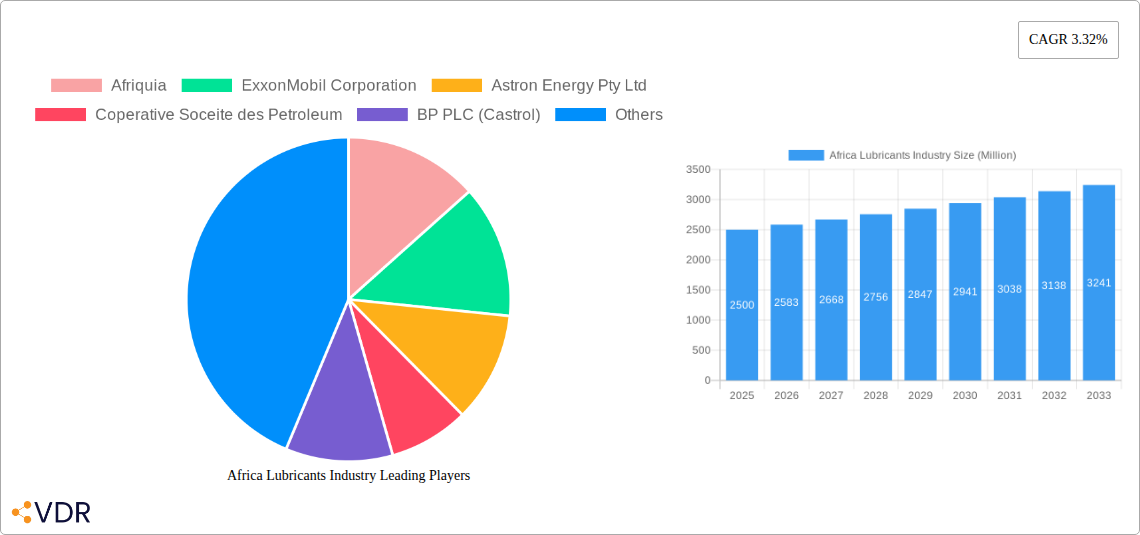
The forecast period, extending from 2024 to 2033, anticipates a compound annual growth rate (CAGR) of 3.43%, signaling robust market development. Major industry players, including ExxonMobil, TotalEnergies, Shell, and regional entities such as Afriquia and Engen Petroleum, are actively pursuing market leadership through strategic alliances, product innovation, and enhanced distribution capabilities. Future market trajectory will be shaped by sustained economic growth in African nations, improvements in logistics and infrastructure, and the successful adoption of sustainable lubricant practices. Government policies focused on emission control and environmental sustainability, alongside evolving consumer preferences for premium and eco-friendly lubricants, will also significantly influence growth.
Africa Lubricants Industry Company Market Share
Africa Lubricants Industry: Market Report 2019-2033
This comprehensive report provides a detailed analysis of the Africa lubricants industry, encompassing market dynamics, growth trends, key players, and future outlook. The study period spans 2019-2033, with a base year of 2025 and a forecast period of 2025-2033. The report segments the market by vehicle type (commercial vehicles, motorcycles, passenger vehicles), product type (engine oils, greases, hydraulic fluids, transmission & gear oils), and country (Egypt, Morocco, Nigeria, South Africa, Rest of Africa). Discover key insights to navigate this dynamic market and capitalize on lucrative opportunities.
Africa Lubricants Industry Market Dynamics & Structure
The African lubricants market is characterized by a mix of multinational corporations and regional players, resulting in a moderately concentrated market structure. Market share is largely held by established players like ExxonMobil Corporation, BP PLC (Castrol), TotalEnergies, and Royal Dutch Shell PLC, while regional players like Afriquia, Astron Energy Pty Ltd, Coperative Soceite des Petroleum, Misr Petroleum, Engen Petroleum Ltd, and OLA Energy compete fiercely for market share.
Technological innovation is driven by the need for improved fuel efficiency, emission reduction, and enhanced engine performance. However, challenges remain, including the high cost of implementing new technologies and limited access to advanced research and development resources in some regions. Regulatory frameworks vary across African countries, impacting product standards and import/export regulations. The market also faces competition from substitute products, including bio-lubricants and synthetic oils.
- Market Concentration: Moderately concentrated, with major players holding significant shares.
- Technological Innovation: Driven by fuel efficiency, emission standards, and performance improvements; hindered by cost and access to resources.
- Regulatory Landscape: Diverse across African countries, impacting product standards and trade.
- Competitive Substitutes: Bio-lubricants and synthetic oils pose a competitive threat.
- End-User Demographics: A growing vehicle parc and increasing industrialization drive demand.
- M&A Activity: xx M&A deals in the past 5 years, with a focus on expanding distribution networks and product portfolios. (Market share data unavailable, xx predicted).
Africa Lubricants Industry Growth Trends & Insights
The Africa lubricants market experienced significant growth during the historical period (2019-2024), driven by factors including rising vehicle ownership, expanding industrialization, and infrastructure development. The market size is projected to reach xx Million units in 2025, demonstrating strong growth potential. The CAGR during the forecast period (2025-2033) is estimated to be xx%, driven by increasing demand from the automotive, industrial, and agricultural sectors. Market penetration varies across different regions and segments, with higher penetration in more developed countries. Technological disruptions, such as the adoption of electric vehicles, present both challenges and opportunities. Consumer behavior is shifting towards higher-quality, environmentally friendly lubricants.
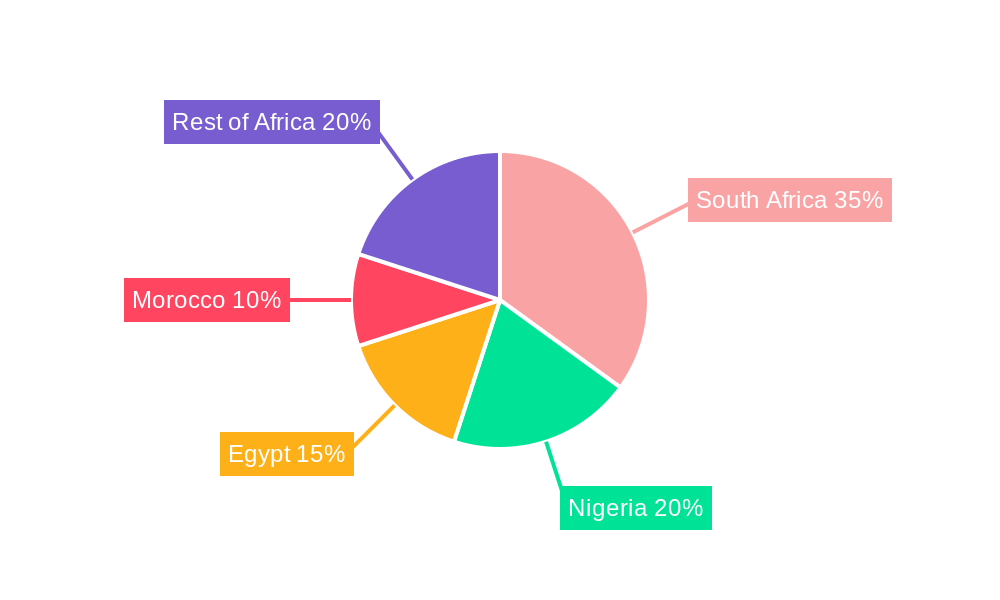
Dominant Regions, Countries, or Segments in Africa Lubricants Industry
South Africa holds the largest market share in the Africa lubricants industry, driven by its advanced economy, substantial vehicle parc, and well-established distribution network. Nigeria and Egypt also represent significant markets due to their large populations and expanding industrial sectors. The commercial vehicle segment dominates overall volume due to the heavy-duty nature of transport operations across the continent. Engine oils represent the largest product segment due to their widespread use in various applications.
- Key Drivers:
- South Africa: Advanced economy, substantial vehicle parc, robust infrastructure.
- Nigeria & Egypt: Large populations, expanding industrial sectors, growing vehicle ownership.
- Commercial Vehicles: High demand from transportation and logistics sectors.
- Engine Oils: Widespread application across automotive and industrial sectors.
- Dominance Factors: Market size, economic growth, infrastructure development, vehicle ownership rates.
- Growth Potential: High growth potential in less developed African countries due to infrastructure projects and increasing vehicle sales.
Africa Lubricants Industry Product Landscape
The product landscape is characterized by a range of conventional and synthetic lubricants tailored to specific vehicle types and applications. Innovations focus on improving fuel efficiency, extending oil life, and enhancing performance in extreme operating conditions. Unique selling propositions include enhanced viscosity modifiers, improved oxidation resistance, and specialized additives for particular engine types. Technological advancements include the development of bio-based lubricants and environmentally friendly formulations.
Key Drivers, Barriers & Challenges in Africa Lubricants Industry
Key Drivers:
- Growing vehicle population, particularly in developing nations
- Expanding industrialization and infrastructure development
- Increased government focus on improving transportation efficiency
Key Challenges & Restraints:
- Price volatility of base oils and raw materials
- Counterfeit lubricant products impacting market credibility ( estimated xx Million units of counterfeit products in 2024)
- Inadequate infrastructure in certain regions hindering distribution and logistics
- Varying regulatory frameworks across different African countries.
Emerging Opportunities in Africa Lubricants Industry
- Expanding into less developed regions with high growth potential
- Catering to the growing demand for specialized lubricants for newer vehicle technologies
- Developing sustainable and environmentally friendly lubricant solutions
- Leveraging digital technologies to improve supply chain efficiency and customer engagement.
Growth Accelerators in the Africa Lubricants Industry
Long-term growth will be driven by continued infrastructure development, government policies promoting automotive growth, and the increased adoption of advanced lubricant technologies to meet evolving environmental regulations and consumer preferences for high-performance products. Strategic partnerships and expansions into untapped markets will further accelerate growth.
Key Players Shaping the Africa Lubricants Industry Market
- Afriquia
- ExxonMobil Corporation
- Astron Energy Pty Ltd
- Coperative Soceite des Petroleum
- BP PLC (Castrol)
- TotalEnergies
- Royal Dutch Shell PLC
- Misr Petroleum
- Engen Petroleum Ltd
- OLA Energy
Notable Milestones in Africa Lubricants Industry Sector
- August 2021: OLA Energy invested EUR 200 million and established 80 new service stations annually (2017-2020) across its pan-African network.
- September 2021: Engen launched its mobile app, enhancing customer convenience and boosting brand recognition.
- January 2022: ExxonMobil reorganized into three business lines: Upstream Company, Product Solutions, and Low Carbon Solutions. This restructuring may lead to a sharper focus on lubricant product development and innovation.
In-Depth Africa Lubricants Industry Market Outlook
The African lubricants market presents significant long-term growth potential, driven by robust economic expansion, rising vehicle ownership, and growing industrial activity. Strategic opportunities lie in investing in advanced lubricant technologies, expanding distribution networks in underserved regions, and capitalizing on the increasing demand for environmentally friendly and high-performance lubricants. The market's future hinges on adapting to evolving consumer preferences and addressing challenges like infrastructure gaps and regulatory complexities.
Africa Lubricants Industry Segmentation
-
1. Vehicle Type
- 1.1. Commercial Vehicles
- 1.2. Motorcycles
- 1.3. Passenger Vehicles
-
2. Product Type
- 2.1. Engine Oils
- 2.2. Greases
- 2.3. Hydraulic Fluids
- 2.4. Transmission & Gear Oils
Africa Lubricants Industry Segmentation By Geography
-
1. Africa
- 1.1. Nigeria
- 1.2. South Africa
- 1.3. Egypt
- 1.4. Kenya
- 1.5. Ethiopia
- 1.6. Morocco
- 1.7. Ghana
- 1.8. Algeria
- 1.9. Tanzania
- 1.10. Ivory Coast
Africa Lubricants Industry Regional Market Share
Geographic Coverage of Africa Lubricants Industry
Africa Lubricants Industry REPORT HIGHLIGHTS
| Aspects | Details |
|---|---|
| Study Period | 2020-2034 |
| Base Year | 2025 |
| Estimated Year | 2026 |
| Forecast Period | 2026-2034 |
| Historical Period | 2020-2025 |
| Growth Rate | CAGR of 3.43% from 2020-2034 |
| Segmentation |
|
Table of Contents
- 1. Introduction
- 1.1. Research Scope
- 1.2. Market Segmentation
- 1.3. Research Objective
- 1.4. Definitions and Assumptions
- 2. Executive Summary
- 2.1. Market Snapshot
- 3. Market Dynamics
- 3.1. Market Drivers
- 3.2. Market Restrains
- 3.3. Market Trends
- 3.4. Market Opportunities
- 4. Market Factor Analysis
- 4.1. Porters Five Forces
- 4.1.1. Bargaining Power of Suppliers
- 4.1.2. Bargaining Power of Buyers
- 4.1.3. Threat of New Entrants
- 4.1.4. Threat of Substitutes
- 4.1.5. Competitive Rivalry
- 4.2. PESTEL analysis
- 4.3. BCG Analysis
- 4.3.1. Stars (High Growth, High Market Share)
- 4.3.2. Cash Cows (Low Growth, High Market Share)
- 4.3.3. Question Mark (High Growth, Low Market Share)
- 4.3.4. Dogs (Low Growth, Low Market Share)
- 4.4. Ansoff Matrix Analysis
- 4.5. Supply Chain Analysis
- 4.6. Regulatory Landscape
- 4.7. Current Market Potential and Opportunity Assessment (TAM–SAM–SOM Framework)
- 4.8. VDR Analyst Note
- 4.1. Porters Five Forces
- 5. Market Analysis, Insights and Forecast 2021-2033
- 5.1. Market Analysis, Insights and Forecast - by Vehicle Type
- 5.1.1. Commercial Vehicles
- 5.1.2. Motorcycles
- 5.1.3. Passenger Vehicles
- 5.2. Market Analysis, Insights and Forecast - by Product Type
- 5.2.1. Engine Oils
- 5.2.2. Greases
- 5.2.3. Hydraulic Fluids
- 5.2.4. Transmission & Gear Oils
- 5.3. Market Analysis, Insights and Forecast - by Region
- 5.3.1. Africa
- 5.1. Market Analysis, Insights and Forecast - by Vehicle Type
- 6. Africa Lubricants Industry Analysis, Insights and Forecast, 2021-2033
- 6.1. Market Analysis, Insights and Forecast - by Vehicle Type
- 6.1.1. Commercial Vehicles
- 6.1.2. Motorcycles
- 6.1.3. Passenger Vehicles
- 6.2. Market Analysis, Insights and Forecast - by Product Type
- 6.2.1. Engine Oils
- 6.2.2. Greases
- 6.2.3. Hydraulic Fluids
- 6.2.4. Transmission & Gear Oils
- 6.1. Market Analysis, Insights and Forecast - by Vehicle Type
- 7. Competitive Analysis
- 7.1. Company Profiles
- 7.1.1 Afriquia
- 7.1.1.1. Company Overview
- 7.1.1.2. Products
- 7.1.1.3. Company Financials
- 7.1.1.4. SWOT Analysis
- 7.1.2 ExxonMobil Corporation
- 7.1.2.1. Company Overview
- 7.1.2.2. Products
- 7.1.2.3. Company Financials
- 7.1.2.4. SWOT Analysis
- 7.1.3 Astron Energy Pty Ltd
- 7.1.3.1. Company Overview
- 7.1.3.2. Products
- 7.1.3.3. Company Financials
- 7.1.3.4. SWOT Analysis
- 7.1.4 Coperative Soceite des Petroleum
- 7.1.4.1. Company Overview
- 7.1.4.2. Products
- 7.1.4.3. Company Financials
- 7.1.4.4. SWOT Analysis
- 7.1.5 BP PLC (Castrol)
- 7.1.5.1. Company Overview
- 7.1.5.2. Products
- 7.1.5.3. Company Financials
- 7.1.5.4. SWOT Analysis
- 7.1.6 TotalEnergie
- 7.1.6.1. Company Overview
- 7.1.6.2. Products
- 7.1.6.3. Company Financials
- 7.1.6.4. SWOT Analysis
- 7.1.7 Royal Dutch Shell PLC
- 7.1.7.1. Company Overview
- 7.1.7.2. Products
- 7.1.7.3. Company Financials
- 7.1.7.4. SWOT Analysis
- 7.1.8 Misr Petroleum
- 7.1.8.1. Company Overview
- 7.1.8.2. Products
- 7.1.8.3. Company Financials
- 7.1.8.4. SWOT Analysis
- 7.1.9 Engen Petroleum Ltd
- 7.1.9.1. Company Overview
- 7.1.9.2. Products
- 7.1.9.3. Company Financials
- 7.1.9.4. SWOT Analysis
- 7.1.10 OLA Energy
- 7.1.10.1. Company Overview
- 7.1.10.2. Products
- 7.1.10.3. Company Financials
- 7.1.10.4. SWOT Analysis
- 7.1.1 Afriquia
- 7.2. Market Entropy
- 7.2.1 Company's Key Areas Served
- 7.2.2 Recent Developments
- 7.3. Company Market Share Analysis 2025
- 7.3.1 Top 5 Companies Market Share Analysis
- 7.3.2 Top 3 Companies Market Share Analysis
- 7.4. List of Potential Customers
- 8. Research Methodology
List of Figures
- Figure 1: Africa Lubricants Industry Revenue Breakdown (billion, %) by Product 2025 & 2033
- Figure 2: Africa Lubricants Industry Share (%) by Company 2025
List of Tables
- Table 1: Africa Lubricants Industry Revenue billion Forecast, by Vehicle Type 2020 & 2033
- Table 2: Africa Lubricants Industry Volume Billion Forecast, by Vehicle Type 2020 & 2033
- Table 3: Africa Lubricants Industry Revenue billion Forecast, by Product Type 2020 & 2033
- Table 4: Africa Lubricants Industry Volume Billion Forecast, by Product Type 2020 & 2033
- Table 5: Africa Lubricants Industry Revenue billion Forecast, by Region 2020 & 2033
- Table 6: Africa Lubricants Industry Volume Billion Forecast, by Region 2020 & 2033
- Table 7: Africa Lubricants Industry Revenue billion Forecast, by Vehicle Type 2020 & 2033
- Table 8: Africa Lubricants Industry Volume Billion Forecast, by Vehicle Type 2020 & 2033
- Table 9: Africa Lubricants Industry Revenue billion Forecast, by Product Type 2020 & 2033
- Table 10: Africa Lubricants Industry Volume Billion Forecast, by Product Type 2020 & 2033
- Table 11: Africa Lubricants Industry Revenue billion Forecast, by Country 2020 & 2033
- Table 12: Africa Lubricants Industry Volume Billion Forecast, by Country 2020 & 2033
- Table 13: Nigeria Africa Lubricants Industry Revenue (billion) Forecast, by Application 2020 & 2033
- Table 14: Nigeria Africa Lubricants Industry Volume (Billion) Forecast, by Application 2020 & 2033
- Table 15: South Africa Africa Lubricants Industry Revenue (billion) Forecast, by Application 2020 & 2033
- Table 16: South Africa Africa Lubricants Industry Volume (Billion) Forecast, by Application 2020 & 2033
- Table 17: Egypt Africa Lubricants Industry Revenue (billion) Forecast, by Application 2020 & 2033
- Table 18: Egypt Africa Lubricants Industry Volume (Billion) Forecast, by Application 2020 & 2033
- Table 19: Kenya Africa Lubricants Industry Revenue (billion) Forecast, by Application 2020 & 2033
- Table 20: Kenya Africa Lubricants Industry Volume (Billion) Forecast, by Application 2020 & 2033
- Table 21: Ethiopia Africa Lubricants Industry Revenue (billion) Forecast, by Application 2020 & 2033
- Table 22: Ethiopia Africa Lubricants Industry Volume (Billion) Forecast, by Application 2020 & 2033
- Table 23: Morocco Africa Lubricants Industry Revenue (billion) Forecast, by Application 2020 & 2033
- Table 24: Morocco Africa Lubricants Industry Volume (Billion) Forecast, by Application 2020 & 2033
- Table 25: Ghana Africa Lubricants Industry Revenue (billion) Forecast, by Application 2020 & 2033
- Table 26: Ghana Africa Lubricants Industry Volume (Billion) Forecast, by Application 2020 & 2033
- Table 27: Algeria Africa Lubricants Industry Revenue (billion) Forecast, by Application 2020 & 2033
- Table 28: Algeria Africa Lubricants Industry Volume (Billion) Forecast, by Application 2020 & 2033
- Table 29: Tanzania Africa Lubricants Industry Revenue (billion) Forecast, by Application 2020 & 2033
- Table 30: Tanzania Africa Lubricants Industry Volume (Billion) Forecast, by Application 2020 & 2033
- Table 31: Ivory Coast Africa Lubricants Industry Revenue (billion) Forecast, by Application 2020 & 2033
- Table 32: Ivory Coast Africa Lubricants Industry Volume (Billion) Forecast, by Application 2020 & 2033
Frequently Asked Questions
1. What is the projected Compound Annual Growth Rate (CAGR) of the Africa Lubricants Industry?
The projected CAGR is approximately 3.43%.
2. Which companies are prominent players in the Africa Lubricants Industry?
Key companies in the market include Afriquia, ExxonMobil Corporation, Astron Energy Pty Ltd, Coperative Soceite des Petroleum, BP PLC (Castrol), TotalEnergie, Royal Dutch Shell PLC, Misr Petroleum, Engen Petroleum Ltd, OLA Energy.
3. What are the main segments of the Africa Lubricants Industry?
The market segments include Vehicle Type, Product Type.
4. Can you provide details about the market size?
The market size is estimated to be USD 2.52 billion as of 2022.
5. What are some drivers contributing to market growth?
Growing Demand for Catalytic Converters from the Automotive Industry; Increasing Demand for Platinum. Palladium. and Ruthenium from the Electronics Industry; Growing Jewelry Consumption in Asia-Pacific Countries.
6. What are the notable trends driving market growth?
Largest Segment By Vehicle Type : <span style="font-family: 'regular_bold';color:#0e7db3;">Commercial Vehicles</span>.
7. Are there any restraints impacting market growth?
High Costs Involved in Production and Maintenance; Other Restraints.
8. Can you provide examples of recent developments in the market?
January 2022: Effective April 1, ExxonMobil Corporation was organized along three business lines - ExxonMobil Upstream Company, ExxonMobil Product Solutions and ExxonMobil Low Carbon Solutions.September 2021: Engen has made a ground-breaking development by launching its Engen App for the convenience of its customers. Engen will offer all its products and services through this app, making it easier for the consumers. This is expected to increase the sales of its lubricants and gain brand recognition in the region.August 2021: During 2017-2020, OLA Energy invested around EUR 200 million and established 80 new service stations every year across its pan-African network, including Gabon, Morocco, Kenya, Reunion, and Egypt.
9. What pricing options are available for accessing the report?
Pricing options include single-user, multi-user, and enterprise licenses priced at USD 3800, USD 4500, and USD 5800 respectively.
10. Is the market size provided in terms of value or volume?
The market size is provided in terms of value, measured in billion and volume, measured in Billion.
11. Are there any specific market keywords associated with the report?
Yes, the market keyword associated with the report is "Africa Lubricants Industry," which aids in identifying and referencing the specific market segment covered.
12. How do I determine which pricing option suits my needs best?
The pricing options vary based on user requirements and access needs. Individual users may opt for single-user licenses, while businesses requiring broader access may choose multi-user or enterprise licenses for cost-effective access to the report.
13. Are there any additional resources or data provided in the Africa Lubricants Industry report?
While the report offers comprehensive insights, it's advisable to review the specific contents or supplementary materials provided to ascertain if additional resources or data are available.
14. How can I stay updated on further developments or reports in the Africa Lubricants Industry?
To stay informed about further developments, trends, and reports in the Africa Lubricants Industry, consider subscribing to industry newsletters, following relevant companies and organizations, or regularly checking reputable industry news sources and publications.
Methodology
Step 1 - Identification of Relevant Samples Size from Population Database


Step 2 - Approaches for Defining Global Market Size (Value, Volume* & Price*)

Note*: In applicable scenarios
Step 3 - Data Sources
Primary Research
- Web Analytics
- Survey Reports
- Research Institute
- Latest Research Reports
- Opinion Leaders
Secondary Research
- Annual Reports
- White Paper
- Latest Press Release
- Industry Association
- Paid Database
- Investor Presentations

Step 4 - Data Triangulation
Involves using different sources of information in order to increase the validity of a study
These sources are likely to be stakeholders in a program - participants, other researchers, program staff, other community members, and so on.
Then we put all data in single framework & apply various statistical tools to find out the dynamic on the market.
During the analysis stage, feedback from the stakeholder groups would be compared to determine areas of agreement as well as areas of divergence