

Key Insights
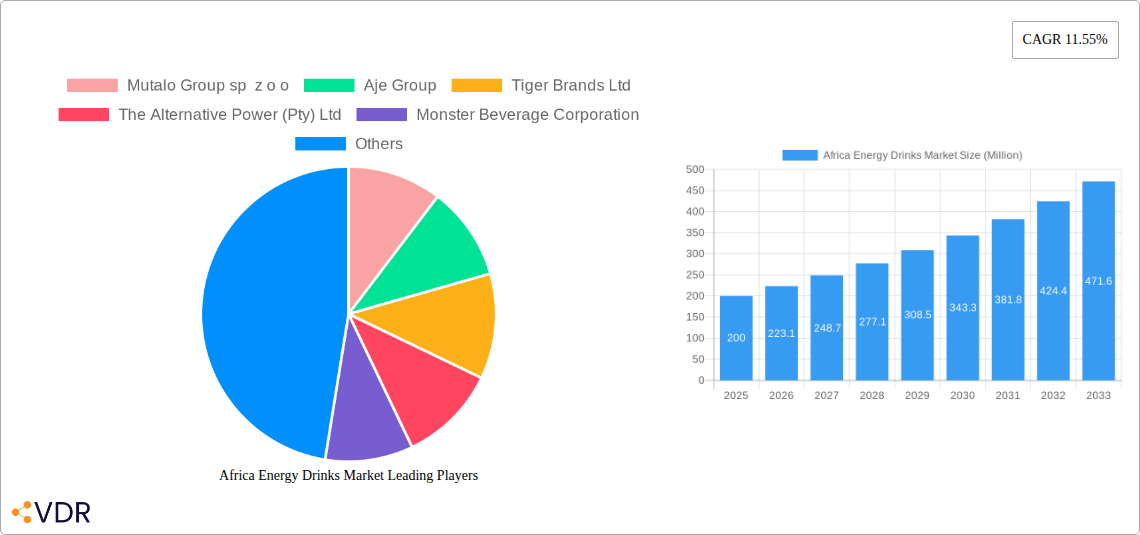
The African energy drinks market, projected to reach $3.65 billion by 2025, is set for substantial expansion, forecasting a Compound Annual Growth Rate (CAGR) of 10.19% from 2025 to 2033. Key growth drivers include rising disposable incomes, particularly among urban youth in South Africa, Nigeria, and Egypt, fueling increased beverage spending. A growing young demographic, urbanization, and adoption of Western lifestyle trends further stimulate demand. The rising popularity of natural, organic, and sugar-free options presents a lucrative segment. Challenges include fluctuating commodity prices and potential regulatory impacts on sugar content and labeling. Competition from global brands like Coca-Cola and PepsiCo, and local players such as Aje Group and Mutalo Group, shapes the market landscape. While traditional energy drinks remain dominant, natural/organic and low-calorie segments are experiencing faster growth, reflecting a shift towards healthier consumer preferences. The on-trade channel is anticipated to see robust growth, driven by the popularity of energy drink cocktails and mixers.
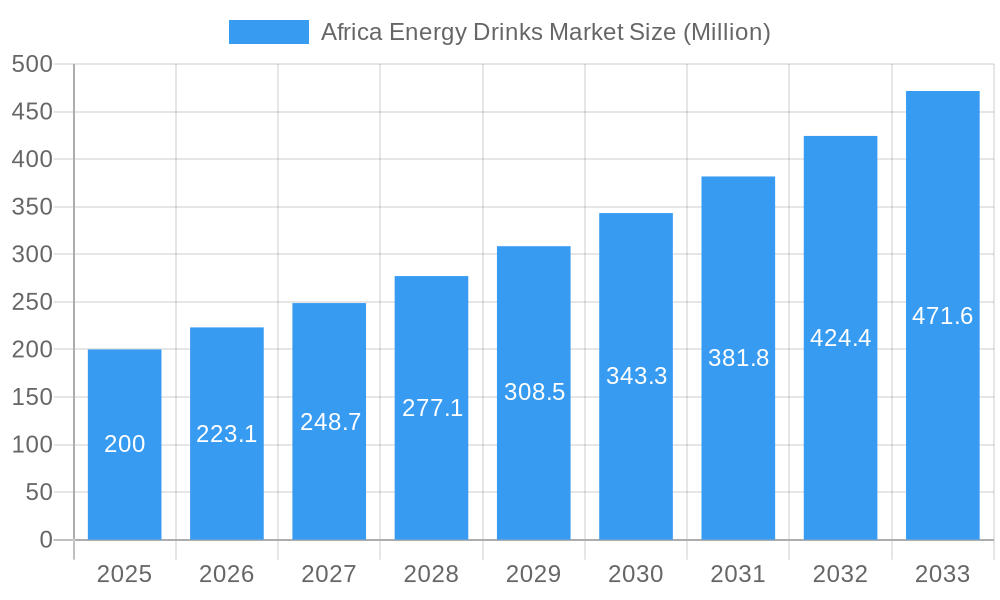
Africa Energy Drinks Market Market Size (In Billion)
The forecast period (2025-2033) will likely see significant market dynamics shifts. Strategic partnerships and product innovation are vital for success. Companies may prioritize PET bottle packaging for cost-effectiveness and extended shelf life. Aggressive marketing targeting youth and expansion into rural areas with increasing purchasing power will be crucial for market share acquisition. Local companies are well-positioned to leverage their understanding of cultural nuances. However, international player entry could intensify competition. Sustained growth necessitates attention to distribution, supply chain management, and consistent quality to meet evolving consumer demands.
Africa Energy Drinks Market Company Market Share
Africa Energy Drinks Market: A Comprehensive Report (2019-2033)
This comprehensive report provides an in-depth analysis of the Africa energy drinks market, offering valuable insights for industry professionals, investors, and strategic decision-makers. Covering the period from 2019 to 2033, with a base year of 2025 and a forecast period of 2025-2033, this report meticulously examines market dynamics, growth trends, dominant segments, and key players. The report quantifies the market in Million units.
Africa Energy Drinks Market Dynamics & Structure
This section analyzes the competitive landscape, technological advancements, regulatory environment, and market trends within the African energy drinks sector. We delve into market concentration, assessing the market share of key players like The Coca-Cola Company, Red Bull GmbH, and PepsiCo Inc, alongside regional players such as Mofaya Beverage Company (PTY) Ltd and Aje Group.
- Market Concentration: The market exhibits a mix of established multinational corporations and smaller regional players, with market share varying significantly across countries and segments. The consolidated market share of the top 5 players is estimated to be xx% in 2025.
- Technological Innovation: Innovation in flavor profiles, functional ingredients (e.g., added vitamins, antioxidants), and sustainable packaging (e.g., recyclable PET bottles) are key drivers. However, challenges related to access to advanced technology and infrastructure hinder wider adoption.
- Regulatory Framework: Varying regulations across African nations regarding sugar content, labeling, and advertising impact market dynamics. Harmonization of regulations could stimulate growth.
- Competitive Substitutes: Other beverage categories, such as soft drinks, juices, and sports drinks, pose a significant competitive challenge.
- End-User Demographics: The youthful population and increasing disposable incomes in several African countries drive demand for energy drinks. The rising health consciousness is shifting consumer preference towards healthier alternatives such as sugar-free and natural energy drinks.
- M&A Trends: The sector has witnessed a moderate level of mergers and acquisitions activity in recent years, with xx M&A deals recorded between 2019 and 2024. Strategic partnerships and acquisitions are expected to increase as established players seek to expand their reach within the African market.
Africa Energy Drinks Market Growth Trends & Insights
This section provides a detailed analysis of the market size evolution, adoption rates, technological disruptions, and consumer behavior shifts impacting the African energy drinks market. We leverage extensive market research data to provide a comprehensive understanding of market growth trajectory.
The Africa energy drinks market is projected to experience robust growth, with a CAGR of xx% during the forecast period (2025-2033). Market penetration of energy drinks is steadily increasing, driven by factors such as rising urbanization, increased disposable incomes, and a growing youth population. The shift towards health-conscious consumption is driving the growth of sugar-free and natural energy drink segments. Technological disruptions, such as improved production methods and innovative packaging, are further accelerating market growth. Consumer behavior is shifting towards online purchasing and brand loyalty influenced by digital marketing and endorsements.
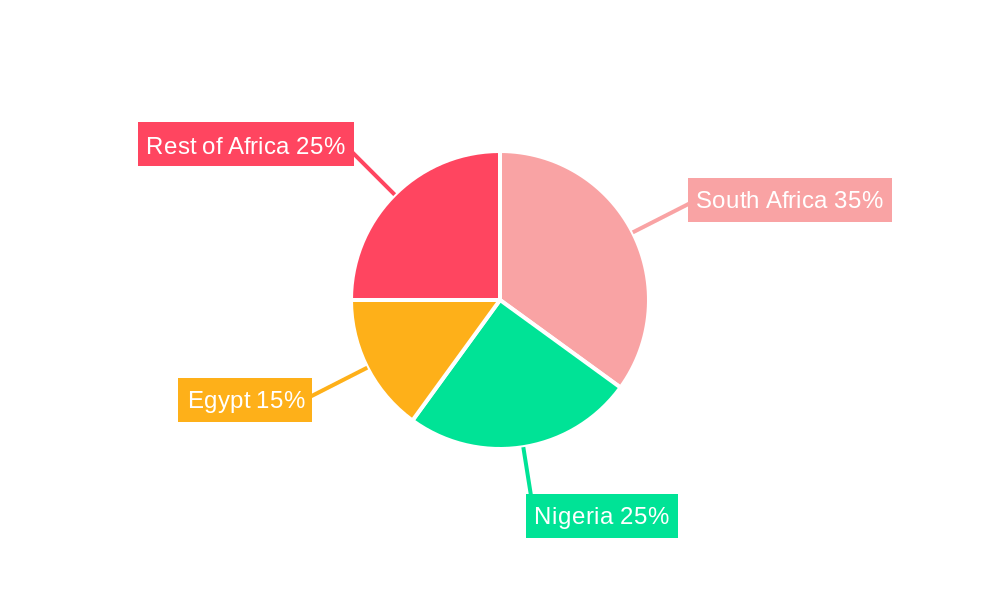
Dominant Regions, Countries, or Segments in Africa Energy Drinks Market
This section identifies the leading regions, countries, and segments within the African energy drinks market, analyzing their growth drivers and market dominance. South Africa, Nigeria, and Egypt represent the largest markets, with South Africa holding the largest market share in 2025 at xx%.
- Country Dominance:
- South Africa: High per capita consumption, established distribution networks, and a strong presence of multinational players contribute to South Africa's dominance.
- Nigeria: Large population and rising disposable incomes fuel strong growth.
- Egypt: A significant market with increasing demand for energy drinks.
- Segment Dominance:
- Packaging Type: PET bottles dominate the market due to cost-effectiveness and convenience.
- Distribution Channel: Off-trade channels (retail stores, supermarkets) hold a larger market share compared to on-trade (restaurants, bars).
- Soft Drink Type: Traditional energy drinks comprise the largest segment, although the demand for sugar-free and natural options is growing rapidly.
Africa Energy Drinks Market Product Landscape
The African energy drinks market showcases a diverse range of products catering to various consumer preferences. Product innovations are focused on enhancing taste profiles, incorporating functional ingredients, and offering convenient packaging options. Companies are increasingly adopting sustainable packaging materials and developing unique selling propositions based on natural ingredients or specific health benefits. Technological advancements in manufacturing processes contribute to improved efficiency and cost reduction.
Key Drivers, Barriers & Challenges in Africa Energy Drinks Market
Key Drivers:
- Rising disposable incomes and urbanization.
- Increasing youth population.
- Growing health consciousness (fueling demand for healthier options).
- Brand marketing and celebrity endorsements.
Key Barriers and Challenges:
- Price sensitivity among consumers.
- Limited access to distribution networks in certain regions.
- Competition from established beverage brands.
- Regulatory hurdles related to labeling and sugar content.
- Supply chain issues affecting the availability of raw materials and packaging. The impact of these challenges is estimated to reduce the market growth by xx% in 2025.
Emerging Opportunities in Africa Energy Drinks Market
- Expanding into untapped markets across the continent.
- Development of innovative flavors and functional ingredients tailored to local preferences.
- Growth of the e-commerce channel for energy drink sales.
- Increasing focus on sustainable and ethical sourcing of ingredients.
- Collaboration with local entrepreneurs to expand distribution.
Growth Accelerators in the Africa Energy Drinks Market Industry
Strategic partnerships between multinational brands and local distributors are accelerating market penetration. Technological advancements in production and packaging are enhancing efficiency and reducing costs. Expansion into untapped markets through targeted marketing campaigns and localized product offerings will propel growth. A focus on health and wellness by incorporating natural ingredients and reducing sugar content will attract health-conscious consumers.
Key Players Shaping the Africa Energy Drinks Market Market
- Mutalo Group sp z o o
- Aje Group
- Tiger Brands Ltd
- The Alternative Power (Pty) Ltd
- Monster Beverage Corporation
- PepsiCo Inc
- Mofaya Beverage Company (PTY) Ltd
- S Spitz GmbH
- Suntory Holdings Limited
- Red Bull GmbH
- Halewood International South Africa (Pty) Ltd
- The Coca-Cola Company
Notable Milestones in Africa Energy Drinks Market Sector
- October 2023: Miss South Africa Natasha Joubert launches a new Berry Queen-flavored energy drink under the MoFaya brand, boosting brand awareness and market reach.
- October 2023: Switch Energy Drink introduces three new limited-edition flavors, enhancing product diversity and appealing to a wider consumer base.
- September 2023: Switch Energy Drink releases a special limited-edition flavor for South African Heritage Day, leveraging national celebrations for marketing and sales.
In-Depth Africa Energy Drinks Market Market Outlook
The Africa energy drinks market is poised for significant expansion in the coming years, fueled by sustained economic growth, demographic shifts, and increasing consumer demand for convenient and flavorful beverages. Strategic partnerships, product innovation, and expansion into new markets present lucrative opportunities for existing players and potential new entrants. Continued focus on health and wellness-oriented offerings will drive further market growth. The market is projected to reach xx Million units by 2033, representing a substantial increase from the 2025 level.
Africa Energy Drinks Market Segmentation
-
1. Soft Drink Type
- 1.1. Energy Shots
- 1.2. Natural/Organic Energy Drinks
- 1.3. Sugar-free or Low-calories Energy Drinks
- 1.4. Traditional Energy Drinks
- 1.5. Other Energy Drinks
-
2. Packaging Type
- 2.1. Glass Bottles
- 2.2. Metal Can
- 2.3. PET Bottles
-
3. Distribution Channel
-
3.1. Off-trade
- 3.1.1. Convenience Stores
- 3.1.2. Online Retail
- 3.1.3. Supermarket/Hypermarket
- 3.1.4. Others
- 3.2. On-trade
-
3.1. Off-trade
Africa Energy Drinks Market Segmentation By Geography
-
1. Africa
- 1.1. Nigeria
- 1.2. South Africa
- 1.3. Egypt
- 1.4. Kenya
- 1.5. Ethiopia
- 1.6. Morocco
- 1.7. Ghana
- 1.8. Algeria
- 1.9. Tanzania
- 1.10. Ivory Coast
Africa Energy Drinks Market Regional Market Share
Geographic Coverage of Africa Energy Drinks Market
Africa Energy Drinks Market REPORT HIGHLIGHTS
| Aspects | Details |
|---|---|
| Study Period | 2020-2034 |
| Base Year | 2025 |
| Estimated Year | 2026 |
| Forecast Period | 2026-2034 |
| Historical Period | 2020-2025 |
| Growth Rate | CAGR of 10.19% from 2020-2034 |
| Segmentation |
|
Table of Contents
- 1. Introduction
- 1.1. Research Scope
- 1.2. Market Segmentation
- 1.3. Research Objective
- 1.4. Definitions and Assumptions
- 2. Executive Summary
- 2.1. Market Snapshot
- 3. Market Dynamics
- 3.1. Market Drivers
- 3.2. Market Restrains
- 3.3. Market Trends
- 3.4. Market Opportunities
- 4. Market Factor Analysis
- 4.1. Porters Five Forces
- 4.1.1. Bargaining Power of Suppliers
- 4.1.2. Bargaining Power of Buyers
- 4.1.3. Threat of New Entrants
- 4.1.4. Threat of Substitutes
- 4.1.5. Competitive Rivalry
- 4.2. PESTEL analysis
- 4.3. BCG Analysis
- 4.3.1. Stars (High Growth, High Market Share)
- 4.3.2. Cash Cows (Low Growth, High Market Share)
- 4.3.3. Question Mark (High Growth, Low Market Share)
- 4.3.4. Dogs (Low Growth, Low Market Share)
- 4.4. Ansoff Matrix Analysis
- 4.5. Supply Chain Analysis
- 4.6. Regulatory Landscape
- 4.7. Current Market Potential and Opportunity Assessment (TAM–SAM–SOM Framework)
- 4.8. VDR Analyst Note
- 4.1. Porters Five Forces
- 5. Market Analysis, Insights and Forecast 2021-2033
- 5.1. Market Analysis, Insights and Forecast - by Soft Drink Type
- 5.1.1. Energy Shots
- 5.1.2. Natural/Organic Energy Drinks
- 5.1.3. Sugar-free or Low-calories Energy Drinks
- 5.1.4. Traditional Energy Drinks
- 5.1.5. Other Energy Drinks
- 5.2. Market Analysis, Insights and Forecast - by Packaging Type
- 5.2.1. Glass Bottles
- 5.2.2. Metal Can
- 5.2.3. PET Bottles
- 5.3. Market Analysis, Insights and Forecast - by Distribution Channel
- 5.3.1. Off-trade
- 5.3.1.1. Convenience Stores
- 5.3.1.2. Online Retail
- 5.3.1.3. Supermarket/Hypermarket
- 5.3.1.4. Others
- 5.3.2. On-trade
- 5.3.1. Off-trade
- 5.4. Market Analysis, Insights and Forecast - by Region
- 5.4.1. Africa
- 5.1. Market Analysis, Insights and Forecast - by Soft Drink Type
- 6. Africa Energy Drinks Market Analysis, Insights and Forecast, 2021-2033
- 6.1. Market Analysis, Insights and Forecast - by Soft Drink Type
- 6.1.1. Energy Shots
- 6.1.2. Natural/Organic Energy Drinks
- 6.1.3. Sugar-free or Low-calories Energy Drinks
- 6.1.4. Traditional Energy Drinks
- 6.1.5. Other Energy Drinks
- 6.2. Market Analysis, Insights and Forecast - by Packaging Type
- 6.2.1. Glass Bottles
- 6.2.2. Metal Can
- 6.2.3. PET Bottles
- 6.3. Market Analysis, Insights and Forecast - by Distribution Channel
- 6.3.1. Off-trade
- 6.3.1.1. Convenience Stores
- 6.3.1.2. Online Retail
- 6.3.1.3. Supermarket/Hypermarket
- 6.3.1.4. Others
- 6.3.2. On-trade
- 6.3.1. Off-trade
- 6.1. Market Analysis, Insights and Forecast - by Soft Drink Type
- 7. Competitive Analysis
- 7.1. Company Profiles
- 7.1.1 Mutalo Group sp z o o
- 7.1.1.1. Company Overview
- 7.1.1.2. Products
- 7.1.1.3. Company Financials
- 7.1.1.4. SWOT Analysis
- 7.1.2 Aje Group
- 7.1.2.1. Company Overview
- 7.1.2.2. Products
- 7.1.2.3. Company Financials
- 7.1.2.4. SWOT Analysis
- 7.1.3 Tiger Brands Ltd
- 7.1.3.1. Company Overview
- 7.1.3.2. Products
- 7.1.3.3. Company Financials
- 7.1.3.4. SWOT Analysis
- 7.1.4 The Alternative Power (Pty) Ltd
- 7.1.4.1. Company Overview
- 7.1.4.2. Products
- 7.1.4.3. Company Financials
- 7.1.4.4. SWOT Analysis
- 7.1.5 Monster Beverage Corporation
- 7.1.5.1. Company Overview
- 7.1.5.2. Products
- 7.1.5.3. Company Financials
- 7.1.5.4. SWOT Analysis
- 7.1.6 PepsiCo Inc
- 7.1.6.1. Company Overview
- 7.1.6.2. Products
- 7.1.6.3. Company Financials
- 7.1.6.4. SWOT Analysis
- 7.1.7 Mofaya Beverage Company (PTY) Ltd
- 7.1.7.1. Company Overview
- 7.1.7.2. Products
- 7.1.7.3. Company Financials
- 7.1.7.4. SWOT Analysis
- 7.1.8 S Spitz GmbH
- 7.1.8.1. Company Overview
- 7.1.8.2. Products
- 7.1.8.3. Company Financials
- 7.1.8.4. SWOT Analysis
- 7.1.9 Suntory Holdings Limited
- 7.1.9.1. Company Overview
- 7.1.9.2. Products
- 7.1.9.3. Company Financials
- 7.1.9.4. SWOT Analysis
- 7.1.10 Red Bull GmbH
- 7.1.10.1. Company Overview
- 7.1.10.2. Products
- 7.1.10.3. Company Financials
- 7.1.10.4. SWOT Analysis
- 7.1.11 Halewood International South Africa (Pty) Ltd
- 7.1.11.1. Company Overview
- 7.1.11.2. Products
- 7.1.11.3. Company Financials
- 7.1.11.4. SWOT Analysis
- 7.1.12 The Coca-Cola Company
- 7.1.12.1. Company Overview
- 7.1.12.2. Products
- 7.1.12.3. Company Financials
- 7.1.12.4. SWOT Analysis
- 7.1.1 Mutalo Group sp z o o
- 7.2. Market Entropy
- 7.2.1 Company's Key Areas Served
- 7.2.2 Recent Developments
- 7.3. Company Market Share Analysis 2025
- 7.3.1 Top 5 Companies Market Share Analysis
- 7.3.2 Top 3 Companies Market Share Analysis
- 7.4. List of Potential Customers
- 8. Research Methodology
List of Figures
- Figure 1: Africa Energy Drinks Market Revenue Breakdown (billion, %) by Product 2025 & 2033
- Figure 2: Africa Energy Drinks Market Share (%) by Company 2025
List of Tables
- Table 1: Africa Energy Drinks Market Revenue billion Forecast, by Soft Drink Type 2020 & 2033
- Table 2: Africa Energy Drinks Market Volume K Tons Forecast, by Soft Drink Type 2020 & 2033
- Table 3: Africa Energy Drinks Market Revenue billion Forecast, by Packaging Type 2020 & 2033
- Table 4: Africa Energy Drinks Market Volume K Tons Forecast, by Packaging Type 2020 & 2033
- Table 5: Africa Energy Drinks Market Revenue billion Forecast, by Distribution Channel 2020 & 2033
- Table 6: Africa Energy Drinks Market Volume K Tons Forecast, by Distribution Channel 2020 & 2033
- Table 7: Africa Energy Drinks Market Revenue billion Forecast, by Region 2020 & 2033
- Table 8: Africa Energy Drinks Market Volume K Tons Forecast, by Region 2020 & 2033
- Table 9: Africa Energy Drinks Market Revenue billion Forecast, by Soft Drink Type 2020 & 2033
- Table 10: Africa Energy Drinks Market Volume K Tons Forecast, by Soft Drink Type 2020 & 2033
- Table 11: Africa Energy Drinks Market Revenue billion Forecast, by Packaging Type 2020 & 2033
- Table 12: Africa Energy Drinks Market Volume K Tons Forecast, by Packaging Type 2020 & 2033
- Table 13: Africa Energy Drinks Market Revenue billion Forecast, by Distribution Channel 2020 & 2033
- Table 14: Africa Energy Drinks Market Volume K Tons Forecast, by Distribution Channel 2020 & 2033
- Table 15: Africa Energy Drinks Market Revenue billion Forecast, by Country 2020 & 2033
- Table 16: Africa Energy Drinks Market Volume K Tons Forecast, by Country 2020 & 2033
- Table 17: Nigeria Africa Energy Drinks Market Revenue (billion) Forecast, by Application 2020 & 2033
- Table 18: Nigeria Africa Energy Drinks Market Volume (K Tons) Forecast, by Application 2020 & 2033
- Table 19: South Africa Africa Energy Drinks Market Revenue (billion) Forecast, by Application 2020 & 2033
- Table 20: South Africa Africa Energy Drinks Market Volume (K Tons) Forecast, by Application 2020 & 2033
- Table 21: Egypt Africa Energy Drinks Market Revenue (billion) Forecast, by Application 2020 & 2033
- Table 22: Egypt Africa Energy Drinks Market Volume (K Tons) Forecast, by Application 2020 & 2033
- Table 23: Kenya Africa Energy Drinks Market Revenue (billion) Forecast, by Application 2020 & 2033
- Table 24: Kenya Africa Energy Drinks Market Volume (K Tons) Forecast, by Application 2020 & 2033
- Table 25: Ethiopia Africa Energy Drinks Market Revenue (billion) Forecast, by Application 2020 & 2033
- Table 26: Ethiopia Africa Energy Drinks Market Volume (K Tons) Forecast, by Application 2020 & 2033
- Table 27: Morocco Africa Energy Drinks Market Revenue (billion) Forecast, by Application 2020 & 2033
- Table 28: Morocco Africa Energy Drinks Market Volume (K Tons) Forecast, by Application 2020 & 2033
- Table 29: Ghana Africa Energy Drinks Market Revenue (billion) Forecast, by Application 2020 & 2033
- Table 30: Ghana Africa Energy Drinks Market Volume (K Tons) Forecast, by Application 2020 & 2033
- Table 31: Algeria Africa Energy Drinks Market Revenue (billion) Forecast, by Application 2020 & 2033
- Table 32: Algeria Africa Energy Drinks Market Volume (K Tons) Forecast, by Application 2020 & 2033
- Table 33: Tanzania Africa Energy Drinks Market Revenue (billion) Forecast, by Application 2020 & 2033
- Table 34: Tanzania Africa Energy Drinks Market Volume (K Tons) Forecast, by Application 2020 & 2033
- Table 35: Ivory Coast Africa Energy Drinks Market Revenue (billion) Forecast, by Application 2020 & 2033
- Table 36: Ivory Coast Africa Energy Drinks Market Volume (K Tons) Forecast, by Application 2020 & 2033
Frequently Asked Questions
1. What is the projected Compound Annual Growth Rate (CAGR) of the Africa Energy Drinks Market?
The projected CAGR is approximately 10.19%.
2. Which companies are prominent players in the Africa Energy Drinks Market?
Key companies in the market include Mutalo Group sp z o o, Aje Group, Tiger Brands Ltd, The Alternative Power (Pty) Ltd, Monster Beverage Corporation, PepsiCo Inc, Mofaya Beverage Company (PTY) Ltd, S Spitz GmbH, Suntory Holdings Limited, Red Bull GmbH, Halewood International South Africa (Pty) Ltd, The Coca-Cola Company.
3. What are the main segments of the Africa Energy Drinks Market?
The market segments include Soft Drink Type, Packaging Type, Distribution Channel.
4. Can you provide details about the market size?
The market size is estimated to be USD 3.65 billion as of 2022.
5. What are some drivers contributing to market growth?
Increasing Demand for Protein-Rich Food; Increasing Demand for Plant-Based and Organic Ingredients.
6. What are the notable trends driving market growth?
OTHER KEY INDUSTRY TRENDS COVERED IN THE REPORT.
7. Are there any restraints impacting market growth?
Presence of Counterfeit Products.
8. Can you provide examples of recent developments in the market?
October 2023: Miss South Africa Natasha Joubert has expanded her business venture by collaborating with the MoFaya energy drink business. Joubert has launched the Berry Queen-flavoured energy drink under the MoFaya energy drink brand.October 2023: Switch Energy Drink introduced 3 new flavors in the African region. The three new limited-edition flavors are Sour Worms, Naartjie & Grape, and Kiwi, Mango & Strawberry.September 2023: Switch Energy Drink launched a special limited-edition flavor in celebration of South African Heritage Day. As a brand deeply rooted in the South African spirit, Switch Energy Drink is excited to contribute to the festivities with this special edition.
9. What pricing options are available for accessing the report?
Pricing options include single-user, multi-user, and enterprise licenses priced at USD 3800, USD 4500, and USD 5800 respectively.
10. Is the market size provided in terms of value or volume?
The market size is provided in terms of value, measured in billion and volume, measured in K Tons.
11. Are there any specific market keywords associated with the report?
Yes, the market keyword associated with the report is "Africa Energy Drinks Market," which aids in identifying and referencing the specific market segment covered.
12. How do I determine which pricing option suits my needs best?
The pricing options vary based on user requirements and access needs. Individual users may opt for single-user licenses, while businesses requiring broader access may choose multi-user or enterprise licenses for cost-effective access to the report.
13. Are there any additional resources or data provided in the Africa Energy Drinks Market report?
While the report offers comprehensive insights, it's advisable to review the specific contents or supplementary materials provided to ascertain if additional resources or data are available.
14. How can I stay updated on further developments or reports in the Africa Energy Drinks Market?
To stay informed about further developments, trends, and reports in the Africa Energy Drinks Market, consider subscribing to industry newsletters, following relevant companies and organizations, or regularly checking reputable industry news sources and publications.
Methodology
Step 1 - Identification of Relevant Samples Size from Population Database


Step 2 - Approaches for Defining Global Market Size (Value, Volume* & Price*)

Note*: In applicable scenarios
Step 3 - Data Sources
Primary Research
- Web Analytics
- Survey Reports
- Research Institute
- Latest Research Reports
- Opinion Leaders
Secondary Research
- Annual Reports
- White Paper
- Latest Press Release
- Industry Association
- Paid Database
- Investor Presentations

Step 4 - Data Triangulation
Involves using different sources of information in order to increase the validity of a study
These sources are likely to be stakeholders in a program - participants, other researchers, program staff, other community members, and so on.
Then we put all data in single framework & apply various statistical tools to find out the dynamic on the market.
During the analysis stage, feedback from the stakeholder groups would be compared to determine areas of agreement as well as areas of divergence