

Key Insights
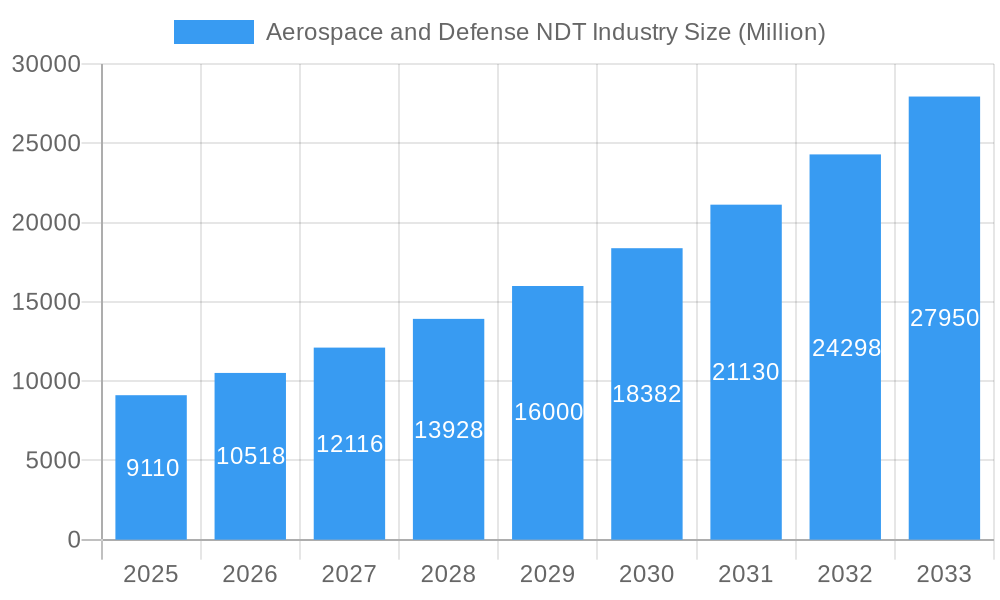
The Aerospace and Defense Non-Destructive Testing (NDT) market is experiencing robust growth, projected to reach \$9.11 billion in 2025 and maintain a Compound Annual Growth Rate (CAGR) of 15.74% from 2025 to 2033. This expansion is driven by several key factors. Firstly, the increasing demand for advanced aircraft and defense systems necessitates stringent quality control measures, making NDT an indispensable part of the manufacturing and maintenance processes. Secondly, the growing adoption of sophisticated NDT technologies like ultrasonic testing, radiography testing, and eddy current testing enhances the accuracy and efficiency of defect detection, leading to improved safety and reduced operational costs. Furthermore, stringent regulatory compliance requirements across the aerospace and defense sectors are pushing companies to adopt advanced NDT techniques, bolstering market growth. The rising focus on predictive maintenance strategies, aiming to prevent catastrophic failures, further fuels the demand for comprehensive NDT solutions. Competition within the market is strong, with key players like Fujifilm, Intertek, Magnaflux, and Olympus continually innovating and expanding their product and service portfolios to cater to the evolving needs of the industry.
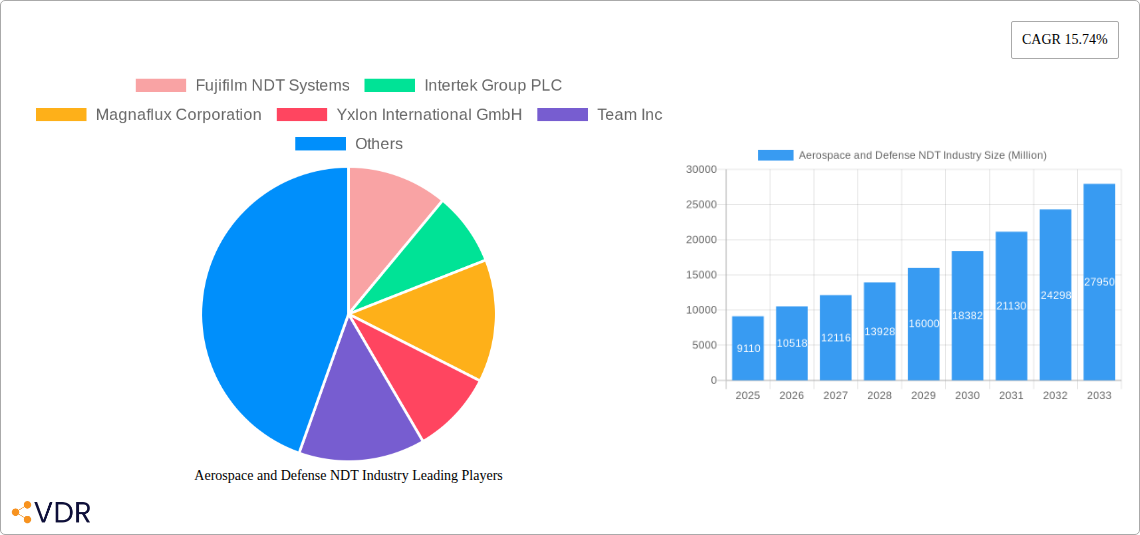
Aerospace and Defense NDT Industry Market Size (In Billion)
Segmentation within the Aerospace and Defense NDT market reveals significant opportunities. The service segment is likely to dominate, owing to the increasing outsourcing of NDT activities by aerospace and defense companies. Among technologies, radiography and ultrasonic testing currently hold substantial market shares due to their established reliability and versatility. However, emerging technologies like electromagnetic testing and advanced visual inspection techniques are gaining traction, driven by their enhanced precision and capabilities for complex material analysis. Geographical analysis suggests that North America and Europe currently represent significant market shares, driven by a high concentration of aerospace and defense manufacturers. However, the Asia-Pacific region is projected to witness significant growth in the coming years, fueled by expanding defense budgets and increasing domestic aircraft production. This regional shift presents substantial opportunities for expansion for existing players and new market entrants.
Aerospace and Defense NDT Industry Company Market Share
Aerospace and Defense NDT Industry Market Report: 2019-2033
This comprehensive report provides an in-depth analysis of the Aerospace and Defense Non-Destructive Testing (NDT) industry, covering market dynamics, growth trends, regional dominance, product landscape, key players, and future outlook. The study period spans from 2019 to 2033, with 2025 as the base and estimated year. The report meticulously examines the parent market (NDT) and child market (Aerospace and Defense NDT) delivering valuable insights for industry professionals, investors, and stakeholders. The market size is projected in Million units.
Aerospace and Defense NDT Industry Market Dynamics & Structure
The Aerospace and Defense NDT market is characterized by moderate concentration, with key players like Fujifilm NDT Systems, Intertek Group PLC, Magnaflux Corporation, and Olympus Corporation holding significant market share. The market is driven by stringent safety regulations, the need for enhanced quality control, and technological advancements in NDT techniques. Regulatory frameworks like FAA and EASA mandates significantly influence adoption rates. The competitive landscape is marked by both established players and emerging companies offering innovative solutions. Product substitutes, while limited, include visual inspection methods that are less advanced and often less effective. The end-user demographics primarily comprise aerospace manufacturers, defense contractors, and maintenance, repair, and overhaul (MRO) providers. M&A activity in the sector has been moderate in recent years, with xx deals recorded between 2019 and 2024, primarily focused on expanding service offerings and geographical reach.
- Market Concentration: Moderately concentrated, with top 5 players holding xx% market share in 2024.
- Technological Innovation Drivers: Advancements in AI, automation, and data analytics are revolutionizing NDT.
- Regulatory Frameworks: Stringent safety standards from agencies like FAA and EASA are key growth drivers.
- Competitive Product Substitutes: Limited, primarily visual inspection, which is less comprehensive and accurate.
- End-User Demographics: Primarily aerospace manufacturers, defense contractors, and MRO providers.
- M&A Trends: Moderate activity (xx deals from 2019-2024), focusing on service expansion and geographic reach.
Aerospace and Defense NDT Industry Growth Trends & Insights
The Aerospace and Defense NDT market experienced steady growth during the historical period (2019-2024), with a CAGR of xx%. This growth is attributed to increasing demand for air travel and defense spending, along with the rising need for reliable and efficient inspection methods. The adoption rate of advanced NDT technologies, such as phased array ultrasonic testing (PAUT) and eddy current array (ECA), is steadily increasing. Technological disruptions, particularly in data analytics and AI-powered inspection systems, are transforming the market, leading to improved accuracy and efficiency. Consumer behavior shifts towards greater emphasis on safety and quality are further fueling market expansion. Market penetration of advanced NDT technologies in the aerospace and defense sector is projected to reach xx% by 2033. Furthermore, the increasing use of robotics in NDT is anticipated to enhance the efficiency and speed of inspections in challenging environments. The market is expected to witness significant growth during the forecast period (2025-2033), with a projected CAGR of xx%, driven by the continued expansion of the aerospace and defense industries, and sustained investment in advanced technologies.
Dominant Regions, Countries, or Segments in Aerospace and Defense NDT Industry
North America currently holds the largest market share in the Aerospace and Defense NDT industry, driven by robust aerospace manufacturing and a significant defense budget. Europe follows closely, with significant aerospace and defense sectors. The Asia-Pacific region exhibits strong growth potential, driven by increasing defense spending and the expansion of its aviation sector.
By Type: The Equipment segment currently dominates the market, reflecting the high capital investment in advanced NDT technologies. However, the Service segment is projected to witness faster growth, driven by an increased outsourcing trend for specialized NDT services.
By Technology: Radiography testing and Ultrasonic testing currently hold the largest shares due to their widespread applications and established reliability. However, advanced techniques like Eddy Current Testing and Phased Array Ultrasonic Testing are gaining traction due to enhanced capabilities and improved efficiency.
- Key Drivers (North America): Robust aerospace manufacturing, high defense spending, stringent regulatory requirements.
- Key Drivers (Europe): Mature aerospace industry, strong presence of major NDT equipment manufacturers, high focus on safety and quality.
- Key Drivers (Asia-Pacific): Rising defense budget, growing aviation sector, increasing focus on infrastructure development.
- Segment Dominance: Equipment segment currently dominant, but Services segment expected to exhibit higher growth.
- Technology Dominance: Radiography and Ultrasonic testing currently dominant, with Eddy Current and PAUT gaining traction.
Aerospace and Defense NDT Industry Product Landscape
The Aerospace and Defense NDT market features a wide range of products, encompassing various NDT techniques. Recent innovations have focused on improving portability, automation, data analysis capabilities, and integration with existing workflows. Manufacturers are increasingly incorporating AI and machine learning to enhance the speed and accuracy of inspections. Key features that differentiate products include advanced data visualization, real-time defect detection, and improved user-friendliness. The integration of these technologies leads to improved decision-making, reduced inspection times, and increased operational efficiency.
Key Drivers, Barriers & Challenges in Aerospace and Defense NDT Industry
Key Drivers: Increasing demand for safer and more reliable aerospace and defense systems, stringent regulatory compliance requirements, and technological advancements are driving market growth. The push for improved operational efficiency and cost reduction in manufacturing and maintenance is also a significant driver.
Key Barriers and Challenges: High initial investment costs associated with advanced NDT equipment, skilled labor shortages, and the need for continuous training and upskilling in the rapidly evolving technological landscape pose challenges. Supply chain disruptions can impact the availability of critical components and materials, affecting equipment production and service delivery. Regulatory compliance requirements can be complex and vary across different regions, adding to operational complexities. Intense competition from established and emerging players can further impact market dynamics.
Emerging Opportunities in Aerospace and Defense NDT Industry
Emerging opportunities lie in the adoption of advanced NDT techniques like automated inspection systems, AI-powered defect recognition, and advanced data analytics. There's substantial growth potential in the development of NDT solutions for composite materials, which are increasingly used in aerospace and defense applications. Expanding into emerging markets with developing aerospace and defense sectors also presents considerable opportunities. The development of specialized NDT solutions for specific applications, such as additive manufacturing inspection, also represents a key opportunity for market expansion.
Growth Accelerators in the Aerospace and Defense NDT Industry Industry
Long-term growth will be significantly accelerated by advancements in AI and machine learning for automated defect recognition and predictive maintenance capabilities. Strategic partnerships between NDT equipment manufacturers and aerospace/defense companies will facilitate the adoption of advanced technologies and streamlined integration. Market expansion into rapidly growing economies with developing aerospace and defense industries is also a key growth driver. Finally, continuous innovation in NDT technologies and the development of specialized solutions for specific applications will drive market expansion.
Key Players Shaping the Aerospace and Defense NDT Industry Market
- Fujifilm NDT Systems
- Intertek Group PLC (Intertek)
- Magnaflux Corporation (Magnaflux)
- Yxlon International GmbH
- Team Inc
- SGS Group (SGS)
- TÜV Rheinland AG (TÜV Rheinland)
- Nikon Metrology Inc (Nikon Metrology)
- Mistras Group (Mistras Group)
- Olympus Corporation (Olympus)
- GE Measurement and Control (GE Measurement & Control)
- Applus Services S.A. (Applus)
- FLIR Systems Inc (FLIR Systems)
- Gould-Bass Co
Notable Milestones in Aerospace and Defense NDT Industry Sector
- March 2024: Eddyfi Technologies launches TubePro 6, advanced pre-inspection and reporting software for heat exchanger inspections, enhancing operational efficiency.
- February 2024: Rad Source NDT launches the NDT 1000 X-ray Inspection System, capable of handling materials up to 0.5 inches thick, improving precision and speed.
In-Depth Aerospace and Defense NDT Industry Market Outlook
The Aerospace and Defense NDT market presents significant long-term growth potential, driven by continuous technological advancements, rising demand for enhanced safety and reliability, and increasing investments in the aerospace and defense sectors globally. Strategic partnerships, focused innovation, and expansion into emerging markets will be crucial for companies seeking to capitalize on these opportunities. The market’s future trajectory hinges on the effective management of challenges, such as supply chain disruptions and skilled labor shortages, ensuring sustainable growth and innovation.
Aerospace and Defense NDT Industry Segmentation
-
1. Type
- 1.1. Service
- 1.2. Equipment
-
2. Technology
- 2.1. Radiography Testing
- 2.2. Ultrasonic Testing
- 2.3. Magnetic
- 2.4. Liquid Penetrant Testing
- 2.5. Visual Inspection
- 2.6. Eddy Current
Aerospace and Defense NDT Industry Segmentation By Geography
- 1. North America
- 2. Europe
- 3. Asia
- 4. Australia and New Zealand
- 5. Latin America
- 6. Middle East and Africa
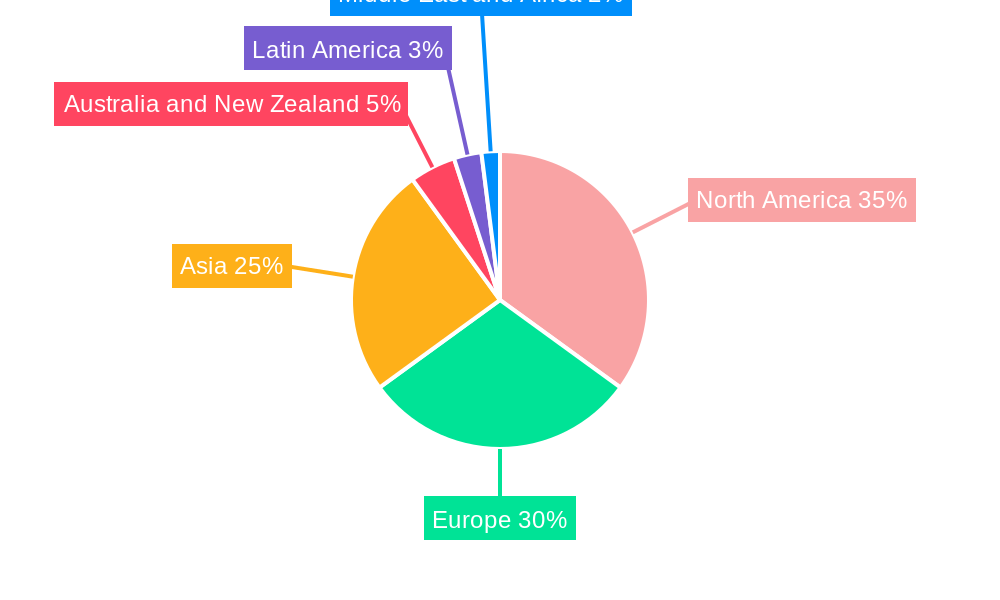
Aerospace and Defense NDT Industry Regional Market Share
Geographic Coverage of Aerospace and Defense NDT Industry
Aerospace and Defense NDT Industry REPORT HIGHLIGHTS
| Aspects | Details |
|---|---|
| Study Period | 2020-2034 |
| Base Year | 2025 |
| Estimated Year | 2026 |
| Forecast Period | 2026-2034 |
| Historical Period | 2020-2025 |
| Growth Rate | CAGR of 15.74% from 2020-2034 |
| Segmentation |
|
Table of Contents
- 1. Introduction
- 1.1. Research Scope
- 1.2. Market Segmentation
- 1.3. Research Objective
- 1.4. Definitions and Assumptions
- 2. Executive Summary
- 2.1. Market Snapshot
- 3. Market Dynamics
- 3.1. Market Drivers
- 3.2. Market Restrains
- 3.3. Market Trends
- 3.4. Market Opportunities
- 4. Market Factor Analysis
- 4.1. Porters Five Forces
- 4.1.1. Bargaining Power of Suppliers
- 4.1.2. Bargaining Power of Buyers
- 4.1.3. Threat of New Entrants
- 4.1.4. Threat of Substitutes
- 4.1.5. Competitive Rivalry
- 4.2. PESTEL analysis
- 4.3. BCG Analysis
- 4.3.1. Stars (High Growth, High Market Share)
- 4.3.2. Cash Cows (Low Growth, High Market Share)
- 4.3.3. Question Mark (High Growth, Low Market Share)
- 4.3.4. Dogs (Low Growth, Low Market Share)
- 4.4. Ansoff Matrix Analysis
- 4.5. Supply Chain Analysis
- 4.6. Regulatory Landscape
- 4.7. Current Market Potential and Opportunity Assessment (TAM–SAM–SOM Framework)
- 4.8. VDR Analyst Note
- 4.1. Porters Five Forces
- 5. Market Analysis, Insights and Forecast 2021-2033
- 5.1. Market Analysis, Insights and Forecast - by Type
- 5.1.1. Service
- 5.1.2. Equipment
- 5.2. Market Analysis, Insights and Forecast - by Technology
- 5.2.1. Radiography Testing
- 5.2.2. Ultrasonic Testing
- 5.2.3. Magnetic
- 5.2.4. Liquid Penetrant Testing
- 5.2.5. Visual Inspection
- 5.2.6. Eddy Current
- 5.3. Market Analysis, Insights and Forecast - by Region
- 5.3.1. North America
- 5.3.2. Europe
- 5.3.3. Asia
- 5.3.4. Australia and New Zealand
- 5.3.5. Latin America
- 5.3.6. Middle East and Africa
- 5.1. Market Analysis, Insights and Forecast - by Type
- 6. Global Aerospace and Defense NDT Industry Analysis, Insights and Forecast, 2021-2033
- 6.1. Market Analysis, Insights and Forecast - by Type
- 6.1.1. Service
- 6.1.2. Equipment
- 6.2. Market Analysis, Insights and Forecast - by Technology
- 6.2.1. Radiography Testing
- 6.2.2. Ultrasonic Testing
- 6.2.3. Magnetic
- 6.2.4. Liquid Penetrant Testing
- 6.2.5. Visual Inspection
- 6.2.6. Eddy Current
- 6.1. Market Analysis, Insights and Forecast - by Type
- 7. North America Aerospace and Defense NDT Industry Analysis, Insights and Forecast, 2021-2033
- 7.1. Market Analysis, Insights and Forecast - by Type
- 7.1.1. Service
- 7.1.2. Equipment
- 7.2. Market Analysis, Insights and Forecast - by Technology
- 7.2.1. Radiography Testing
- 7.2.2. Ultrasonic Testing
- 7.2.3. Magnetic
- 7.2.4. Liquid Penetrant Testing
- 7.2.5. Visual Inspection
- 7.2.6. Eddy Current
- 7.1. Market Analysis, Insights and Forecast - by Type
- 8. Europe Aerospace and Defense NDT Industry Analysis, Insights and Forecast, 2021-2033
- 8.1. Market Analysis, Insights and Forecast - by Type
- 8.1.1. Service
- 8.1.2. Equipment
- 8.2. Market Analysis, Insights and Forecast - by Technology
- 8.2.1. Radiography Testing
- 8.2.2. Ultrasonic Testing
- 8.2.3. Magnetic
- 8.2.4. Liquid Penetrant Testing
- 8.2.5. Visual Inspection
- 8.2.6. Eddy Current
- 8.1. Market Analysis, Insights and Forecast - by Type
- 9. Asia Aerospace and Defense NDT Industry Analysis, Insights and Forecast, 2021-2033
- 9.1. Market Analysis, Insights and Forecast - by Type
- 9.1.1. Service
- 9.1.2. Equipment
- 9.2. Market Analysis, Insights and Forecast - by Technology
- 9.2.1. Radiography Testing
- 9.2.2. Ultrasonic Testing
- 9.2.3. Magnetic
- 9.2.4. Liquid Penetrant Testing
- 9.2.5. Visual Inspection
- 9.2.6. Eddy Current
- 9.1. Market Analysis, Insights and Forecast - by Type
- 10. Australia and New Zealand Aerospace and Defense NDT Industry Analysis, Insights and Forecast, 2021-2033
- 10.1. Market Analysis, Insights and Forecast - by Type
- 10.1.1. Service
- 10.1.2. Equipment
- 10.2. Market Analysis, Insights and Forecast - by Technology
- 10.2.1. Radiography Testing
- 10.2.2. Ultrasonic Testing
- 10.2.3. Magnetic
- 10.2.4. Liquid Penetrant Testing
- 10.2.5. Visual Inspection
- 10.2.6. Eddy Current
- 10.1. Market Analysis, Insights and Forecast - by Type
- 11. Latin America Aerospace and Defense NDT Industry Analysis, Insights and Forecast, 2021-2033
- 11.1. Market Analysis, Insights and Forecast - by Type
- 11.1.1. Service
- 11.1.2. Equipment
- 11.2. Market Analysis, Insights and Forecast - by Technology
- 11.2.1. Radiography Testing
- 11.2.2. Ultrasonic Testing
- 11.2.3. Magnetic
- 11.2.4. Liquid Penetrant Testing
- 11.2.5. Visual Inspection
- 11.2.6. Eddy Current
- 11.1. Market Analysis, Insights and Forecast - by Type
- 12. Middle East and Africa Aerospace and Defense NDT Industry Analysis, Insights and Forecast, 2021-2033
- 12.1. Market Analysis, Insights and Forecast - by Type
- 12.1.1. Service
- 12.1.2. Equipment
- 12.2. Market Analysis, Insights and Forecast - by Technology
- 12.2.1. Radiography Testing
- 12.2.2. Ultrasonic Testing
- 12.2.3. Magnetic
- 12.2.4. Liquid Penetrant Testing
- 12.2.5. Visual Inspection
- 12.2.6. Eddy Current
- 12.1. Market Analysis, Insights and Forecast - by Type
- 13. Competitive Analysis
- 13.1. Company Profiles
- 13.1.1 Fujifilm NDT Systems
- 13.1.1.1. Company Overview
- 13.1.1.2. Products
- 13.1.1.3. Company Financials
- 13.1.1.4. SWOT Analysis
- 13.1.2 Intertek Group PLC
- 13.1.2.1. Company Overview
- 13.1.2.2. Products
- 13.1.2.3. Company Financials
- 13.1.2.4. SWOT Analysis
- 13.1.3 Magnaflux Corporation
- 13.1.3.1. Company Overview
- 13.1.3.2. Products
- 13.1.3.3. Company Financials
- 13.1.3.4. SWOT Analysis
- 13.1.4 Yxlon International GmbH
- 13.1.4.1. Company Overview
- 13.1.4.2. Products
- 13.1.4.3. Company Financials
- 13.1.4.4. SWOT Analysis
- 13.1.5 Team Inc
- 13.1.5.1. Company Overview
- 13.1.5.2. Products
- 13.1.5.3. Company Financials
- 13.1.5.4. SWOT Analysis
- 13.1.6 SGS Group
- 13.1.6.1. Company Overview
- 13.1.6.2. Products
- 13.1.6.3. Company Financials
- 13.1.6.4. SWOT Analysis
- 13.1.7 TUV Rheinland Ag
- 13.1.7.1. Company Overview
- 13.1.7.2. Products
- 13.1.7.3. Company Financials
- 13.1.7.4. SWOT Analysis
- 13.1.8 NikonMetrology Inc
- 13.1.8.1. Company Overview
- 13.1.8.2. Products
- 13.1.8.3. Company Financials
- 13.1.8.4. SWOT Analysis
- 13.1.9 Mistras Group
- 13.1.9.1. Company Overview
- 13.1.9.2. Products
- 13.1.9.3. Company Financials
- 13.1.9.4. SWOT Analysis
- 13.1.10 Olympus Corporation
- 13.1.10.1. Company Overview
- 13.1.10.2. Products
- 13.1.10.3. Company Financials
- 13.1.10.4. SWOT Analysis
- 13.1.11 GE Measurement and Control
- 13.1.11.1. Company Overview
- 13.1.11.2. Products
- 13.1.11.3. Company Financials
- 13.1.11.4. SWOT Analysis
- 13.1.12 Applus Services S A
- 13.1.12.1. Company Overview
- 13.1.12.2. Products
- 13.1.12.3. Company Financials
- 13.1.12.4. SWOT Analysis
- 13.1.13 FLIR Systems Inc *List Not Exhaustive
- 13.1.13.1. Company Overview
- 13.1.13.2. Products
- 13.1.13.3. Company Financials
- 13.1.13.4. SWOT Analysis
- 13.1.14 Gould-Bass Co
- 13.1.14.1. Company Overview
- 13.1.14.2. Products
- 13.1.14.3. Company Financials
- 13.1.14.4. SWOT Analysis
- 13.1.1 Fujifilm NDT Systems
- 13.2. Market Entropy
- 13.2.1 Company's Key Areas Served
- 13.2.2 Recent Developments
- 13.3. Company Market Share Analysis 2025
- 13.3.1 Top 5 Companies Market Share Analysis
- 13.3.2 Top 3 Companies Market Share Analysis
- 13.4. List of Potential Customers
- 14. Research Methodology
List of Figures
- Figure 1: Global Aerospace and Defense NDT Industry Revenue Breakdown (Million, %) by Region 2025 & 2033
- Figure 2: North America Aerospace and Defense NDT Industry Revenue (Million), by Type 2025 & 2033
- Figure 3: North America Aerospace and Defense NDT Industry Revenue Share (%), by Type 2025 & 2033
- Figure 4: North America Aerospace and Defense NDT Industry Revenue (Million), by Technology 2025 & 2033
- Figure 5: North America Aerospace and Defense NDT Industry Revenue Share (%), by Technology 2025 & 2033
- Figure 6: North America Aerospace and Defense NDT Industry Revenue (Million), by Country 2025 & 2033
- Figure 7: North America Aerospace and Defense NDT Industry Revenue Share (%), by Country 2025 & 2033
- Figure 8: Europe Aerospace and Defense NDT Industry Revenue (Million), by Type 2025 & 2033
- Figure 9: Europe Aerospace and Defense NDT Industry Revenue Share (%), by Type 2025 & 2033
- Figure 10: Europe Aerospace and Defense NDT Industry Revenue (Million), by Technology 2025 & 2033
- Figure 11: Europe Aerospace and Defense NDT Industry Revenue Share (%), by Technology 2025 & 2033
- Figure 12: Europe Aerospace and Defense NDT Industry Revenue (Million), by Country 2025 & 2033
- Figure 13: Europe Aerospace and Defense NDT Industry Revenue Share (%), by Country 2025 & 2033
- Figure 14: Asia Aerospace and Defense NDT Industry Revenue (Million), by Type 2025 & 2033
- Figure 15: Asia Aerospace and Defense NDT Industry Revenue Share (%), by Type 2025 & 2033
- Figure 16: Asia Aerospace and Defense NDT Industry Revenue (Million), by Technology 2025 & 2033
- Figure 17: Asia Aerospace and Defense NDT Industry Revenue Share (%), by Technology 2025 & 2033
- Figure 18: Asia Aerospace and Defense NDT Industry Revenue (Million), by Country 2025 & 2033
- Figure 19: Asia Aerospace and Defense NDT Industry Revenue Share (%), by Country 2025 & 2033
- Figure 20: Australia and New Zealand Aerospace and Defense NDT Industry Revenue (Million), by Type 2025 & 2033
- Figure 21: Australia and New Zealand Aerospace and Defense NDT Industry Revenue Share (%), by Type 2025 & 2033
- Figure 22: Australia and New Zealand Aerospace and Defense NDT Industry Revenue (Million), by Technology 2025 & 2033
- Figure 23: Australia and New Zealand Aerospace and Defense NDT Industry Revenue Share (%), by Technology 2025 & 2033
- Figure 24: Australia and New Zealand Aerospace and Defense NDT Industry Revenue (Million), by Country 2025 & 2033
- Figure 25: Australia and New Zealand Aerospace and Defense NDT Industry Revenue Share (%), by Country 2025 & 2033
- Figure 26: Latin America Aerospace and Defense NDT Industry Revenue (Million), by Type 2025 & 2033
- Figure 27: Latin America Aerospace and Defense NDT Industry Revenue Share (%), by Type 2025 & 2033
- Figure 28: Latin America Aerospace and Defense NDT Industry Revenue (Million), by Technology 2025 & 2033
- Figure 29: Latin America Aerospace and Defense NDT Industry Revenue Share (%), by Technology 2025 & 2033
- Figure 30: Latin America Aerospace and Defense NDT Industry Revenue (Million), by Country 2025 & 2033
- Figure 31: Latin America Aerospace and Defense NDT Industry Revenue Share (%), by Country 2025 & 2033
- Figure 32: Middle East and Africa Aerospace and Defense NDT Industry Revenue (Million), by Type 2025 & 2033
- Figure 33: Middle East and Africa Aerospace and Defense NDT Industry Revenue Share (%), by Type 2025 & 2033
- Figure 34: Middle East and Africa Aerospace and Defense NDT Industry Revenue (Million), by Technology 2025 & 2033
- Figure 35: Middle East and Africa Aerospace and Defense NDT Industry Revenue Share (%), by Technology 2025 & 2033
- Figure 36: Middle East and Africa Aerospace and Defense NDT Industry Revenue (Million), by Country 2025 & 2033
- Figure 37: Middle East and Africa Aerospace and Defense NDT Industry Revenue Share (%), by Country 2025 & 2033
List of Tables
- Table 1: Global Aerospace and Defense NDT Industry Revenue Million Forecast, by Type 2020 & 2033
- Table 2: Global Aerospace and Defense NDT Industry Revenue Million Forecast, by Technology 2020 & 2033
- Table 3: Global Aerospace and Defense NDT Industry Revenue Million Forecast, by Region 2020 & 2033
- Table 4: Global Aerospace and Defense NDT Industry Revenue Million Forecast, by Type 2020 & 2033
- Table 5: Global Aerospace and Defense NDT Industry Revenue Million Forecast, by Technology 2020 & 2033
- Table 6: Global Aerospace and Defense NDT Industry Revenue Million Forecast, by Country 2020 & 2033
- Table 7: Global Aerospace and Defense NDT Industry Revenue Million Forecast, by Type 2020 & 2033
- Table 8: Global Aerospace and Defense NDT Industry Revenue Million Forecast, by Technology 2020 & 2033
- Table 9: Global Aerospace and Defense NDT Industry Revenue Million Forecast, by Country 2020 & 2033
- Table 10: Global Aerospace and Defense NDT Industry Revenue Million Forecast, by Type 2020 & 2033
- Table 11: Global Aerospace and Defense NDT Industry Revenue Million Forecast, by Technology 2020 & 2033
- Table 12: Global Aerospace and Defense NDT Industry Revenue Million Forecast, by Country 2020 & 2033
- Table 13: Global Aerospace and Defense NDT Industry Revenue Million Forecast, by Type 2020 & 2033
- Table 14: Global Aerospace and Defense NDT Industry Revenue Million Forecast, by Technology 2020 & 2033
- Table 15: Global Aerospace and Defense NDT Industry Revenue Million Forecast, by Country 2020 & 2033
- Table 16: Global Aerospace and Defense NDT Industry Revenue Million Forecast, by Type 2020 & 2033
- Table 17: Global Aerospace and Defense NDT Industry Revenue Million Forecast, by Technology 2020 & 2033
- Table 18: Global Aerospace and Defense NDT Industry Revenue Million Forecast, by Country 2020 & 2033
- Table 19: Global Aerospace and Defense NDT Industry Revenue Million Forecast, by Type 2020 & 2033
- Table 20: Global Aerospace and Defense NDT Industry Revenue Million Forecast, by Technology 2020 & 2033
- Table 21: Global Aerospace and Defense NDT Industry Revenue Million Forecast, by Country 2020 & 2033
Frequently Asked Questions
1. What is the projected Compound Annual Growth Rate (CAGR) of the Aerospace and Defense NDT Industry?
The projected CAGR is approximately 15.74%.
2. Which companies are prominent players in the Aerospace and Defense NDT Industry?
Key companies in the market include Fujifilm NDT Systems, Intertek Group PLC, Magnaflux Corporation, Yxlon International GmbH, Team Inc, SGS Group, TUV Rheinland Ag, NikonMetrology Inc, Mistras Group, Olympus Corporation, GE Measurement and Control, Applus Services S A, FLIR Systems Inc *List Not Exhaustive, Gould-Bass Co.
3. What are the main segments of the Aerospace and Defense NDT Industry?
The market segments include Type, Technology.
4. Can you provide details about the market size?
The market size is estimated to be USD 9.11 Million as of 2022.
5. What are some drivers contributing to market growth?
Increasing Investments in Aerospace & Defense; Increasing Complexity of Machine and Infrastructure.
6. What are the notable trends driving market growth?
Radiography Testing Technology to Account for the Largest Share.
7. Are there any restraints impacting market growth?
Lack Of Technical Workforce; Relative Lack of Awareness.
8. Can you provide examples of recent developments in the market?
March 2024 – Eddyfi Technologies, a player in the global non-destructive testing (NDT) solutions market, unveils TubePro 6, its advanced pre-inspection and reporting software. TubePro 6 is equipping organizations with advanced tools. These features promise unmatched insights and operational efficiency, particularly in heat exchanger inspections.
9. What pricing options are available for accessing the report?
Pricing options include single-user, multi-user, and enterprise licenses priced at USD 4750, USD 5250, and USD 8750 respectively.
10. Is the market size provided in terms of value or volume?
The market size is provided in terms of value, measured in Million.
11. Are there any specific market keywords associated with the report?
Yes, the market keyword associated with the report is "Aerospace and Defense NDT Industry," which aids in identifying and referencing the specific market segment covered.
12. How do I determine which pricing option suits my needs best?
The pricing options vary based on user requirements and access needs. Individual users may opt for single-user licenses, while businesses requiring broader access may choose multi-user or enterprise licenses for cost-effective access to the report.
13. Are there any additional resources or data provided in the Aerospace and Defense NDT Industry report?
While the report offers comprehensive insights, it's advisable to review the specific contents or supplementary materials provided to ascertain if additional resources or data are available.
14. How can I stay updated on further developments or reports in the Aerospace and Defense NDT Industry?
To stay informed about further developments, trends, and reports in the Aerospace and Defense NDT Industry, consider subscribing to industry newsletters, following relevant companies and organizations, or regularly checking reputable industry news sources and publications.
Methodology
Step 1 - Identification of Relevant Samples Size from Population Database


Step 2 - Approaches for Defining Global Market Size (Value, Volume* & Price*)

Note*: In applicable scenarios
Step 3 - Data Sources
Primary Research
- Web Analytics
- Survey Reports
- Research Institute
- Latest Research Reports
- Opinion Leaders
Secondary Research
- Annual Reports
- White Paper
- Latest Press Release
- Industry Association
- Paid Database
- Investor Presentations

Step 4 - Data Triangulation
Involves using different sources of information in order to increase the validity of a study
These sources are likely to be stakeholders in a program - participants, other researchers, program staff, other community members, and so on.
Then we put all data in single framework & apply various statistical tools to find out the dynamic on the market.
During the analysis stage, feedback from the stakeholder groups would be compared to determine areas of agreement as well as areas of divergence