
Key Insights
The global adhesion barrier market is experiencing robust growth, projected to reach a substantial size by 2033, driven by a 7.90% CAGR. This expansion is fueled by several key factors. Firstly, the increasing prevalence of surgical procedures across various specialties, including general, gynecological, cardiovascular, orthopedic, and neurological surgeries, creates significant demand for adhesion barriers. These barriers minimize post-surgical adhesions, a common complication leading to pain, infertility, and bowel obstruction, thus improving patient outcomes and reducing healthcare costs associated with revision surgeries. Technological advancements in barrier materials, including the development of more effective synthetic and natural options with improved biocompatibility and ease of application (film, liquid, gel formulations), are also significant drivers. The market is segmented by application, product type, and formulation, with synthetic adhesion barriers in liquid form currently dominating due to their ease of use and broad applicability. Growth in emerging economies, particularly in the Asia Pacific region, is expected to further contribute to market expansion. However, challenges remain, such as the relatively high cost of certain adhesion barriers, which might limit accessibility in some regions, and the potential for adverse reactions in specific patient populations. Competitive dynamics are intense, with established players like Johnson & Johnson and Baxter International alongside emerging innovative companies, continually driving innovation and market expansion.
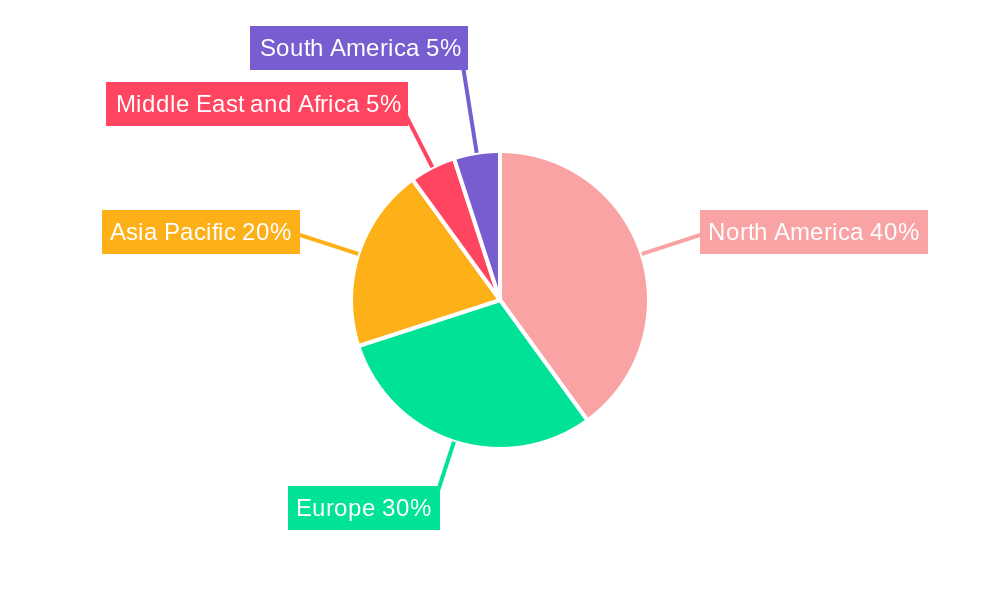
The market's regional distribution reflects varying healthcare infrastructure and surgical procedure rates. North America and Europe currently hold significant market share due to high healthcare spending and advanced medical infrastructure. However, the Asia Pacific region is projected to witness the fastest growth, fueled by rising disposable incomes, improving healthcare infrastructure, and increasing awareness of advanced surgical techniques. Successful market penetration hinges on strong regulatory approvals, effective marketing strategies targeting surgeons, and collaborations to address pricing and accessibility issues. Future market growth will depend on continued technological advancements, broader adoption of minimally invasive surgical techniques, and further clinical evidence demonstrating the long-term benefits of adhesion barrier use in reducing post-surgical complications.
Adhesion Barrier Market: A Comprehensive Market Report (2019-2033)
This comprehensive report provides a detailed analysis of the Adhesion Barrier Market, encompassing market dynamics, growth trends, regional segmentation, product landscape, key players, and future outlook. The study period covers 2019-2033, with 2025 as the base and estimated year. The report utilizes rigorous methodology and data analysis to provide actionable insights for industry professionals, investors, and stakeholders. The market is segmented by application (General/Abdominal Surgeries, Gynecological Surgeries, Cardiovascular Surgeries, Orthopedic Surgeries, Neurological Surgeries, Other Applications), product (Synthetic Adhesion Barriers, Other Synthetic Adhesion Barriers, Natural Adhesion Barriers), and formulation (Film, Liquid, Gel). The total market value is predicted to reach xx Million by 2033.
Adhesion Barrier Market Dynamics & Structure
The Adhesion Barrier market is characterized by moderate concentration, with key players holding significant market share. Technological innovation, particularly in biocompatible materials and delivery systems, is a major driver. Stringent regulatory frameworks, including those from the FDA and equivalent global bodies, influence product development and market entry. Competitive pressures arise from substitute products and the emergence of novel adhesion barrier technologies. The end-user demographic largely comprises hospitals and surgical centers, influenced by factors like procedure volume and adoption rates. M&A activity has been relatively moderate in recent years, with xx deals recorded between 2019 and 2024, signifying consolidation within the sector.
- Market Concentration: Moderately concentrated, with top 5 players holding approximately xx% market share in 2024.
- Technological Innovation: Focus on bioabsorbable materials, minimally invasive delivery systems, and enhanced efficacy.
- Regulatory Landscape: Stringent regulations regarding biocompatibility and safety drive product development costs.
- Competitive Substitutes: Existing surgical techniques and alternative wound management solutions present competition.
- M&A Activity: xx deals between 2019 and 2024, indicating consolidation and strategic expansion.
- Innovation Barriers: High R&D costs and lengthy regulatory approval processes hinder innovation.
Adhesion Barrier Market Growth Trends & Insights
The Adhesion Barrier market has witnessed consistent growth over the historical period (2019-2024), driven by the increasing prevalence of surgical procedures, rising geriatric population, and advancements in surgical techniques. The market size expanded from xx Million in 2019 to xx Million in 2024, exhibiting a CAGR of xx%. Technological disruptions, such as the introduction of novel biomaterials and improved delivery systems, have accelerated market adoption. Consumer behavior shifts towards minimally invasive surgeries and improved patient outcomes are further fueling demand. The market is expected to continue its growth trajectory, projected to reach xx Million by 2033, with a CAGR of xx% during the forecast period (2025-2033). Market penetration in key surgical segments is expected to increase from xx% in 2024 to xx% by 2033.
Dominant Regions, Countries, or Segments in Adhesion Barrier Market
North America currently dominates the Adhesion Barrier market, driven by high healthcare expenditure, advanced healthcare infrastructure, and a large number of surgical procedures. Within applications, General/Abdominal surgeries account for the largest segment, followed by Gynecological and Orthopedic surgeries. Synthetic adhesion barriers hold the largest product share, with Film and Liquid formulations being predominantly used. Key growth drivers include:
- North America: High healthcare expenditure, advanced surgical infrastructure, and high adoption rates.
- Europe: Growing demand for minimally invasive surgeries and increasing prevalence of chronic diseases.
- Asia-Pacific: Rapidly expanding healthcare sector, rising disposable incomes, and increasing surgical procedures.
- General/Abdominal Surgeries: Largest application segment due to high procedure volumes and postoperative adhesion risk.
- Synthetic Adhesion Barriers: High efficacy and versatile application across various surgical procedures.
- Film Formulation: Ease of application and precise placement during surgical procedures.
Adhesion Barrier Market Product Landscape
The Adhesion Barrier market features a diverse range of products, including synthetic and natural barriers, offered in various formulations (film, liquid, gel). Recent innovations focus on enhanced biocompatibility, improved adhesion prevention efficacy, and minimally invasive delivery systems. Key selling propositions include reduced post-operative complications, faster recovery times, and improved patient outcomes. Technological advancements are centered on bioabsorbable polymers, novel coating technologies, and advanced drug delivery systems.
Key Drivers, Barriers & Challenges in Adhesion Barrier Market
Key Drivers:
- Increasing prevalence of surgical procedures.
- Rising geriatric population.
- Advancements in minimally invasive surgical techniques.
- Growing demand for improved patient outcomes.
Key Challenges:
- High cost of advanced biomaterials.
- Stringent regulatory approvals.
- Competition from substitute products.
- Supply chain disruptions impacting raw material availability.
- The xx% increase in raw material costs from 2022 to 2024 significantly impacted production.
Emerging Opportunities in Adhesion Barrier Market
- Expanding into untapped markets in emerging economies.
- Development of novel biomaterials with enhanced properties.
- Focus on personalized medicine approaches for targeted adhesion prevention.
- Growing demand for minimally invasive delivery systems.
- Increasing partnerships between manufacturers and healthcare providers.
Growth Accelerators in the Adhesion Barrier Market Industry
Technological breakthroughs in biomaterial science are significantly accelerating market growth. Strategic partnerships between manufacturers and research institutions are driving innovation. Market expansion into emerging economies and focus on unmet clinical needs will further propel the market's trajectory. The adoption of advanced manufacturing techniques for improved product quality and efficiency is also a significant accelerator.
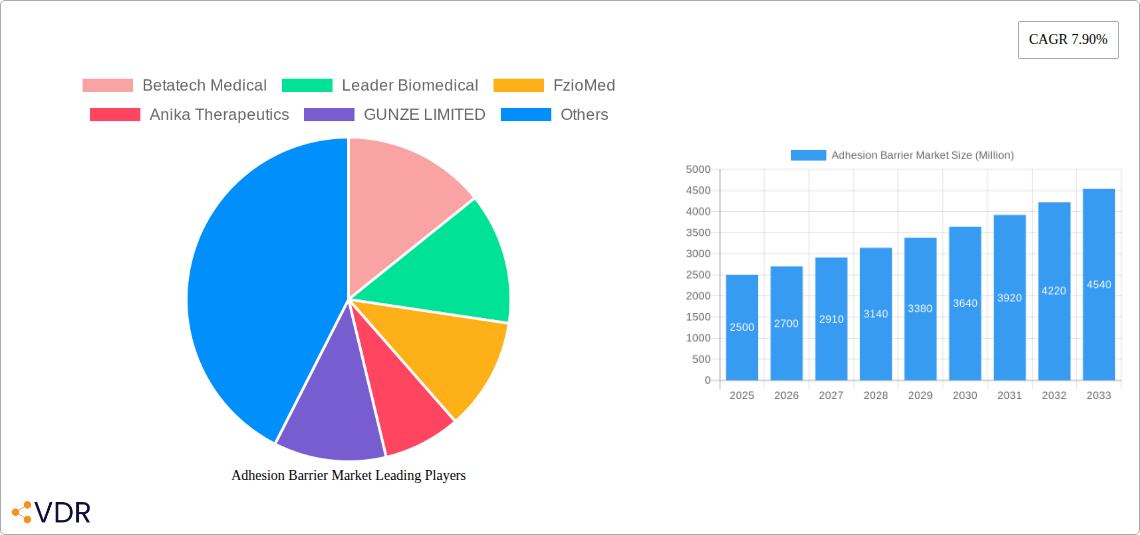
Key Players Shaping the Adhesion Barrier Market Market
- Betatech Medical
- Leader Biomedical
- FzioMed
- Anika Therapeutics
- GUNZE LIMITED
- TAICEND TECHNOLOGY CO LTD
- MAST Biosurgery
- Integra LifeSciences Holdings Corporation
- Johnson & Johnson
- Wuhan Sitaili Medical Apparatus Development Co
- Baxter International
- BIOSCOMPASS INC
Notable Milestones in Adhesion Barrier Market Sector
- February 2022: Gunze Limited obtained medical device approval to manufacture and sell TENALEAF, the first sheet-type absorbable adhesion barrier made in Japan. This significantly expanded the product portfolio available in the Japanese market.
- June 2022: CGBIO launched MEDICLORE, an anti-adhesion agent in Indonesia. This marks the entry of a new player into the Southeast Asian market, increasing competition.
In-Depth Adhesion Barrier Market Market Outlook
The Adhesion Barrier market is poised for substantial growth in the coming years, driven by continuous innovation, expanding applications, and increasing global surgical procedures. Strategic investments in R&D and expansion into new geographical markets will be crucial for market leadership. The focus on minimally invasive surgery and improved patient outcomes will continue to shape product development and market dynamics. The market is expected to witness a significant increase in market share by key players through mergers and acquisitions, driving further consolidation.
Adhesion Barrier Market Segmentation
-
1. Product
-
1.1. Synthetic Adhesion Barriers
- 1.1.1. Hyaluronic Acid
- 1.1.2. Regenerated Cellulose
- 1.1.3. Polyethylene Glycol
- 1.1.4. Other Synthetic Adhesion Barriers
-
1.2. Natural Adhesion Barriers
- 1.2.1. Collagen
- 1.2.2. Fibrin
-
1.1. Synthetic Adhesion Barriers
-
2. Formulation
- 2.1. Film
- 2.2. Liquid
- 2.3. Gel
-
3. Application
- 3.1. General/Abdominal Surgeries
- 3.2. Gynecological Surgeries
- 3.3. Cardiovascular Surgeries
- 3.4. Orthopedic Surgeries
- 3.5. Neurological Surgeries
- 3.6. Other Applications
Adhesion Barrier Market Segmentation By Geography
-
1. North America
- 1.1. United States
- 1.2. Canada
- 1.3. Mexico
-
2. Europe
- 2.1. Germany
- 2.2. United Kingdom
- 2.3. France
- 2.4. Italy
- 2.5. Spain
- 2.6. Rest of Europe
-
3. Asia Pacific
- 3.1. China
- 3.2. Japan
- 3.3. India
- 3.4. Australia
- 3.5. South korea
- 3.6. Rest of Asia Pacific
-
4. Middle East and Africa
- 4.1. GCC
- 4.2. South Africa
- 4.3. Rest of Middle East and Africa
-
5. South America
- 5.1. Brazil
- 5.2. Argentina
- 5.3. Rest of South America
Adhesion Barrier Market REPORT HIGHLIGHTS
| Aspects | Details |
|---|---|
| Study Period | 2019-2033 |
| Base Year | 2024 |
| Estimated Year | 2025 |
| Forecast Period | 2025-2033 |
| Historical Period | 2019-2024 |
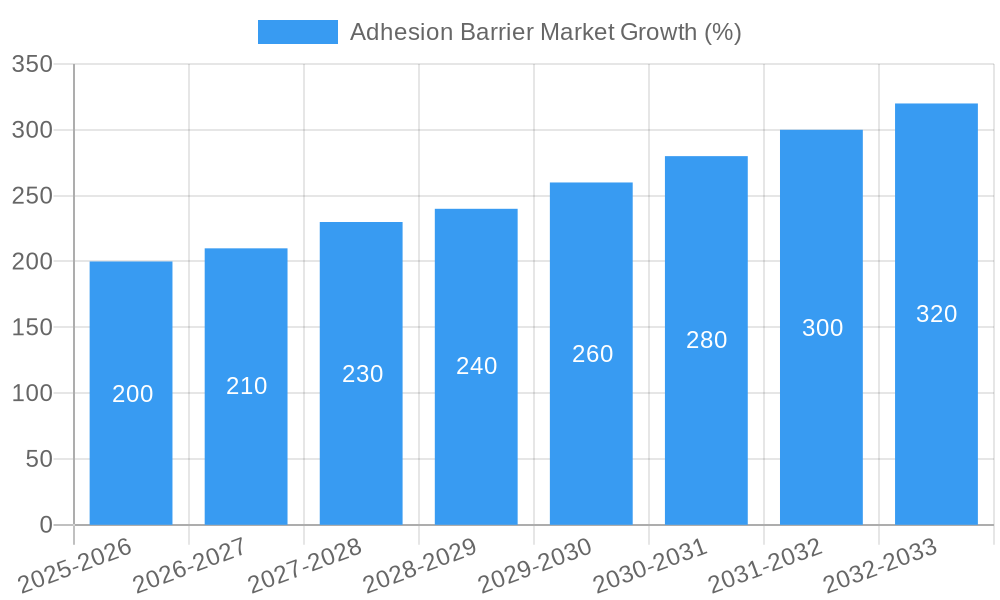
| Growth Rate | CAGR of 7.90% from 2019-2033 |
| Segmentation |
|
Table of Contents
- 1. Introduction
- 1.1. Research Scope
- 1.2. Market Segmentation
- 1.3. Research Methodology
- 1.4. Definitions and Assumptions
- 2. Executive Summary
- 2.1. Introduction
- 3. Market Dynamics
- 3.1. Introduction
- 3.2. Market Drivers
- 3.2.1. Increase in the Volume of Surgeries and Sports-related Injuries; Rising Awareness about the Medical Implications of Adhesions
- 3.3. Market Restrains
- 3.3.1. High Cost of Surgical Procedures Coupled with Side Effects Associated with Adhesion Barriers; Stringent Regulations Resulting in Limited Technological Innovations
- 3.4. Market Trends
- 3.4.1. Gynecological Surgeries Segment Expected to Witness Growth
- 4. Market Factor Analysis
- 4.1. Porters Five Forces
- 4.2. Supply/Value Chain
- 4.3. PESTEL analysis
- 4.4. Market Entropy
- 4.5. Patent/Trademark Analysis
- 5. Global Adhesion Barrier Market Analysis, Insights and Forecast, 2019-2031
- 5.1. Market Analysis, Insights and Forecast - by Product
- 5.1.1. Synthetic Adhesion Barriers
- 5.1.1.1. Hyaluronic Acid
- 5.1.1.2. Regenerated Cellulose
- 5.1.1.3. Polyethylene Glycol
- 5.1.1.4. Other Synthetic Adhesion Barriers
- 5.1.2. Natural Adhesion Barriers
- 5.1.2.1. Collagen
- 5.1.2.2. Fibrin
- 5.1.1. Synthetic Adhesion Barriers
- 5.2. Market Analysis, Insights and Forecast - by Formulation
- 5.2.1. Film
- 5.2.2. Liquid
- 5.2.3. Gel
- 5.3. Market Analysis, Insights and Forecast - by Application
- 5.3.1. General/Abdominal Surgeries
- 5.3.2. Gynecological Surgeries
- 5.3.3. Cardiovascular Surgeries
- 5.3.4. Orthopedic Surgeries
- 5.3.5. Neurological Surgeries
- 5.3.6. Other Applications
- 5.4. Market Analysis, Insights and Forecast - by Region
- 5.4.1. North America
- 5.4.2. Europe
- 5.4.3. Asia Pacific
- 5.4.4. Middle East and Africa
- 5.4.5. South America
- 5.1. Market Analysis, Insights and Forecast - by Product
- 6. North America Adhesion Barrier Market Analysis, Insights and Forecast, 2019-2031
- 6.1. Market Analysis, Insights and Forecast - by Product
- 6.1.1. Synthetic Adhesion Barriers
- 6.1.1.1. Hyaluronic Acid
- 6.1.1.2. Regenerated Cellulose
- 6.1.1.3. Polyethylene Glycol
- 6.1.1.4. Other Synthetic Adhesion Barriers
- 6.1.2. Natural Adhesion Barriers
- 6.1.2.1. Collagen
- 6.1.2.2. Fibrin
- 6.1.1. Synthetic Adhesion Barriers
- 6.2. Market Analysis, Insights and Forecast - by Formulation
- 6.2.1. Film
- 6.2.2. Liquid
- 6.2.3. Gel
- 6.3. Market Analysis, Insights and Forecast - by Application
- 6.3.1. General/Abdominal Surgeries
- 6.3.2. Gynecological Surgeries
- 6.3.3. Cardiovascular Surgeries
- 6.3.4. Orthopedic Surgeries
- 6.3.5. Neurological Surgeries
- 6.3.6. Other Applications
- 6.1. Market Analysis, Insights and Forecast - by Product
- 7. Europe Adhesion Barrier Market Analysis, Insights and Forecast, 2019-2031
- 7.1. Market Analysis, Insights and Forecast - by Product
- 7.1.1. Synthetic Adhesion Barriers
- 7.1.1.1. Hyaluronic Acid
- 7.1.1.2. Regenerated Cellulose
- 7.1.1.3. Polyethylene Glycol
- 7.1.1.4. Other Synthetic Adhesion Barriers
- 7.1.2. Natural Adhesion Barriers
- 7.1.2.1. Collagen
- 7.1.2.2. Fibrin
- 7.1.1. Synthetic Adhesion Barriers
- 7.2. Market Analysis, Insights and Forecast - by Formulation
- 7.2.1. Film
- 7.2.2. Liquid
- 7.2.3. Gel
- 7.3. Market Analysis, Insights and Forecast - by Application
- 7.3.1. General/Abdominal Surgeries
- 7.3.2. Gynecological Surgeries
- 7.3.3. Cardiovascular Surgeries
- 7.3.4. Orthopedic Surgeries
- 7.3.5. Neurological Surgeries
- 7.3.6. Other Applications
- 7.1. Market Analysis, Insights and Forecast - by Product
- 8. Asia Pacific Adhesion Barrier Market Analysis, Insights and Forecast, 2019-2031
- 8.1. Market Analysis, Insights and Forecast - by Product
- 8.1.1. Synthetic Adhesion Barriers
- 8.1.1.1. Hyaluronic Acid
- 8.1.1.2. Regenerated Cellulose
- 8.1.1.3. Polyethylene Glycol
- 8.1.1.4. Other Synthetic Adhesion Barriers
- 8.1.2. Natural Adhesion Barriers
- 8.1.2.1. Collagen
- 8.1.2.2. Fibrin
- 8.1.1. Synthetic Adhesion Barriers
- 8.2. Market Analysis, Insights and Forecast - by Formulation
- 8.2.1. Film
- 8.2.2. Liquid
- 8.2.3. Gel
- 8.3. Market Analysis, Insights and Forecast - by Application
- 8.3.1. General/Abdominal Surgeries
- 8.3.2. Gynecological Surgeries
- 8.3.3. Cardiovascular Surgeries
- 8.3.4. Orthopedic Surgeries
- 8.3.5. Neurological Surgeries
- 8.3.6. Other Applications
- 8.1. Market Analysis, Insights and Forecast - by Product
- 9. Middle East and Africa Adhesion Barrier Market Analysis, Insights and Forecast, 2019-2031
- 9.1. Market Analysis, Insights and Forecast - by Product
- 9.1.1. Synthetic Adhesion Barriers
- 9.1.1.1. Hyaluronic Acid
- 9.1.1.2. Regenerated Cellulose
- 9.1.1.3. Polyethylene Glycol
- 9.1.1.4. Other Synthetic Adhesion Barriers
- 9.1.2. Natural Adhesion Barriers
- 9.1.2.1. Collagen
- 9.1.2.2. Fibrin
- 9.1.1. Synthetic Adhesion Barriers
- 9.2. Market Analysis, Insights and Forecast - by Formulation
- 9.2.1. Film
- 9.2.2. Liquid
- 9.2.3. Gel
- 9.3. Market Analysis, Insights and Forecast - by Application
- 9.3.1. General/Abdominal Surgeries
- 9.3.2. Gynecological Surgeries
- 9.3.3. Cardiovascular Surgeries
- 9.3.4. Orthopedic Surgeries
- 9.3.5. Neurological Surgeries
- 9.3.6. Other Applications
- 9.1. Market Analysis, Insights and Forecast - by Product
- 10. South America Adhesion Barrier Market Analysis, Insights and Forecast, 2019-2031
- 10.1. Market Analysis, Insights and Forecast - by Product
- 10.1.1. Synthetic Adhesion Barriers
- 10.1.1.1. Hyaluronic Acid
- 10.1.1.2. Regenerated Cellulose
- 10.1.1.3. Polyethylene Glycol
- 10.1.1.4. Other Synthetic Adhesion Barriers
- 10.1.2. Natural Adhesion Barriers
- 10.1.2.1. Collagen
- 10.1.2.2. Fibrin
- 10.1.1. Synthetic Adhesion Barriers
- 10.2. Market Analysis, Insights and Forecast - by Formulation
- 10.2.1. Film
- 10.2.2. Liquid
- 10.2.3. Gel
- 10.3. Market Analysis, Insights and Forecast - by Application
- 10.3.1. General/Abdominal Surgeries
- 10.3.2. Gynecological Surgeries
- 10.3.3. Cardiovascular Surgeries
- 10.3.4. Orthopedic Surgeries
- 10.3.5. Neurological Surgeries
- 10.3.6. Other Applications
- 10.1. Market Analysis, Insights and Forecast - by Product
- 11. North America Adhesion Barrier Market Analysis, Insights and Forecast, 2019-2031
- 11.1. Market Analysis, Insights and Forecast - By Country/Sub-region
- 11.1.1. undefined
- 12. Europe Adhesion Barrier Market Analysis, Insights and Forecast, 2019-2031
- 12.1. Market Analysis, Insights and Forecast - By Country/Sub-region
- 12.1.1. undefined
- 13. Asia Pacific Adhesion Barrier Market Analysis, Insights and Forecast, 2019-2031
- 13.1. Market Analysis, Insights and Forecast - By Country/Sub-region
- 13.1.1. undefined
- 14. Middle East and Africa Adhesion Barrier Market Analysis, Insights and Forecast, 2019-2031
- 14.1. Market Analysis, Insights and Forecast - By Country/Sub-region
- 14.1.1. undefined
- 15. South America Adhesion Barrier Market Analysis, Insights and Forecast, 2019-2031
- 15.1. Market Analysis, Insights and Forecast - By Country/Sub-region
- 15.1.1. undefined
- 16. Competitive Analysis
- 16.1. Global Market Share Analysis 2024
- 16.2. Company Profiles
- 16.2.1 Betatech Medical
- 16.2.1.1. Overview
- 16.2.1.2. Products
- 16.2.1.3. SWOT Analysis
- 16.2.1.4. Recent Developments
- 16.2.1.5. Financials (Based on Availability)
- 16.2.2 Leader Biomedical
- 16.2.2.1. Overview
- 16.2.2.2. Products
- 16.2.2.3. SWOT Analysis
- 16.2.2.4. Recent Developments
- 16.2.2.5. Financials (Based on Availability)
- 16.2.3 FzioMed
- 16.2.3.1. Overview
- 16.2.3.2. Products
- 16.2.3.3. SWOT Analysis
- 16.2.3.4. Recent Developments
- 16.2.3.5. Financials (Based on Availability)
- 16.2.4 Anika Therapeutics
- 16.2.4.1. Overview
- 16.2.4.2. Products
- 16.2.4.3. SWOT Analysis
- 16.2.4.4. Recent Developments
- 16.2.4.5. Financials (Based on Availability)
- 16.2.5 GUNZE LIMITED
- 16.2.5.1. Overview
- 16.2.5.2. Products
- 16.2.5.3. SWOT Analysis
- 16.2.5.4. Recent Developments
- 16.2.5.5. Financials (Based on Availability)
- 16.2.6 TAICEND TECHNOLOGY CO LTD
- 16.2.6.1. Overview
- 16.2.6.2. Products
- 16.2.6.3. SWOT Analysis
- 16.2.6.4. Recent Developments
- 16.2.6.5. Financials (Based on Availability)
- 16.2.7 MAST Biosurgery
- 16.2.7.1. Overview
- 16.2.7.2. Products
- 16.2.7.3. SWOT Analysis
- 16.2.7.4. Recent Developments
- 16.2.7.5. Financials (Based on Availability)
- 16.2.8 Integra LifeSciences Holdings Corporation
- 16.2.8.1. Overview
- 16.2.8.2. Products
- 16.2.8.3. SWOT Analysis
- 16.2.8.4. Recent Developments
- 16.2.8.5. Financials (Based on Availability)
- 16.2.9 Johnson & Johnson
- 16.2.9.1. Overview
- 16.2.9.2. Products
- 16.2.9.3. SWOT Analysis
- 16.2.9.4. Recent Developments
- 16.2.9.5. Financials (Based on Availability)
- 16.2.10 Wuhan Sitaili Medical Apparatus Development Co
- 16.2.10.1. Overview
- 16.2.10.2. Products
- 16.2.10.3. SWOT Analysis
- 16.2.10.4. Recent Developments
- 16.2.10.5. Financials (Based on Availability)
- 16.2.11 Baxter International
- 16.2.11.1. Overview
- 16.2.11.2. Products
- 16.2.11.3. SWOT Analysis
- 16.2.11.4. Recent Developments
- 16.2.11.5. Financials (Based on Availability)
- 16.2.12 BIOSCOMPASS INC
- 16.2.12.1. Overview
- 16.2.12.2. Products
- 16.2.12.3. SWOT Analysis
- 16.2.12.4. Recent Developments
- 16.2.12.5. Financials (Based on Availability)
- 16.2.1 Betatech Medical
List of Figures
- Figure 1: Global Adhesion Barrier Market Revenue Breakdown (Million, %) by Region 2024 & 2032
- Figure 2: Global Adhesion Barrier Market Volume Breakdown (K Unit, %) by Region 2024 & 2032
- Figure 3: North America Adhesion Barrier Market Revenue (Million), by Country 2024 & 2032
- Figure 4: North America Adhesion Barrier Market Volume (K Unit), by Country 2024 & 2032
- Figure 5: North America Adhesion Barrier Market Revenue Share (%), by Country 2024 & 2032
- Figure 6: North America Adhesion Barrier Market Volume Share (%), by Country 2024 & 2032
- Figure 7: Europe Adhesion Barrier Market Revenue (Million), by Country 2024 & 2032
- Figure 8: Europe Adhesion Barrier Market Volume (K Unit), by Country 2024 & 2032
- Figure 9: Europe Adhesion Barrier Market Revenue Share (%), by Country 2024 & 2032
- Figure 10: Europe Adhesion Barrier Market Volume Share (%), by Country 2024 & 2032
- Figure 11: Asia Pacific Adhesion Barrier Market Revenue (Million), by Country 2024 & 2032
- Figure 12: Asia Pacific Adhesion Barrier Market Volume (K Unit), by Country 2024 & 2032
- Figure 13: Asia Pacific Adhesion Barrier Market Revenue Share (%), by Country 2024 & 2032
- Figure 14: Asia Pacific Adhesion Barrier Market Volume Share (%), by Country 2024 & 2032
- Figure 15: Middle East and Africa Adhesion Barrier Market Revenue (Million), by Country 2024 & 2032
- Figure 16: Middle East and Africa Adhesion Barrier Market Volume (K Unit), by Country 2024 & 2032
- Figure 17: Middle East and Africa Adhesion Barrier Market Revenue Share (%), by Country 2024 & 2032
- Figure 18: Middle East and Africa Adhesion Barrier Market Volume Share (%), by Country 2024 & 2032
- Figure 19: South America Adhesion Barrier Market Revenue (Million), by Country 2024 & 2032
- Figure 20: South America Adhesion Barrier Market Volume (K Unit), by Country 2024 & 2032
- Figure 21: South America Adhesion Barrier Market Revenue Share (%), by Country 2024 & 2032
- Figure 22: South America Adhesion Barrier Market Volume Share (%), by Country 2024 & 2032
- Figure 23: North America Adhesion Barrier Market Revenue (Million), by Product 2024 & 2032
- Figure 24: North America Adhesion Barrier Market Volume (K Unit), by Product 2024 & 2032
- Figure 25: North America Adhesion Barrier Market Revenue Share (%), by Product 2024 & 2032
- Figure 26: North America Adhesion Barrier Market Volume Share (%), by Product 2024 & 2032
- Figure 27: North America Adhesion Barrier Market Revenue (Million), by Formulation 2024 & 2032
- Figure 28: North America Adhesion Barrier Market Volume (K Unit), by Formulation 2024 & 2032
- Figure 29: North America Adhesion Barrier Market Revenue Share (%), by Formulation 2024 & 2032
- Figure 30: North America Adhesion Barrier Market Volume Share (%), by Formulation 2024 & 2032
- Figure 31: North America Adhesion Barrier Market Revenue (Million), by Application 2024 & 2032
- Figure 32: North America Adhesion Barrier Market Volume (K Unit), by Application 2024 & 2032
- Figure 33: North America Adhesion Barrier Market Revenue Share (%), by Application 2024 & 2032
- Figure 34: North America Adhesion Barrier Market Volume Share (%), by Application 2024 & 2032
- Figure 35: North America Adhesion Barrier Market Revenue (Million), by Country 2024 & 2032
- Figure 36: North America Adhesion Barrier Market Volume (K Unit), by Country 2024 & 2032
- Figure 37: North America Adhesion Barrier Market Revenue Share (%), by Country 2024 & 2032
- Figure 38: North America Adhesion Barrier Market Volume Share (%), by Country 2024 & 2032
- Figure 39: Europe Adhesion Barrier Market Revenue (Million), by Product 2024 & 2032
- Figure 40: Europe Adhesion Barrier Market Volume (K Unit), by Product 2024 & 2032
- Figure 41: Europe Adhesion Barrier Market Revenue Share (%), by Product 2024 & 2032
- Figure 42: Europe Adhesion Barrier Market Volume Share (%), by Product 2024 & 2032
- Figure 43: Europe Adhesion Barrier Market Revenue (Million), by Formulation 2024 & 2032
- Figure 44: Europe Adhesion Barrier Market Volume (K Unit), by Formulation 2024 & 2032
- Figure 45: Europe Adhesion Barrier Market Revenue Share (%), by Formulation 2024 & 2032
- Figure 46: Europe Adhesion Barrier Market Volume Share (%), by Formulation 2024 & 2032
- Figure 47: Europe Adhesion Barrier Market Revenue (Million), by Application 2024 & 2032
- Figure 48: Europe Adhesion Barrier Market Volume (K Unit), by Application 2024 & 2032
- Figure 49: Europe Adhesion Barrier Market Revenue Share (%), by Application 2024 & 2032
- Figure 50: Europe Adhesion Barrier Market Volume Share (%), by Application 2024 & 2032
- Figure 51: Europe Adhesion Barrier Market Revenue (Million), by Country 2024 & 2032
- Figure 52: Europe Adhesion Barrier Market Volume (K Unit), by Country 2024 & 2032
- Figure 53: Europe Adhesion Barrier Market Revenue Share (%), by Country 2024 & 2032
- Figure 54: Europe Adhesion Barrier Market Volume Share (%), by Country 2024 & 2032
- Figure 55: Asia Pacific Adhesion Barrier Market Revenue (Million), by Product 2024 & 2032
- Figure 56: Asia Pacific Adhesion Barrier Market Volume (K Unit), by Product 2024 & 2032
- Figure 57: Asia Pacific Adhesion Barrier Market Revenue Share (%), by Product 2024 & 2032
- Figure 58: Asia Pacific Adhesion Barrier Market Volume Share (%), by Product 2024 & 2032
- Figure 59: Asia Pacific Adhesion Barrier Market Revenue (Million), by Formulation 2024 & 2032
- Figure 60: Asia Pacific Adhesion Barrier Market Volume (K Unit), by Formulation 2024 & 2032
- Figure 61: Asia Pacific Adhesion Barrier Market Revenue Share (%), by Formulation 2024 & 2032
- Figure 62: Asia Pacific Adhesion Barrier Market Volume Share (%), by Formulation 2024 & 2032
- Figure 63: Asia Pacific Adhesion Barrier Market Revenue (Million), by Application 2024 & 2032
- Figure 64: Asia Pacific Adhesion Barrier Market Volume (K Unit), by Application 2024 & 2032
- Figure 65: Asia Pacific Adhesion Barrier Market Revenue Share (%), by Application 2024 & 2032
- Figure 66: Asia Pacific Adhesion Barrier Market Volume Share (%), by Application 2024 & 2032
- Figure 67: Asia Pacific Adhesion Barrier Market Revenue (Million), by Country 2024 & 2032
- Figure 68: Asia Pacific Adhesion Barrier Market Volume (K Unit), by Country 2024 & 2032
- Figure 69: Asia Pacific Adhesion Barrier Market Revenue Share (%), by Country 2024 & 2032
- Figure 70: Asia Pacific Adhesion Barrier Market Volume Share (%), by Country 2024 & 2032
- Figure 71: Middle East and Africa Adhesion Barrier Market Revenue (Million), by Product 2024 & 2032
- Figure 72: Middle East and Africa Adhesion Barrier Market Volume (K Unit), by Product 2024 & 2032
- Figure 73: Middle East and Africa Adhesion Barrier Market Revenue Share (%), by Product 2024 & 2032
- Figure 74: Middle East and Africa Adhesion Barrier Market Volume Share (%), by Product 2024 & 2032
- Figure 75: Middle East and Africa Adhesion Barrier Market Revenue (Million), by Formulation 2024 & 2032
- Figure 76: Middle East and Africa Adhesion Barrier Market Volume (K Unit), by Formulation 2024 & 2032
- Figure 77: Middle East and Africa Adhesion Barrier Market Revenue Share (%), by Formulation 2024 & 2032
- Figure 78: Middle East and Africa Adhesion Barrier Market Volume Share (%), by Formulation 2024 & 2032
- Figure 79: Middle East and Africa Adhesion Barrier Market Revenue (Million), by Application 2024 & 2032
- Figure 80: Middle East and Africa Adhesion Barrier Market Volume (K Unit), by Application 2024 & 2032
- Figure 81: Middle East and Africa Adhesion Barrier Market Revenue Share (%), by Application 2024 & 2032
- Figure 82: Middle East and Africa Adhesion Barrier Market Volume Share (%), by Application 2024 & 2032
- Figure 83: Middle East and Africa Adhesion Barrier Market Revenue (Million), by Country 2024 & 2032
- Figure 84: Middle East and Africa Adhesion Barrier Market Volume (K Unit), by Country 2024 & 2032
- Figure 85: Middle East and Africa Adhesion Barrier Market Revenue Share (%), by Country 2024 & 2032
- Figure 86: Middle East and Africa Adhesion Barrier Market Volume Share (%), by Country 2024 & 2032
- Figure 87: South America Adhesion Barrier Market Revenue (Million), by Product 2024 & 2032
- Figure 88: South America Adhesion Barrier Market Volume (K Unit), by Product 2024 & 2032
- Figure 89: South America Adhesion Barrier Market Revenue Share (%), by Product 2024 & 2032
- Figure 90: South America Adhesion Barrier Market Volume Share (%), by Product 2024 & 2032
- Figure 91: South America Adhesion Barrier Market Revenue (Million), by Formulation 2024 & 2032
- Figure 92: South America Adhesion Barrier Market Volume (K Unit), by Formulation 2024 & 2032
- Figure 93: South America Adhesion Barrier Market Revenue Share (%), by Formulation 2024 & 2032
- Figure 94: South America Adhesion Barrier Market Volume Share (%), by Formulation 2024 & 2032
- Figure 95: South America Adhesion Barrier Market Revenue (Million), by Application 2024 & 2032
- Figure 96: South America Adhesion Barrier Market Volume (K Unit), by Application 2024 & 2032
- Figure 97: South America Adhesion Barrier Market Revenue Share (%), by Application 2024 & 2032
- Figure 98: South America Adhesion Barrier Market Volume Share (%), by Application 2024 & 2032
- Figure 99: South America Adhesion Barrier Market Revenue (Million), by Country 2024 & 2032
- Figure 100: South America Adhesion Barrier Market Volume (K Unit), by Country 2024 & 2032
- Figure 101: South America Adhesion Barrier Market Revenue Share (%), by Country 2024 & 2032
- Figure 102: South America Adhesion Barrier Market Volume Share (%), by Country 2024 & 2032
List of Tables
- Table 1: Global Adhesion Barrier Market Revenue Million Forecast, by Region 2019 & 2032
- Table 2: Global Adhesion Barrier Market Volume K Unit Forecast, by Region 2019 & 2032
- Table 3: Global Adhesion Barrier Market Revenue Million Forecast, by Product 2019 & 2032
- Table 4: Global Adhesion Barrier Market Volume K Unit Forecast, by Product 2019 & 2032
- Table 5: Global Adhesion Barrier Market Revenue Million Forecast, by Formulation 2019 & 2032
- Table 6: Global Adhesion Barrier Market Volume K Unit Forecast, by Formulation 2019 & 2032
- Table 7: Global Adhesion Barrier Market Revenue Million Forecast, by Application 2019 & 2032
- Table 8: Global Adhesion Barrier Market Volume K Unit Forecast, by Application 2019 & 2032
- Table 9: Global Adhesion Barrier Market Revenue Million Forecast, by Region 2019 & 2032
- Table 10: Global Adhesion Barrier Market Volume K Unit Forecast, by Region 2019 & 2032
- Table 11: Global Adhesion Barrier Market Revenue Million Forecast, by Country 2019 & 2032
- Table 12: Global Adhesion Barrier Market Volume K Unit Forecast, by Country 2019 & 2032
- Table 13: Global Adhesion Barrier Market Revenue Million Forecast, by Country 2019 & 2032
- Table 14: Global Adhesion Barrier Market Volume K Unit Forecast, by Country 2019 & 2032
- Table 15: Global Adhesion Barrier Market Revenue Million Forecast, by Country 2019 & 2032
- Table 16: Global Adhesion Barrier Market Volume K Unit Forecast, by Country 2019 & 2032
- Table 17: Global Adhesion Barrier Market Revenue Million Forecast, by Country 2019 & 2032
- Table 18: Global Adhesion Barrier Market Volume K Unit Forecast, by Country 2019 & 2032
- Table 19: Global Adhesion Barrier Market Revenue Million Forecast, by Country 2019 & 2032
- Table 20: Global Adhesion Barrier Market Volume K Unit Forecast, by Country 2019 & 2032
- Table 21: Global Adhesion Barrier Market Revenue Million Forecast, by Product 2019 & 2032
- Table 22: Global Adhesion Barrier Market Volume K Unit Forecast, by Product 2019 & 2032
- Table 23: Global Adhesion Barrier Market Revenue Million Forecast, by Formulation 2019 & 2032
- Table 24: Global Adhesion Barrier Market Volume K Unit Forecast, by Formulation 2019 & 2032
- Table 25: Global Adhesion Barrier Market Revenue Million Forecast, by Application 2019 & 2032
- Table 26: Global Adhesion Barrier Market Volume K Unit Forecast, by Application 2019 & 2032
- Table 27: Global Adhesion Barrier Market Revenue Million Forecast, by Country 2019 & 2032
- Table 28: Global Adhesion Barrier Market Volume K Unit Forecast, by Country 2019 & 2032
- Table 29: United States Adhesion Barrier Market Revenue (Million) Forecast, by Application 2019 & 2032
- Table 30: United States Adhesion Barrier Market Volume (K Unit) Forecast, by Application 2019 & 2032
- Table 31: Canada Adhesion Barrier Market Revenue (Million) Forecast, by Application 2019 & 2032
- Table 32: Canada Adhesion Barrier Market Volume (K Unit) Forecast, by Application 2019 & 2032
- Table 33: Mexico Adhesion Barrier Market Revenue (Million) Forecast, by Application 2019 & 2032
- Table 34: Mexico Adhesion Barrier Market Volume (K Unit) Forecast, by Application 2019 & 2032
- Table 35: Global Adhesion Barrier Market Revenue Million Forecast, by Product 2019 & 2032
- Table 36: Global Adhesion Barrier Market Volume K Unit Forecast, by Product 2019 & 2032
- Table 37: Global Adhesion Barrier Market Revenue Million Forecast, by Formulation 2019 & 2032
- Table 38: Global Adhesion Barrier Market Volume K Unit Forecast, by Formulation 2019 & 2032
- Table 39: Global Adhesion Barrier Market Revenue Million Forecast, by Application 2019 & 2032
- Table 40: Global Adhesion Barrier Market Volume K Unit Forecast, by Application 2019 & 2032
- Table 41: Global Adhesion Barrier Market Revenue Million Forecast, by Country 2019 & 2032
- Table 42: Global Adhesion Barrier Market Volume K Unit Forecast, by Country 2019 & 2032
- Table 43: Germany Adhesion Barrier Market Revenue (Million) Forecast, by Application 2019 & 2032
- Table 44: Germany Adhesion Barrier Market Volume (K Unit) Forecast, by Application 2019 & 2032
- Table 45: United Kingdom Adhesion Barrier Market Revenue (Million) Forecast, by Application 2019 & 2032
- Table 46: United Kingdom Adhesion Barrier Market Volume (K Unit) Forecast, by Application 2019 & 2032
- Table 47: France Adhesion Barrier Market Revenue (Million) Forecast, by Application 2019 & 2032
- Table 48: France Adhesion Barrier Market Volume (K Unit) Forecast, by Application 2019 & 2032
- Table 49: Italy Adhesion Barrier Market Revenue (Million) Forecast, by Application 2019 & 2032
- Table 50: Italy Adhesion Barrier Market Volume (K Unit) Forecast, by Application 2019 & 2032
- Table 51: Spain Adhesion Barrier Market Revenue (Million) Forecast, by Application 2019 & 2032
- Table 52: Spain Adhesion Barrier Market Volume (K Unit) Forecast, by Application 2019 & 2032
- Table 53: Rest of Europe Adhesion Barrier Market Revenue (Million) Forecast, by Application 2019 & 2032
- Table 54: Rest of Europe Adhesion Barrier Market Volume (K Unit) Forecast, by Application 2019 & 2032
- Table 55: Global Adhesion Barrier Market Revenue Million Forecast, by Product 2019 & 2032
- Table 56: Global Adhesion Barrier Market Volume K Unit Forecast, by Product 2019 & 2032
- Table 57: Global Adhesion Barrier Market Revenue Million Forecast, by Formulation 2019 & 2032
- Table 58: Global Adhesion Barrier Market Volume K Unit Forecast, by Formulation 2019 & 2032
- Table 59: Global Adhesion Barrier Market Revenue Million Forecast, by Application 2019 & 2032
- Table 60: Global Adhesion Barrier Market Volume K Unit Forecast, by Application 2019 & 2032
- Table 61: Global Adhesion Barrier Market Revenue Million Forecast, by Country 2019 & 2032
- Table 62: Global Adhesion Barrier Market Volume K Unit Forecast, by Country 2019 & 2032
- Table 63: China Adhesion Barrier Market Revenue (Million) Forecast, by Application 2019 & 2032
- Table 64: China Adhesion Barrier Market Volume (K Unit) Forecast, by Application 2019 & 2032
- Table 65: Japan Adhesion Barrier Market Revenue (Million) Forecast, by Application 2019 & 2032
- Table 66: Japan Adhesion Barrier Market Volume (K Unit) Forecast, by Application 2019 & 2032
- Table 67: India Adhesion Barrier Market Revenue (Million) Forecast, by Application 2019 & 2032
- Table 68: India Adhesion Barrier Market Volume (K Unit) Forecast, by Application 2019 & 2032
- Table 69: Australia Adhesion Barrier Market Revenue (Million) Forecast, by Application 2019 & 2032
- Table 70: Australia Adhesion Barrier Market Volume (K Unit) Forecast, by Application 2019 & 2032
- Table 71: South korea Adhesion Barrier Market Revenue (Million) Forecast, by Application 2019 & 2032
- Table 72: South korea Adhesion Barrier Market Volume (K Unit) Forecast, by Application 2019 & 2032
- Table 73: Rest of Asia Pacific Adhesion Barrier Market Revenue (Million) Forecast, by Application 2019 & 2032
- Table 74: Rest of Asia Pacific Adhesion Barrier Market Volume (K Unit) Forecast, by Application 2019 & 2032
- Table 75: Global Adhesion Barrier Market Revenue Million Forecast, by Product 2019 & 2032
- Table 76: Global Adhesion Barrier Market Volume K Unit Forecast, by Product 2019 & 2032
- Table 77: Global Adhesion Barrier Market Revenue Million Forecast, by Formulation 2019 & 2032
- Table 78: Global Adhesion Barrier Market Volume K Unit Forecast, by Formulation 2019 & 2032
- Table 79: Global Adhesion Barrier Market Revenue Million Forecast, by Application 2019 & 2032
- Table 80: Global Adhesion Barrier Market Volume K Unit Forecast, by Application 2019 & 2032
- Table 81: Global Adhesion Barrier Market Revenue Million Forecast, by Country 2019 & 2032
- Table 82: Global Adhesion Barrier Market Volume K Unit Forecast, by Country 2019 & 2032
- Table 83: GCC Adhesion Barrier Market Revenue (Million) Forecast, by Application 2019 & 2032
- Table 84: GCC Adhesion Barrier Market Volume (K Unit) Forecast, by Application 2019 & 2032
- Table 85: South Africa Adhesion Barrier Market Revenue (Million) Forecast, by Application 2019 & 2032
- Table 86: South Africa Adhesion Barrier Market Volume (K Unit) Forecast, by Application 2019 & 2032
- Table 87: Rest of Middle East and Africa Adhesion Barrier Market Revenue (Million) Forecast, by Application 2019 & 2032
- Table 88: Rest of Middle East and Africa Adhesion Barrier Market Volume (K Unit) Forecast, by Application 2019 & 2032
- Table 89: Global Adhesion Barrier Market Revenue Million Forecast, by Product 2019 & 2032
- Table 90: Global Adhesion Barrier Market Volume K Unit Forecast, by Product 2019 & 2032
- Table 91: Global Adhesion Barrier Market Revenue Million Forecast, by Formulation 2019 & 2032
- Table 92: Global Adhesion Barrier Market Volume K Unit Forecast, by Formulation 2019 & 2032
- Table 93: Global Adhesion Barrier Market Revenue Million Forecast, by Application 2019 & 2032
- Table 94: Global Adhesion Barrier Market Volume K Unit Forecast, by Application 2019 & 2032
- Table 95: Global Adhesion Barrier Market Revenue Million Forecast, by Country 2019 & 2032
- Table 96: Global Adhesion Barrier Market Volume K Unit Forecast, by Country 2019 & 2032
- Table 97: Brazil Adhesion Barrier Market Revenue (Million) Forecast, by Application 2019 & 2032
- Table 98: Brazil Adhesion Barrier Market Volume (K Unit) Forecast, by Application 2019 & 2032
- Table 99: Argentina Adhesion Barrier Market Revenue (Million) Forecast, by Application 2019 & 2032
- Table 100: Argentina Adhesion Barrier Market Volume (K Unit) Forecast, by Application 2019 & 2032
- Table 101: Rest of South America Adhesion Barrier Market Revenue (Million) Forecast, by Application 2019 & 2032
- Table 102: Rest of South America Adhesion Barrier Market Volume (K Unit) Forecast, by Application 2019 & 2032
Frequently Asked Questions
1. What is the projected Compound Annual Growth Rate (CAGR) of the Adhesion Barrier Market?
The projected CAGR is approximately 7.90%.
2. Which companies are prominent players in the Adhesion Barrier Market?
Key companies in the market include Betatech Medical, Leader Biomedical, FzioMed, Anika Therapeutics, GUNZE LIMITED, TAICEND TECHNOLOGY CO LTD, MAST Biosurgery, Integra LifeSciences Holdings Corporation, Johnson & Johnson, Wuhan Sitaili Medical Apparatus Development Co, Baxter International, BIOSCOMPASS INC.
3. What are the main segments of the Adhesion Barrier Market?
The market segments include Product, Formulation, Application.
4. Can you provide details about the market size?
The market size is estimated to be USD XX Million as of 2022.
5. What are some drivers contributing to market growth?
Increase in the Volume of Surgeries and Sports-related Injuries; Rising Awareness about the Medical Implications of Adhesions.
6. What are the notable trends driving market growth?
Gynecological Surgeries Segment Expected to Witness Growth.
7. Are there any restraints impacting market growth?
High Cost of Surgical Procedures Coupled with Side Effects Associated with Adhesion Barriers; Stringent Regulations Resulting in Limited Technological Innovations.
8. Can you provide examples of recent developments in the market?
June 2022: CGBIO launched MEDICLORE, an anti-adhesion agent in Indonesia. MEDICLORE inhibits adhesion by changing from sol to gel form by body temperature when applied to the body.
9. What pricing options are available for accessing the report?
Pricing options include single-user, multi-user, and enterprise licenses priced at USD 4750, USD 5250, and USD 8750 respectively.
10. Is the market size provided in terms of value or volume?
The market size is provided in terms of value, measured in Million and volume, measured in K Unit.
11. Are there any specific market keywords associated with the report?
Yes, the market keyword associated with the report is "Adhesion Barrier Market," which aids in identifying and referencing the specific market segment covered.
12. How do I determine which pricing option suits my needs best?
The pricing options vary based on user requirements and access needs. Individual users may opt for single-user licenses, while businesses requiring broader access may choose multi-user or enterprise licenses for cost-effective access to the report.
13. Are there any additional resources or data provided in the Adhesion Barrier Market report?
While the report offers comprehensive insights, it's advisable to review the specific contents or supplementary materials provided to ascertain if additional resources or data are available.
14. How can I stay updated on further developments or reports in the Adhesion Barrier Market?
To stay informed about further developments, trends, and reports in the Adhesion Barrier Market, consider subscribing to industry newsletters, following relevant companies and organizations, or regularly checking reputable industry news sources and publications.
Methodology
Step 1 - Identification of Relevant Samples Size from Population Database


Step 2 - Approaches for Defining Global Market Size (Value, Volume* & Price*)

Note*: In applicable scenarios
Step 3 - Data Sources
Primary Research
- Web Analytics
- Survey Reports
- Research Institute
- Latest Research Reports
- Opinion Leaders
Secondary Research
- Annual Reports
- White Paper
- Latest Press Release
- Industry Association
- Paid Database
- Investor Presentations

Step 4 - Data Triangulation
Involves using different sources of information in order to increase the validity of a study
These sources are likely to be stakeholders in a program - participants, other researchers, program staff, other community members, and so on.
Then we put all data in single framework & apply various statistical tools to find out the dynamic on the market.
During the analysis stage, feedback from the stakeholder groups would be compared to determine areas of agreement as well as areas of divergence


