Key Insights
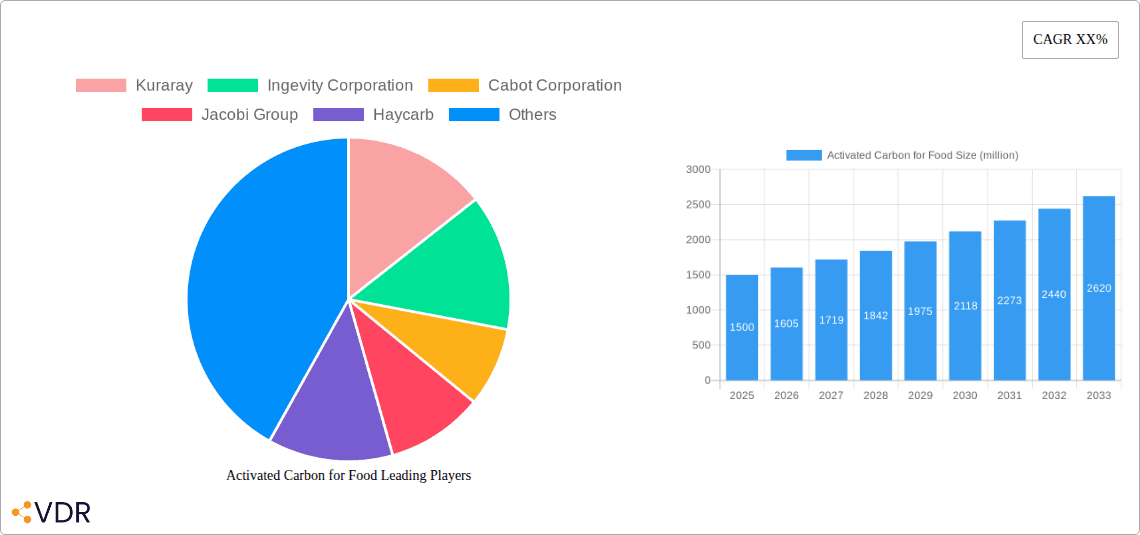
The global Activated Carbon for Food market is poised for robust expansion, projected to reach a valuation of approximately $1,500 million by 2025, with a compelling Compound Annual Growth Rate (CAGR) of around 6.5% anticipated through 2033. This growth trajectory is primarily fueled by the escalating demand for purity and safety in food processing and beverage production. As consumers become increasingly health-conscious and regulatory bodies enforce stricter quality standards, the application of activated carbon in decolorization, purification, and odor removal across various food products is gaining significant traction. Key drivers include the expansion of the processed food industry, the rising popularity of functional beverages requiring specialized filtration, and the continuous innovation in activated carbon manufacturing to cater to specific food grade requirements. The Fermentation Industry, Food Additives, and Beverages segments are expected to lead this growth, driven by the need for high-performance adsorbents that ensure product integrity and shelf-life.
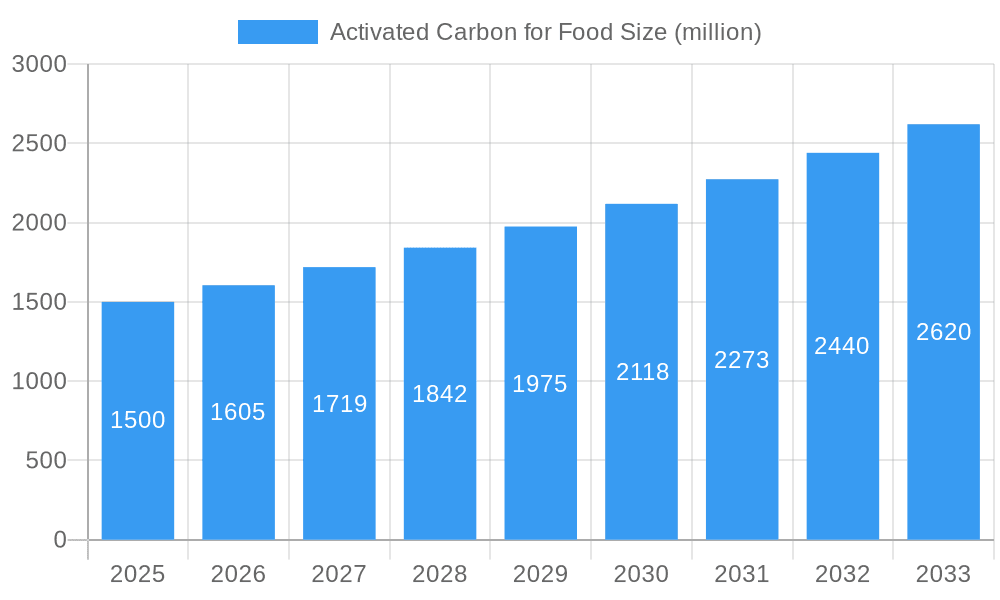
Activated Carbon for Food Market Size (In Billion)

Further bolstering the market's positive outlook are key trends such as the development of novel activated carbon materials with enhanced adsorption capacities and selectivity, alongside a growing preference for sustainable and eco-friendly sourcing and production methods. The market is witnessing increased adoption of activated carbon derived from renewable resources like coconut shells and wood, aligning with global sustainability initiatives. However, the market also faces certain restraints, including the volatile raw material prices and the initial capital investment required for advanced manufacturing facilities. Nevertheless, the persistent demand for high-quality, safe, and aesthetically appealing food and beverage products, coupled with the technological advancements in activated carbon applications, are expected to outweigh these challenges, ensuring a dynamic and growing market landscape. The Asia Pacific region, particularly China and India, is emerging as a significant growth hub due to its rapidly expanding food processing sector and increasing disposable incomes.
Activated Carbon for Food Company Market Share
This report provides an in-depth analysis of the global Activated Carbon for Food market, offering critical insights into market dynamics, growth trends, regional dominance, product landscape, and key players. With a study period spanning from 2019 to 2033, and a base year of 2025, this comprehensive report is essential for industry stakeholders seeking to understand and capitalize on opportunities within this vital sector. We examine its role across various applications and types, catering to segments like the Fermentation Industry, Food Additives, and Beverages.
Activated Carbon for Food Market Dynamics & Structure
The Activated Carbon for Food market exhibits a moderately concentrated structure, characterized by the presence of both large, established players and emerging specialized manufacturers. Technological innovation plays a pivotal role, driven by the demand for higher purity, tailored pore structures, and improved adsorption capacities for specific food contaminants. Regulatory frameworks, particularly those governing food safety and additive usage, significantly influence market entry and product development, demanding adherence to stringent quality standards. Competitive product substitutes, such as ion exchange resins and alternative purification methods, present a dynamic competitive landscape, necessitating continuous product improvement and cost-effectiveness. End-user demographics are shifting towards health-conscious consumers seeking cleaner labels and natural processing aids, driving demand for high-performance activated carbon. Mergers and acquisitions (M&A) trends are moderate, indicating strategic consolidation and vertical integration to enhance market reach and technological capabilities.
- Market Concentration: Moderate, with key global players and regional specialists.
- Technological Innovation Drivers: Demand for enhanced purity, specific adsorption, and eco-friendly production.
- Regulatory Frameworks: Stringent food safety regulations (e.g., FDA, EFSA) influencing product compliance and quality control.
- Competitive Product Substitutes: Ion exchange resins, activated alumina, filtration membranes.
- End-User Demographics: Increasing preference for natural ingredients, clean labels, and minimally processed foods.
- M&A Trends: Strategic acquisitions for technology enhancement and market expansion, with approximately 5-10 significant deals observed historically.
Activated Carbon for Food Growth Trends & Insights
The Activated Carbon for Food market is projected for robust growth, fueled by an increasing global demand for safe, high-quality food products and beverages. The market size evolution indicates a steady upward trajectory, with significant expansion anticipated over the forecast period. Adoption rates are accelerating, particularly in emerging economies where food processing infrastructure is rapidly developing and food safety standards are being enhanced. Technological disruptions are centered around the development of specialized activated carbons with precisely engineered pore structures and surface chemistries to target specific impurities like off-flavors, colors, and residual contaminants. Consumer behavior shifts towards natural processing aids and cleaner labels are a significant catalyst, pushing food manufacturers to adopt more sophisticated purification methods. The market penetration of activated carbon in various food applications is deepening, moving beyond traditional uses to encompass advanced decolorization, deodorization, and purification processes. This growth is underpinned by an estimated Compound Annual Growth Rate (CAGR) of 6.5% during the forecast period. The total market valuation is expected to reach $2,850.5 million by 2033, from approximately $1,820.2 million in 2025.
Dominant Regions, Countries, or Segments in Activated Carbon for Food
The Fermentation Industry segment is a dominant driver within the global Activated Carbon for Food market. Its extensive use in the purification of amino acids, vitamins, enzymes, and organic acids, critical components for a vast array of food products, positions it at the forefront of demand. Coupled with the Beverages sector, which utilizes activated carbon for decolorization, deodorization, and removal of undesirable taste compounds in products like soft drinks, alcoholic beverages, and fruit juices, these two segments collectively represent over 60% of the market share.
Dominant Segment: Fermentation Industry:
- Essential for purifying fermentation-derived products such as amino acids (e.g., lysine, glutamic acid), vitamins (e.g., B vitamins), and organic acids (e.g., citric acid, lactic acid).
- Crucial for removing impurities and achieving desired purity levels for food-grade ingredients.
- Estimated market share of 35%.
Strong Contributor: Beverages:
- Widely employed for decolorization and deodorization of sugar syrups, sweeteners, and finished beverages.
- Effective in removing unwanted tastes and odors from drinking water and bottled beverages.
- Estimated market share of 28%.
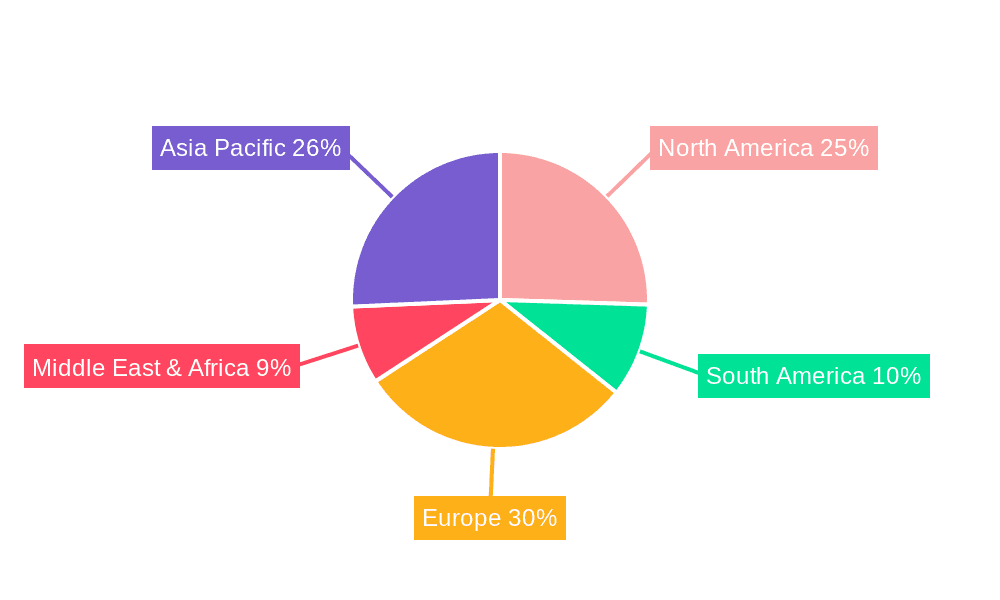
Key Regions:
- North America: High demand driven by stringent food safety regulations and advanced food processing technologies. Significant market share of approximately 25%.
- Europe: Strong emphasis on clean label products and natural food processing methods, contributing to a substantial market share of around 23%.
- Asia Pacific: Rapidly growing market due to increasing food production, expanding processed food industry, and rising consumer awareness of food quality, with an estimated 30% growth rate.
Activated Carbon for Food Product Landscape
The Activated Carbon for Food product landscape is characterized by a focus on highly purified grades with tailored pore size distributions and surface functionalities. Innovations are geared towards enhancing adsorption efficiency for specific contaminants, such as mycotoxins, pesticides, and processing byproducts. Products designed for decolorization of sugars, oils, and fats, as well as deodorization of beverages and savory products, represent key offerings. Performance metrics revolve around adsorption capacity, selectivity, regeneration efficiency, and compliance with global food contact regulations.
Key Drivers, Barriers & Challenges in Activated Carbon for Food
Key Drivers:
- Rising Food Safety Standards: Increasing global demand for safe and contaminant-free food products drives the adoption of activated carbon for purification.
- Growth in Processed Foods and Beverages: The expanding processed food and beverage industry necessitates effective purification solutions for ingredients and finished goods.
- Clean Label and Natural Processing Trends: Consumer preference for natural ingredients and minimally processed foods favors activated carbon as a chemical-free purification agent.
- Technological Advancements: Development of specialized activated carbons with improved efficiency and selectivity for specific food contaminants.
Barriers & Challenges:
- Cost of Production: High-purity activated carbon can be expensive, impacting its widespread adoption in price-sensitive markets.
- Regulatory Hurdles: Stringent approval processes and varying regulations across different regions can slow down market entry and product development.
- Competition from Substitutes: Alternative purification technologies, though sometimes less effective for certain applications, pose a competitive threat.
- Supply Chain Volatility: Fluctuations in raw material availability and logistics can impact pricing and supply stability.
Emerging Opportunities in Activated Carbon for Food
Emerging opportunities lie in the development of novel activated carbon applications for allergen removal from food processing equipment and ingredients. The growing demand for plant-based alternatives in the food industry presents a significant avenue for activated carbon to aid in decolorizing and deodorizing these novel ingredients. Furthermore, advancements in activated carbon regeneration technologies can lead to more sustainable and cost-effective solutions, opening up new market segments.
Growth Accelerators in the Activated Carbon for Food Industry
Growth accelerators in the Activated Carbon for Food industry are primarily driven by ongoing research and development focused on creating highly selective and efficient activated carbons for niche applications. Strategic partnerships between activated carbon manufacturers and food processing companies are crucial for co-developing tailored purification solutions. Market expansion into developing economies with improving food standards and increasing disposable incomes also acts as a significant growth catalyst.
Key Players Shaping the Activated Carbon for Food Market
- Kuraray
- Ingevity Corporation
- Cabot Corporation
- Jacobi Group
- Haycarb
- Chemviron
- Boyce Carbon
- Calgon Carbon Corporation
- CPL Activated Carbons
- UES
- Ecofriend Carbon
- Activated Carbon Solutions Inc
- CG Carbon
- Fujian Yuanli Active Carbon Co.,Ltd.
- Jiangsu Zhuxi Activated Carbon Co.,Ltd.
- Shanghai Xinjinhu Activated Carbon Co.,Ltd.
- Guangdong Hanyan Activated Carbon Technology Co.,Ltd.
- Chengdu Senle Environmental Protection Technology Co.,Ltd.
- Qizhong Chemical Industry
Notable Milestones in Activated Carbon for Food Sector
- 2022: Launch of novel, high-performance powdered activated carbons for enhanced mycotoxin removal by a leading manufacturer.
- 2023: Acquisition of a specialized activated carbon producer by a global chemical company to strengthen its food-grade offerings.
- 2024: Significant investment in R&D for sustainable activated carbon production from agricultural waste, aiming for reduced environmental impact.
- 2024: Introduction of advanced particle-based activated carbon with superior flow characteristics for continuous food processing applications.
In-Depth Activated Carbon for Food Market Outlook
The future outlook for the Activated Carbon for Food market is highly promising, with continued growth driven by innovation and expanding applications. The increasing emphasis on food safety, coupled with consumer demand for cleaner and more natural food products, will sustain the demand for high-quality activated carbon. Strategic investments in advanced manufacturing processes and the exploration of new raw material sources will further solidify market growth. Collaboration between industry players and regulatory bodies will be crucial in navigating future challenges and unlocking the full potential of this vital sector. The market is poised for substantial expansion, reaching an estimated $2,850.5 million by 2033.
Activated Carbon for Food Segmentation
-
1. Application
- 1.1. Fermentation Industry
- 1.2. Food Additives
- 1.3. Beverages
- 1.4. Other
-
2. Types
- 2.1. Powder
- 2.2. Particles
Activated Carbon for Food Segmentation By Geography
-
1. North America
- 1.1. United States
- 1.2. Canada
- 1.3. Mexico
-
2. South America
- 2.1. Brazil
- 2.2. Argentina
- 2.3. Rest of South America
-
3. Europe
- 3.1. United Kingdom
- 3.2. Germany
- 3.3. France
- 3.4. Italy
- 3.5. Spain
- 3.6. Russia
- 3.7. Benelux
- 3.8. Nordics
- 3.9. Rest of Europe
-
4. Middle East & Africa
- 4.1. Turkey
- 4.2. Israel
- 4.3. GCC
- 4.4. North Africa
- 4.5. South Africa
- 4.6. Rest of Middle East & Africa
-
5. Asia Pacific
- 5.1. China
- 5.2. India
- 5.3. Japan
- 5.4. South Korea
- 5.5. ASEAN
- 5.6. Oceania
- 5.7. Rest of Asia Pacific
Activated Carbon for Food Regional Market Share
Geographic Coverage of Activated Carbon for Food
Activated Carbon for Food REPORT HIGHLIGHTS
| Aspects | Details |
|---|---|
| Study Period | 2020-2034 |
| Base Year | 2025 |
| Estimated Year | 2026 |
| Forecast Period | 2026-2034 |
| Historical Period | 2020-2025 |
| Growth Rate | CAGR of XX% from 2020-2034 |
| Segmentation |
|
Table of Contents
- 1. Introduction
- 1.1. Research Scope
- 1.2. Market Segmentation
- 1.3. Research Methodology
- 1.4. Definitions and Assumptions
- 2. Executive Summary
- 2.1. Introduction
- 3. Market Dynamics
- 3.1. Introduction
- 3.2. Market Drivers
- 3.3. Market Restrains
- 3.4. Market Trends
- 4. Market Factor Analysis
- 4.1. Porters Five Forces
- 4.2. Supply/Value Chain
- 4.3. PESTEL analysis
- 4.4. Market Entropy
- 4.5. Patent/Trademark Analysis
- 5. Global Activated Carbon for Food Analysis, Insights and Forecast, 2020-2032
- 5.1. Market Analysis, Insights and Forecast - by Application
- 5.1.1. Fermentation Industry
- 5.1.2. Food Additives
- 5.1.3. Beverages
- 5.1.4. Other
- 5.2. Market Analysis, Insights and Forecast - by Types
- 5.2.1. Powder
- 5.2.2. Particles
- 5.3. Market Analysis, Insights and Forecast - by Region
- 5.3.1. North America
- 5.3.2. South America
- 5.3.3. Europe
- 5.3.4. Middle East & Africa
- 5.3.5. Asia Pacific
- 5.1. Market Analysis, Insights and Forecast - by Application
- 6. North America Activated Carbon for Food Analysis, Insights and Forecast, 2020-2032
- 6.1. Market Analysis, Insights and Forecast - by Application
- 6.1.1. Fermentation Industry
- 6.1.2. Food Additives
- 6.1.3. Beverages
- 6.1.4. Other
- 6.2. Market Analysis, Insights and Forecast - by Types
- 6.2.1. Powder
- 6.2.2. Particles
- 6.1. Market Analysis, Insights and Forecast - by Application
- 7. South America Activated Carbon for Food Analysis, Insights and Forecast, 2020-2032
- 7.1. Market Analysis, Insights and Forecast - by Application
- 7.1.1. Fermentation Industry
- 7.1.2. Food Additives
- 7.1.3. Beverages
- 7.1.4. Other
- 7.2. Market Analysis, Insights and Forecast - by Types
- 7.2.1. Powder
- 7.2.2. Particles
- 7.1. Market Analysis, Insights and Forecast - by Application
- 8. Europe Activated Carbon for Food Analysis, Insights and Forecast, 2020-2032
- 8.1. Market Analysis, Insights and Forecast - by Application
- 8.1.1. Fermentation Industry
- 8.1.2. Food Additives
- 8.1.3. Beverages
- 8.1.4. Other
- 8.2. Market Analysis, Insights and Forecast - by Types
- 8.2.1. Powder
- 8.2.2. Particles
- 8.1. Market Analysis, Insights and Forecast - by Application
- 9. Middle East & Africa Activated Carbon for Food Analysis, Insights and Forecast, 2020-2032
- 9.1. Market Analysis, Insights and Forecast - by Application
- 9.1.1. Fermentation Industry
- 9.1.2. Food Additives
- 9.1.3. Beverages
- 9.1.4. Other
- 9.2. Market Analysis, Insights and Forecast - by Types
- 9.2.1. Powder
- 9.2.2. Particles
- 9.1. Market Analysis, Insights and Forecast - by Application
- 10. Asia Pacific Activated Carbon for Food Analysis, Insights and Forecast, 2020-2032
- 10.1. Market Analysis, Insights and Forecast - by Application
- 10.1.1. Fermentation Industry
- 10.1.2. Food Additives
- 10.1.3. Beverages
- 10.1.4. Other
- 10.2. Market Analysis, Insights and Forecast - by Types
- 10.2.1. Powder
- 10.2.2. Particles
- 10.1. Market Analysis, Insights and Forecast - by Application
- 11. Competitive Analysis
- 11.1. Global Market Share Analysis 2025
- 11.2. Company Profiles
- 11.2.1 Kuraray
- 11.2.1.1. Overview
- 11.2.1.2. Products
- 11.2.1.3. SWOT Analysis
- 11.2.1.4. Recent Developments
- 11.2.1.5. Financials (Based on Availability)
- 11.2.2 Ingevity Corporation
- 11.2.2.1. Overview
- 11.2.2.2. Products
- 11.2.2.3. SWOT Analysis
- 11.2.2.4. Recent Developments
- 11.2.2.5. Financials (Based on Availability)
- 11.2.3 Cabot Corporation
- 11.2.3.1. Overview
- 11.2.3.2. Products
- 11.2.3.3. SWOT Analysis
- 11.2.3.4. Recent Developments
- 11.2.3.5. Financials (Based on Availability)
- 11.2.4 Jacobi Group
- 11.2.4.1. Overview
- 11.2.4.2. Products
- 11.2.4.3. SWOT Analysis
- 11.2.4.4. Recent Developments
- 11.2.4.5. Financials (Based on Availability)
- 11.2.5 Haycarb
- 11.2.5.1. Overview
- 11.2.5.2. Products
- 11.2.5.3. SWOT Analysis
- 11.2.5.4. Recent Developments
- 11.2.5.5. Financials (Based on Availability)
- 11.2.6 Chemviron
- 11.2.6.1. Overview
- 11.2.6.2. Products
- 11.2.6.3. SWOT Analysis
- 11.2.6.4. Recent Developments
- 11.2.6.5. Financials (Based on Availability)
- 11.2.7 Boyce Carbon
- 11.2.7.1. Overview
- 11.2.7.2. Products
- 11.2.7.3. SWOT Analysis
- 11.2.7.4. Recent Developments
- 11.2.7.5. Financials (Based on Availability)
- 11.2.8 Calgon Carbon Corporation
- 11.2.8.1. Overview
- 11.2.8.2. Products
- 11.2.8.3. SWOT Analysis
- 11.2.8.4. Recent Developments
- 11.2.8.5. Financials (Based on Availability)
- 11.2.9 CPL Activated Carbons
- 11.2.9.1. Overview
- 11.2.9.2. Products
- 11.2.9.3. SWOT Analysis
- 11.2.9.4. Recent Developments
- 11.2.9.5. Financials (Based on Availability)
- 11.2.10 UES
- 11.2.10.1. Overview
- 11.2.10.2. Products
- 11.2.10.3. SWOT Analysis
- 11.2.10.4. Recent Developments
- 11.2.10.5. Financials (Based on Availability)
- 11.2.11 Ecofriend Carbon
- 11.2.11.1. Overview
- 11.2.11.2. Products
- 11.2.11.3. SWOT Analysis
- 11.2.11.4. Recent Developments
- 11.2.11.5. Financials (Based on Availability)
- 11.2.12 Activated Carbon Solutions Inc
- 11.2.12.1. Overview
- 11.2.12.2. Products
- 11.2.12.3. SWOT Analysis
- 11.2.12.4. Recent Developments
- 11.2.12.5. Financials (Based on Availability)
- 11.2.13 CG Carbon
- 11.2.13.1. Overview
- 11.2.13.2. Products
- 11.2.13.3. SWOT Analysis
- 11.2.13.4. Recent Developments
- 11.2.13.5. Financials (Based on Availability)
- 11.2.14 Fujian Yuanli Active Carbon Co.
- 11.2.14.1. Overview
- 11.2.14.2. Products
- 11.2.14.3. SWOT Analysis
- 11.2.14.4. Recent Developments
- 11.2.14.5. Financials (Based on Availability)
- 11.2.15 Ltd.
- 11.2.15.1. Overview
- 11.2.15.2. Products
- 11.2.15.3. SWOT Analysis
- 11.2.15.4. Recent Developments
- 11.2.15.5. Financials (Based on Availability)
- 11.2.16 Jiangsu Zhuxi Activated Carbon Co.
- 11.2.16.1. Overview
- 11.2.16.2. Products
- 11.2.16.3. SWOT Analysis
- 11.2.16.4. Recent Developments
- 11.2.16.5. Financials (Based on Availability)
- 11.2.17 Ltd.
- 11.2.17.1. Overview
- 11.2.17.2. Products
- 11.2.17.3. SWOT Analysis
- 11.2.17.4. Recent Developments
- 11.2.17.5. Financials (Based on Availability)
- 11.2.18 Shanghai Xinjinhu Activated Carbon Co.
- 11.2.18.1. Overview
- 11.2.18.2. Products
- 11.2.18.3. SWOT Analysis
- 11.2.18.4. Recent Developments
- 11.2.18.5. Financials (Based on Availability)
- 11.2.19 Ltd.
- 11.2.19.1. Overview
- 11.2.19.2. Products
- 11.2.19.3. SWOT Analysis
- 11.2.19.4. Recent Developments
- 11.2.19.5. Financials (Based on Availability)
- 11.2.20 Guangdong Hanyan Activated Carbon Technology Co.
- 11.2.20.1. Overview
- 11.2.20.2. Products
- 11.2.20.3. SWOT Analysis
- 11.2.20.4. Recent Developments
- 11.2.20.5. Financials (Based on Availability)
- 11.2.21 Ltd.
- 11.2.21.1. Overview
- 11.2.21.2. Products
- 11.2.21.3. SWOT Analysis
- 11.2.21.4. Recent Developments
- 11.2.21.5. Financials (Based on Availability)
- 11.2.22 Chengdu Senle Environmental Protection Technology Co.
- 11.2.22.1. Overview
- 11.2.22.2. Products
- 11.2.22.3. SWOT Analysis
- 11.2.22.4. Recent Developments
- 11.2.22.5. Financials (Based on Availability)
- 11.2.23 Ltd.
- 11.2.23.1. Overview
- 11.2.23.2. Products
- 11.2.23.3. SWOT Analysis
- 11.2.23.4. Recent Developments
- 11.2.23.5. Financials (Based on Availability)
- 11.2.24 Qizhong Chemical Industry
- 11.2.24.1. Overview
- 11.2.24.2. Products
- 11.2.24.3. SWOT Analysis
- 11.2.24.4. Recent Developments
- 11.2.24.5. Financials (Based on Availability)
- 11.2.1 Kuraray
List of Figures
- Figure 1: Global Activated Carbon for Food Revenue Breakdown (million, %) by Region 2025 & 2033
- Figure 2: Global Activated Carbon for Food Volume Breakdown (K, %) by Region 2025 & 2033
- Figure 3: North America Activated Carbon for Food Revenue (million), by Application 2025 & 2033
- Figure 4: North America Activated Carbon for Food Volume (K), by Application 2025 & 2033
- Figure 5: North America Activated Carbon for Food Revenue Share (%), by Application 2025 & 2033
- Figure 6: North America Activated Carbon for Food Volume Share (%), by Application 2025 & 2033
- Figure 7: North America Activated Carbon for Food Revenue (million), by Types 2025 & 2033
- Figure 8: North America Activated Carbon for Food Volume (K), by Types 2025 & 2033
- Figure 9: North America Activated Carbon for Food Revenue Share (%), by Types 2025 & 2033
- Figure 10: North America Activated Carbon for Food Volume Share (%), by Types 2025 & 2033
- Figure 11: North America Activated Carbon for Food Revenue (million), by Country 2025 & 2033
- Figure 12: North America Activated Carbon for Food Volume (K), by Country 2025 & 2033
- Figure 13: North America Activated Carbon for Food Revenue Share (%), by Country 2025 & 2033
- Figure 14: North America Activated Carbon for Food Volume Share (%), by Country 2025 & 2033
- Figure 15: South America Activated Carbon for Food Revenue (million), by Application 2025 & 2033
- Figure 16: South America Activated Carbon for Food Volume (K), by Application 2025 & 2033
- Figure 17: South America Activated Carbon for Food Revenue Share (%), by Application 2025 & 2033
- Figure 18: South America Activated Carbon for Food Volume Share (%), by Application 2025 & 2033
- Figure 19: South America Activated Carbon for Food Revenue (million), by Types 2025 & 2033
- Figure 20: South America Activated Carbon for Food Volume (K), by Types 2025 & 2033
- Figure 21: South America Activated Carbon for Food Revenue Share (%), by Types 2025 & 2033
- Figure 22: South America Activated Carbon for Food Volume Share (%), by Types 2025 & 2033
- Figure 23: South America Activated Carbon for Food Revenue (million), by Country 2025 & 2033
- Figure 24: South America Activated Carbon for Food Volume (K), by Country 2025 & 2033
- Figure 25: South America Activated Carbon for Food Revenue Share (%), by Country 2025 & 2033
- Figure 26: South America Activated Carbon for Food Volume Share (%), by Country 2025 & 2033
- Figure 27: Europe Activated Carbon for Food Revenue (million), by Application 2025 & 2033
- Figure 28: Europe Activated Carbon for Food Volume (K), by Application 2025 & 2033
- Figure 29: Europe Activated Carbon for Food Revenue Share (%), by Application 2025 & 2033
- Figure 30: Europe Activated Carbon for Food Volume Share (%), by Application 2025 & 2033
- Figure 31: Europe Activated Carbon for Food Revenue (million), by Types 2025 & 2033
- Figure 32: Europe Activated Carbon for Food Volume (K), by Types 2025 & 2033
- Figure 33: Europe Activated Carbon for Food Revenue Share (%), by Types 2025 & 2033
- Figure 34: Europe Activated Carbon for Food Volume Share (%), by Types 2025 & 2033
- Figure 35: Europe Activated Carbon for Food Revenue (million), by Country 2025 & 2033
- Figure 36: Europe Activated Carbon for Food Volume (K), by Country 2025 & 2033
- Figure 37: Europe Activated Carbon for Food Revenue Share (%), by Country 2025 & 2033
- Figure 38: Europe Activated Carbon for Food Volume Share (%), by Country 2025 & 2033
- Figure 39: Middle East & Africa Activated Carbon for Food Revenue (million), by Application 2025 & 2033
- Figure 40: Middle East & Africa Activated Carbon for Food Volume (K), by Application 2025 & 2033
- Figure 41: Middle East & Africa Activated Carbon for Food Revenue Share (%), by Application 2025 & 2033
- Figure 42: Middle East & Africa Activated Carbon for Food Volume Share (%), by Application 2025 & 2033
- Figure 43: Middle East & Africa Activated Carbon for Food Revenue (million), by Types 2025 & 2033
- Figure 44: Middle East & Africa Activated Carbon for Food Volume (K), by Types 2025 & 2033
- Figure 45: Middle East & Africa Activated Carbon for Food Revenue Share (%), by Types 2025 & 2033
- Figure 46: Middle East & Africa Activated Carbon for Food Volume Share (%), by Types 2025 & 2033
- Figure 47: Middle East & Africa Activated Carbon for Food Revenue (million), by Country 2025 & 2033
- Figure 48: Middle East & Africa Activated Carbon for Food Volume (K), by Country 2025 & 2033
- Figure 49: Middle East & Africa Activated Carbon for Food Revenue Share (%), by Country 2025 & 2033
- Figure 50: Middle East & Africa Activated Carbon for Food Volume Share (%), by Country 2025 & 2033
- Figure 51: Asia Pacific Activated Carbon for Food Revenue (million), by Application 2025 & 2033
- Figure 52: Asia Pacific Activated Carbon for Food Volume (K), by Application 2025 & 2033
- Figure 53: Asia Pacific Activated Carbon for Food Revenue Share (%), by Application 2025 & 2033
- Figure 54: Asia Pacific Activated Carbon for Food Volume Share (%), by Application 2025 & 2033
- Figure 55: Asia Pacific Activated Carbon for Food Revenue (million), by Types 2025 & 2033
- Figure 56: Asia Pacific Activated Carbon for Food Volume (K), by Types 2025 & 2033
- Figure 57: Asia Pacific Activated Carbon for Food Revenue Share (%), by Types 2025 & 2033
- Figure 58: Asia Pacific Activated Carbon for Food Volume Share (%), by Types 2025 & 2033
- Figure 59: Asia Pacific Activated Carbon for Food Revenue (million), by Country 2025 & 2033
- Figure 60: Asia Pacific Activated Carbon for Food Volume (K), by Country 2025 & 2033
- Figure 61: Asia Pacific Activated Carbon for Food Revenue Share (%), by Country 2025 & 2033
- Figure 62: Asia Pacific Activated Carbon for Food Volume Share (%), by Country 2025 & 2033
List of Tables
- Table 1: Global Activated Carbon for Food Revenue million Forecast, by Region 2020 & 2033
- Table 2: Global Activated Carbon for Food Volume K Forecast, by Region 2020 & 2033
- Table 3: Global Activated Carbon for Food Revenue million Forecast, by Application 2020 & 2033
- Table 4: Global Activated Carbon for Food Volume K Forecast, by Application 2020 & 2033
- Table 5: Global Activated Carbon for Food Revenue million Forecast, by Types 2020 & 2033
- Table 6: Global Activated Carbon for Food Volume K Forecast, by Types 2020 & 2033
- Table 7: Global Activated Carbon for Food Revenue million Forecast, by Region 2020 & 2033
- Table 8: Global Activated Carbon for Food Volume K Forecast, by Region 2020 & 2033
- Table 9: Global Activated Carbon for Food Revenue million Forecast, by Application 2020 & 2033
- Table 10: Global Activated Carbon for Food Volume K Forecast, by Application 2020 & 2033
- Table 11: Global Activated Carbon for Food Revenue million Forecast, by Types 2020 & 2033
- Table 12: Global Activated Carbon for Food Volume K Forecast, by Types 2020 & 2033
- Table 13: Global Activated Carbon for Food Revenue million Forecast, by Country 2020 & 2033
- Table 14: Global Activated Carbon for Food Volume K Forecast, by Country 2020 & 2033
- Table 15: United States Activated Carbon for Food Revenue (million) Forecast, by Application 2020 & 2033
- Table 16: United States Activated Carbon for Food Volume (K) Forecast, by Application 2020 & 2033
- Table 17: Canada Activated Carbon for Food Revenue (million) Forecast, by Application 2020 & 2033
- Table 18: Canada Activated Carbon for Food Volume (K) Forecast, by Application 2020 & 2033
- Table 19: Mexico Activated Carbon for Food Revenue (million) Forecast, by Application 2020 & 2033
- Table 20: Mexico Activated Carbon for Food Volume (K) Forecast, by Application 2020 & 2033
- Table 21: Global Activated Carbon for Food Revenue million Forecast, by Application 2020 & 2033
- Table 22: Global Activated Carbon for Food Volume K Forecast, by Application 2020 & 2033
- Table 23: Global Activated Carbon for Food Revenue million Forecast, by Types 2020 & 2033
- Table 24: Global Activated Carbon for Food Volume K Forecast, by Types 2020 & 2033
- Table 25: Global Activated Carbon for Food Revenue million Forecast, by Country 2020 & 2033
- Table 26: Global Activated Carbon for Food Volume K Forecast, by Country 2020 & 2033
- Table 27: Brazil Activated Carbon for Food Revenue (million) Forecast, by Application 2020 & 2033
- Table 28: Brazil Activated Carbon for Food Volume (K) Forecast, by Application 2020 & 2033
- Table 29: Argentina Activated Carbon for Food Revenue (million) Forecast, by Application 2020 & 2033
- Table 30: Argentina Activated Carbon for Food Volume (K) Forecast, by Application 2020 & 2033
- Table 31: Rest of South America Activated Carbon for Food Revenue (million) Forecast, by Application 2020 & 2033
- Table 32: Rest of South America Activated Carbon for Food Volume (K) Forecast, by Application 2020 & 2033
- Table 33: Global Activated Carbon for Food Revenue million Forecast, by Application 2020 & 2033
- Table 34: Global Activated Carbon for Food Volume K Forecast, by Application 2020 & 2033
- Table 35: Global Activated Carbon for Food Revenue million Forecast, by Types 2020 & 2033
- Table 36: Global Activated Carbon for Food Volume K Forecast, by Types 2020 & 2033
- Table 37: Global Activated Carbon for Food Revenue million Forecast, by Country 2020 & 2033
- Table 38: Global Activated Carbon for Food Volume K Forecast, by Country 2020 & 2033
- Table 39: United Kingdom Activated Carbon for Food Revenue (million) Forecast, by Application 2020 & 2033
- Table 40: United Kingdom Activated Carbon for Food Volume (K) Forecast, by Application 2020 & 2033
- Table 41: Germany Activated Carbon for Food Revenue (million) Forecast, by Application 2020 & 2033
- Table 42: Germany Activated Carbon for Food Volume (K) Forecast, by Application 2020 & 2033
- Table 43: France Activated Carbon for Food Revenue (million) Forecast, by Application 2020 & 2033
- Table 44: France Activated Carbon for Food Volume (K) Forecast, by Application 2020 & 2033
- Table 45: Italy Activated Carbon for Food Revenue (million) Forecast, by Application 2020 & 2033
- Table 46: Italy Activated Carbon for Food Volume (K) Forecast, by Application 2020 & 2033
- Table 47: Spain Activated Carbon for Food Revenue (million) Forecast, by Application 2020 & 2033
- Table 48: Spain Activated Carbon for Food Volume (K) Forecast, by Application 2020 & 2033
- Table 49: Russia Activated Carbon for Food Revenue (million) Forecast, by Application 2020 & 2033
- Table 50: Russia Activated Carbon for Food Volume (K) Forecast, by Application 2020 & 2033
- Table 51: Benelux Activated Carbon for Food Revenue (million) Forecast, by Application 2020 & 2033
- Table 52: Benelux Activated Carbon for Food Volume (K) Forecast, by Application 2020 & 2033
- Table 53: Nordics Activated Carbon for Food Revenue (million) Forecast, by Application 2020 & 2033
- Table 54: Nordics Activated Carbon for Food Volume (K) Forecast, by Application 2020 & 2033
- Table 55: Rest of Europe Activated Carbon for Food Revenue (million) Forecast, by Application 2020 & 2033
- Table 56: Rest of Europe Activated Carbon for Food Volume (K) Forecast, by Application 2020 & 2033
- Table 57: Global Activated Carbon for Food Revenue million Forecast, by Application 2020 & 2033
- Table 58: Global Activated Carbon for Food Volume K Forecast, by Application 2020 & 2033
- Table 59: Global Activated Carbon for Food Revenue million Forecast, by Types 2020 & 2033
- Table 60: Global Activated Carbon for Food Volume K Forecast, by Types 2020 & 2033
- Table 61: Global Activated Carbon for Food Revenue million Forecast, by Country 2020 & 2033
- Table 62: Global Activated Carbon for Food Volume K Forecast, by Country 2020 & 2033
- Table 63: Turkey Activated Carbon for Food Revenue (million) Forecast, by Application 2020 & 2033
- Table 64: Turkey Activated Carbon for Food Volume (K) Forecast, by Application 2020 & 2033
- Table 65: Israel Activated Carbon for Food Revenue (million) Forecast, by Application 2020 & 2033
- Table 66: Israel Activated Carbon for Food Volume (K) Forecast, by Application 2020 & 2033
- Table 67: GCC Activated Carbon for Food Revenue (million) Forecast, by Application 2020 & 2033
- Table 68: GCC Activated Carbon for Food Volume (K) Forecast, by Application 2020 & 2033
- Table 69: North Africa Activated Carbon for Food Revenue (million) Forecast, by Application 2020 & 2033
- Table 70: North Africa Activated Carbon for Food Volume (K) Forecast, by Application 2020 & 2033
- Table 71: South Africa Activated Carbon for Food Revenue (million) Forecast, by Application 2020 & 2033
- Table 72: South Africa Activated Carbon for Food Volume (K) Forecast, by Application 2020 & 2033
- Table 73: Rest of Middle East & Africa Activated Carbon for Food Revenue (million) Forecast, by Application 2020 & 2033
- Table 74: Rest of Middle East & Africa Activated Carbon for Food Volume (K) Forecast, by Application 2020 & 2033
- Table 75: Global Activated Carbon for Food Revenue million Forecast, by Application 2020 & 2033
- Table 76: Global Activated Carbon for Food Volume K Forecast, by Application 2020 & 2033
- Table 77: Global Activated Carbon for Food Revenue million Forecast, by Types 2020 & 2033
- Table 78: Global Activated Carbon for Food Volume K Forecast, by Types 2020 & 2033
- Table 79: Global Activated Carbon for Food Revenue million Forecast, by Country 2020 & 2033
- Table 80: Global Activated Carbon for Food Volume K Forecast, by Country 2020 & 2033
- Table 81: China Activated Carbon for Food Revenue (million) Forecast, by Application 2020 & 2033
- Table 82: China Activated Carbon for Food Volume (K) Forecast, by Application 2020 & 2033
- Table 83: India Activated Carbon for Food Revenue (million) Forecast, by Application 2020 & 2033
- Table 84: India Activated Carbon for Food Volume (K) Forecast, by Application 2020 & 2033
- Table 85: Japan Activated Carbon for Food Revenue (million) Forecast, by Application 2020 & 2033
- Table 86: Japan Activated Carbon for Food Volume (K) Forecast, by Application 2020 & 2033
- Table 87: South Korea Activated Carbon for Food Revenue (million) Forecast, by Application 2020 & 2033
- Table 88: South Korea Activated Carbon for Food Volume (K) Forecast, by Application 2020 & 2033
- Table 89: ASEAN Activated Carbon for Food Revenue (million) Forecast, by Application 2020 & 2033
- Table 90: ASEAN Activated Carbon for Food Volume (K) Forecast, by Application 2020 & 2033
- Table 91: Oceania Activated Carbon for Food Revenue (million) Forecast, by Application 2020 & 2033
- Table 92: Oceania Activated Carbon for Food Volume (K) Forecast, by Application 2020 & 2033
- Table 93: Rest of Asia Pacific Activated Carbon for Food Revenue (million) Forecast, by Application 2020 & 2033
- Table 94: Rest of Asia Pacific Activated Carbon for Food Volume (K) Forecast, by Application 2020 & 2033
Frequently Asked Questions
1. What is the projected Compound Annual Growth Rate (CAGR) of the Activated Carbon for Food?
The projected CAGR is approximately XX%.
2. Which companies are prominent players in the Activated Carbon for Food?
Key companies in the market include Kuraray, Ingevity Corporation, Cabot Corporation, Jacobi Group, Haycarb, Chemviron, Boyce Carbon, Calgon Carbon Corporation, CPL Activated Carbons, UES, Ecofriend Carbon, Activated Carbon Solutions Inc, CG Carbon, Fujian Yuanli Active Carbon Co., Ltd., Jiangsu Zhuxi Activated Carbon Co., Ltd., Shanghai Xinjinhu Activated Carbon Co., Ltd., Guangdong Hanyan Activated Carbon Technology Co., Ltd., Chengdu Senle Environmental Protection Technology Co., Ltd., Qizhong Chemical Industry.
3. What are the main segments of the Activated Carbon for Food?
The market segments include Application, Types.
4. Can you provide details about the market size?
The market size is estimated to be USD XXX million as of 2022.
5. What are some drivers contributing to market growth?
N/A
6. What are the notable trends driving market growth?
N/A
7. Are there any restraints impacting market growth?
N/A
8. Can you provide examples of recent developments in the market?
N/A
9. What pricing options are available for accessing the report?
Pricing options include single-user, multi-user, and enterprise licenses priced at USD 3950.00, USD 5925.00, and USD 7900.00 respectively.
10. Is the market size provided in terms of value or volume?
The market size is provided in terms of value, measured in million and volume, measured in K.
11. Are there any specific market keywords associated with the report?
Yes, the market keyword associated with the report is "Activated Carbon for Food," which aids in identifying and referencing the specific market segment covered.
12. How do I determine which pricing option suits my needs best?
The pricing options vary based on user requirements and access needs. Individual users may opt for single-user licenses, while businesses requiring broader access may choose multi-user or enterprise licenses for cost-effective access to the report.
13. Are there any additional resources or data provided in the Activated Carbon for Food report?
While the report offers comprehensive insights, it's advisable to review the specific contents or supplementary materials provided to ascertain if additional resources or data are available.
14. How can I stay updated on further developments or reports in the Activated Carbon for Food?
To stay informed about further developments, trends, and reports in the Activated Carbon for Food, consider subscribing to industry newsletters, following relevant companies and organizations, or regularly checking reputable industry news sources and publications.
Methodology
Step 1 - Identification of Relevant Samples Size from Population Database


Step 2 - Approaches for Defining Global Market Size (Value, Volume* & Price*)

Note*: In applicable scenarios
Step 3 - Data Sources
Primary Research
- Web Analytics
- Survey Reports
- Research Institute
- Latest Research Reports
- Opinion Leaders
Secondary Research
- Annual Reports
- White Paper
- Latest Press Release
- Industry Association
- Paid Database
- Investor Presentations

Step 4 - Data Triangulation
Involves using different sources of information in order to increase the validity of a study
These sources are likely to be stakeholders in a program - participants, other researchers, program staff, other community members, and so on.
Then we put all data in single framework & apply various statistical tools to find out the dynamic on the market.
During the analysis stage, feedback from the stakeholder groups would be compared to determine areas of agreement as well as areas of divergence


