Key Insights
The global Activated Carbon market is poised for steady expansion, projected to reach $4480 million by 2025, driven by a CAGR of 2%. This growth is underpinned by a robust demand from diverse sectors, primarily water treatment and air purification, where activated carbon's exceptional adsorptive properties are indispensable for removing contaminants and pollutants. The increasing global focus on environmental regulations and sustainable practices is a significant tailwind, compelling industries to adopt advanced filtration solutions. Furthermore, the food and beverage sector leverages activated carbon for decolorization and purification, while its applications in industrial processes, pharmaceuticals, and mercury control continue to evolve. The market's trajectory is further supported by the ongoing development of innovative activated carbon formulations and production techniques, enhancing their efficacy and applicability across a wider range of challenges.
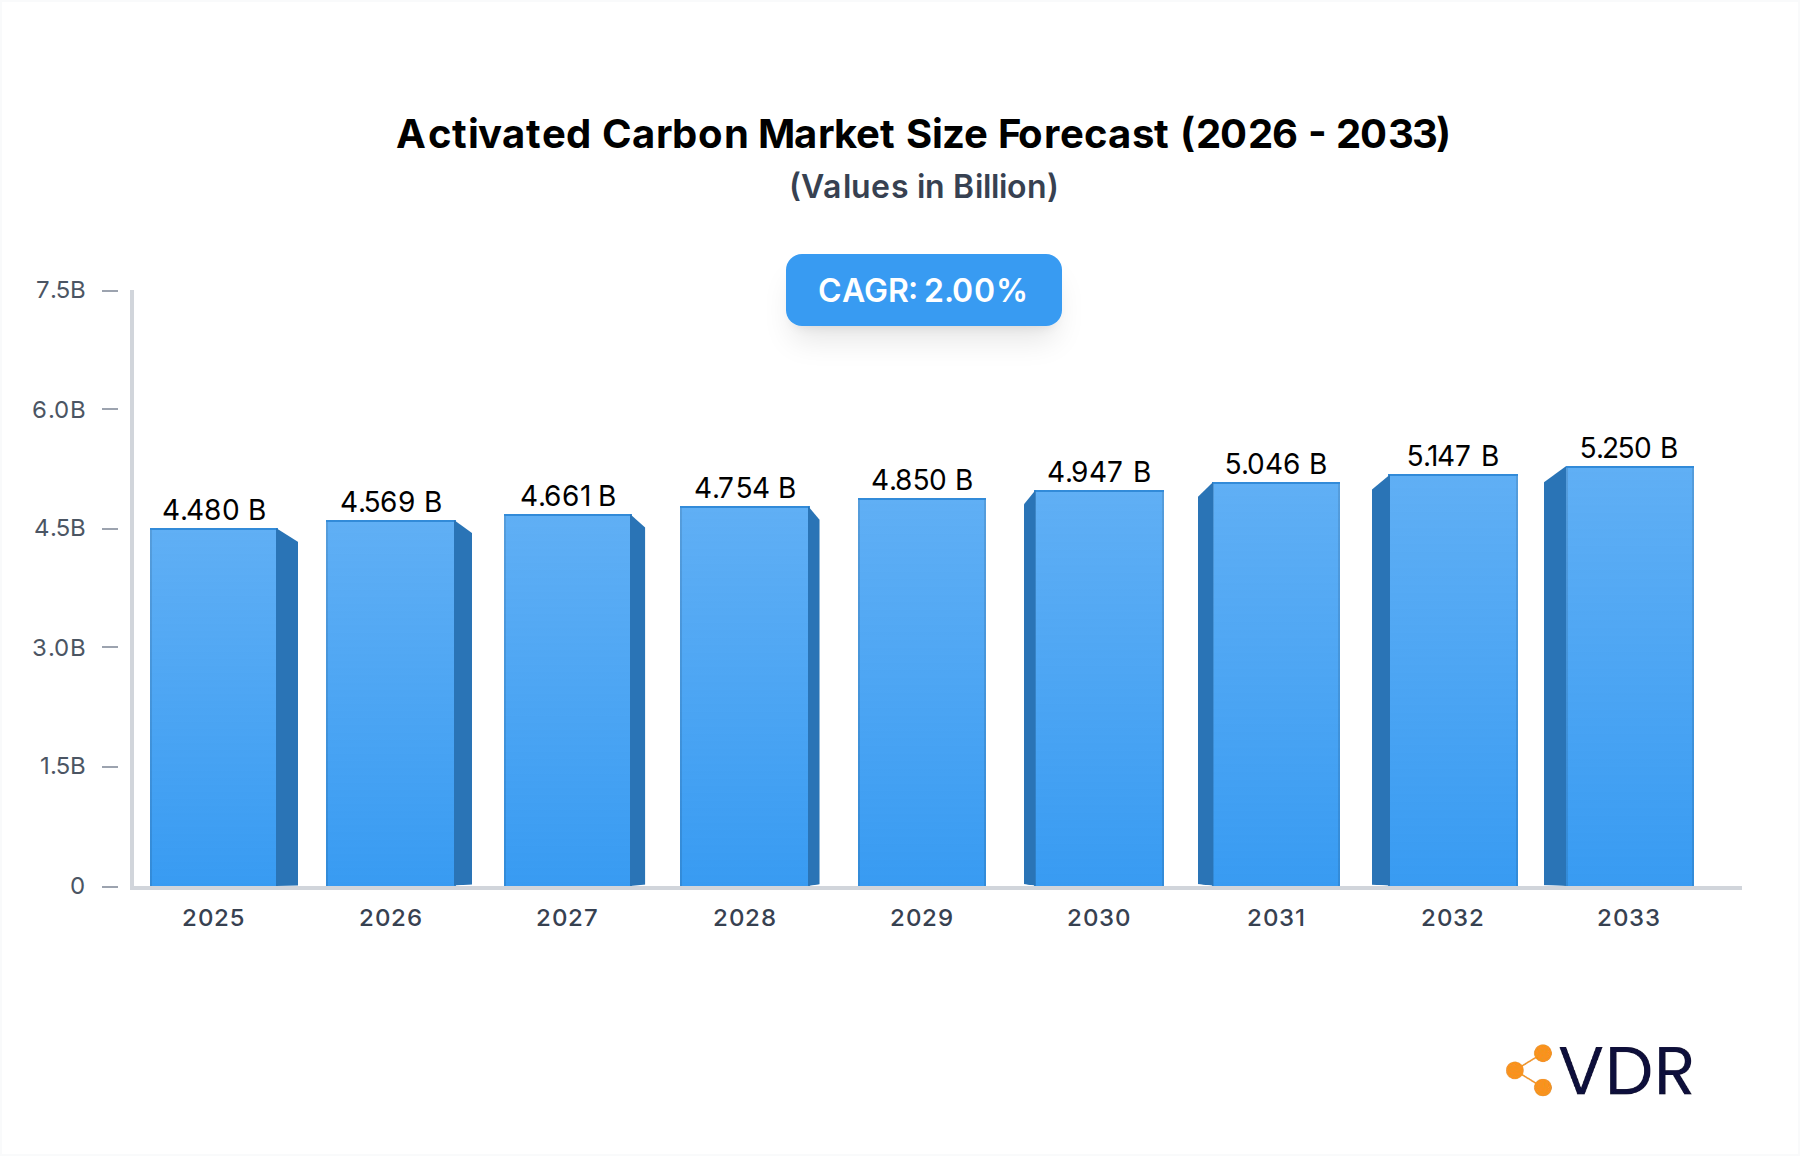
Activated Carbon Market Size (In Billion)
The market landscape is characterized by a competitive presence of key players, including Ingevity Corporation, Kuraray, and Jacobi Carbons, alongside emerging regional manufacturers. Coal-based activated carbon currently dominates the supply, owing to its cost-effectiveness and widespread availability, though wood-based and coconut-based alternatives are gaining traction due to their sustainable sourcing and specialized performance attributes. While market growth is projected at a moderate 2% CAGR, the increasing awareness of environmental protection, coupled with stringent regulatory frameworks globally, will continue to fuel demand. Potential restraints could include the volatility of raw material prices and the energy-intensive nature of activated carbon production. However, ongoing research into more efficient and eco-friendly manufacturing processes is expected to mitigate these concerns, ensuring a sustained and healthy market for activated carbon.

Activated Carbon Company Market Share
Unleash the Power of Purity: Activated Carbon Market Analysis (2019-2033)
This comprehensive report offers an in-depth exploration of the global Activated Carbon market, a critical component in diverse industrial and environmental applications. Delve into the intricate dynamics, growth trajectories, and future potential of this essential material, projected to reach xx million units by 2025 and expand significantly through 2033. We meticulously analyze key market drivers, including the surging demand for clean water and air, stringent environmental regulations, and advancements in various industrial processes. Our report provides actionable insights for stakeholders, from raw material suppliers to end-users, navigating the competitive landscape of this vital sector.
Activated Carbon Market Dynamics & Structure
The global Activated Carbon market exhibits a moderately concentrated structure, characterized by the presence of both large multinational corporations and specialized regional players. Technological innovation is a significant driver, with ongoing research and development focused on enhancing adsorption capacity, selectivity, and regenerability of activated carbon products. Regulatory frameworks, particularly concerning environmental protection and water quality standards, play a crucial role in shaping market demand. The threat of competitive product substitutes, while present in certain niche applications, is generally limited due to activated carbon's unique porous structure and broad applicability. End-user demographics are increasingly driven by environmental consciousness and a desire for sustainable solutions across various industries. Mergers and acquisitions (M&A) are notable trends, with companies consolidating to gain market share, access new technologies, and expand their geographical reach. For instance, the acquisition of smaller, innovative firms by larger entities aims to strengthen portfolios and R&D capabilities.
- Market Concentration: Moderately concentrated with a mix of global leaders and regional specialists.
- Technological Innovation Drivers: Enhanced adsorption, increased selectivity, improved regeneration, and development of novel activation methods.
- Regulatory Frameworks: Stringent environmental regulations for emissions control and water purification are primary market influencers.
- Competitive Product Substitutes: Limited in core applications due to activated carbon's unique properties, but emerging alternatives are being explored in specific segments.
- End-User Demographics: Growing demand from environmentally conscious industries and consumers prioritizing health and sustainability.
- M&A Trends: Strategic acquisitions and mergers to enhance market position, expand product offerings, and secure raw material supply chains. Expected M&A deal volume: xx million units.
Activated Carbon Growth Trends & Insights
The Activated Carbon market is poised for robust growth, fueled by an ever-increasing global emphasis on environmental sustainability and public health. The market size, estimated at xx million units in the base year 2025, is projected to witness a Compound Annual Growth Rate (CAGR) of xx% during the forecast period of 2025–2033. This expansion is intrinsically linked to the rising adoption rates of activated carbon in critical applications such as water treatment and air purification, where its superior adsorptive capabilities are indispensable for removing contaminants and pollutants. Technological disruptions, including the development of advanced activation techniques and customized pore structures, are further enhancing product performance and opening up new application avenues. Consumer behavior shifts, particularly the growing preference for purified water and cleaner air in residential and commercial spaces, are also contributing to market penetration. Industry developments like the increasing use of activated carbon in the pharmaceutical sector for drug purification and in the food and beverage industry for decolorization and deodorization are indicative of its versatility. The historical period from 2019 to 2024 saw consistent growth, setting a strong foundation for future expansion.
Dominant Regions, Countries, or Segments in Activated Carbon
The Water Treatment segment, within the Application category, stands as a dominant force driving the global Activated Carbon market. This dominance is propelled by escalating global populations, increasing industrialization, and a heightened awareness of waterborne diseases, necessitating advanced purification solutions. The Coal-based Activated Carbon type also holds a significant share, primarily due to its cost-effectiveness and widespread availability of raw materials. Geographically, Asia Pacific is emerging as a pivotal region for growth, driven by rapid industrial development in countries like China and India, coupled with substantial investments in water infrastructure and stringent emission control policies.
Dominant Application Segment: Water Treatment
- Key Drivers:
- Growing global demand for potable water due to population growth and urbanization.
- Increasing stringency of wastewater discharge regulations.
- Industrial process water purification requirements in sectors like chemicals, petrochemicals, and power generation.
- Demand for ultrapure water in semiconductor manufacturing and pharmaceuticals.
- Market share of Water Treatment: xx%.
- Growth potential: High, driven by continuous need for remediation.
- Key Drivers:
Dominant Type: Coal-based Activated Carbon
- Key Drivers:
- Abundant raw material availability and competitive pricing.
- Established production infrastructure and economies of scale.
- Versatility in removing a wide range of organic and inorganic contaminants.
- Market share of Coal-based Activated Carbon: xx%.
- Growth potential: Stable, with ongoing innovation in production methods.
- Key Drivers:
Dominant Region: Asia Pacific
- Key Drivers:
- Rapid industrial expansion and urbanization.
- Significant government investments in environmental protection and water management.
- Presence of major manufacturing hubs for various end-use industries.
- Increasing adoption of activated carbon for air pollution control.
- Market share of Asia Pacific: xx%.
- Growth potential: Highest, fueled by emerging economies and supportive policies.
- Key Drivers:
Activated Carbon Product Landscape
The activated carbon product landscape is characterized by continuous innovation focused on tailoring pore structures and surface chemistries for highly specific applications. Emerging product lines include advanced impregnated carbons for enhanced removal of specific pollutants like mercury and ammonia, as well as high-performance powdered activated carbons (PAC) for rapid water treatment and granular activated carbons (GAC) with optimized particle size distribution for efficient adsorption beds. Innovations in activation technologies are yielding products with superior adsorption capacities, faster adsorption kinetics, and improved regenerability, leading to reduced operational costs for end-users. The performance metrics being optimized include iodine number, BET surface area, pore volume, and hardness, ensuring these materials meet the stringent demands of industries ranging from pharmaceuticals to food and beverages.
Key Drivers, Barriers & Challenges in Activated Carbon
Key Drivers: The activated carbon market is primarily propelled by the escalating global demand for clean water and air, driven by stringent environmental regulations and increasing public health consciousness. Technological advancements in activation processes and the development of specialized carbons for targeted contaminant removal are also significant growth accelerators. The expansion of industrial processes, particularly in emerging economies, further fuels demand.
Key Barriers & Challenges: Supply chain volatility of raw materials, particularly coal and wood, can impact pricing and availability, posing a significant restraint. The initial capital investment for setting up activated carbon production facilities can be substantial. Furthermore, managing the disposal or regeneration of spent activated carbon presents environmental and economic challenges. Intense competition among existing players and the emergence of alternative purification technologies in certain segments also create competitive pressures. The forecast period from 2025 to 2033 will see these factors play out significantly, with supply chain issues potentially impacting xx% of production costs.
Emerging Opportunities in Activated Carbon
Emerging opportunities in the activated carbon sector lie in the development of sustainable and bio-based activated carbons, tapping into the growing consumer preference for eco-friendly solutions. Untapped markets in developing regions with growing industrial bases and limited access to advanced water and air purification technologies represent significant potential. Innovative applications in areas such as energy storage (e.g., supercapacitors), advanced catalysis, and the pharmaceutical sector for novel drug delivery systems are also opening up new avenues for growth. Furthermore, the increasing focus on circular economy principles is driving opportunities in the regeneration and reuse of spent activated carbon, creating a more sustainable value chain.
Growth Accelerators in the Activated Carbon Industry
Several catalysts are accelerating long-term growth in the activated carbon industry. Technological breakthroughs in the production of highly selective and regenerable activated carbons are enhancing efficiency and reducing operational costs for end-users. Strategic partnerships between activated carbon manufacturers and end-use industries, such as water treatment companies and industrial polluters, are crucial for developing tailored solutions and expanding market penetration. Market expansion strategies, particularly in regions with burgeoning industrial sectors and increasing environmental awareness, are also vital growth engines. The development of advanced materials for specific contaminant removal, such as those targeting microplastics or emerging contaminants in water, will further drive industry growth.
Key Players Shaping the Activated Carbon Market
- Ingevity Corporation
- Kuraray
- Jacobi Carbons
- Norit
- Haycarb
- Fujian Yuanli Active Carbon
- Futamura Chemical
- MuLinSen Activated Carbon
- China Energy Investment Corporation
- Datong Coal Jinding Activated Carbon
- Boyce Carbon
- Core Carbons
- Ningxia Huahui Activated Carbon
- Philippine Japan Active Carbon Corp
- Fujian Xinsen Carbon
- DESOTEC Activated Carbon
- Shanxi Xinhua Chemical
- Silcarbon Aktivkohle GmbH
- CarboTech AC GmbH
- Active Char Products
- Donau Carbon
- Fujian Zhixing
Notable Milestones in Activated Carbon Sector
- 2019: Increased investment in R&D for advanced activated carbon for mercury control in power plants.
- 2020: Launch of novel wood-based activated carbons with enhanced porosity for pharmaceutical purification.
- 2021: Significant M&A activity as larger players consolidate to expand product portfolios and geographical reach.
- 2022: Growing adoption of coconut-based activated carbon for potable water filters due to its sustainability.
- 2023: Development of innovative regeneration technologies to reduce the environmental impact of spent activated carbon.
- 2024: Introduction of customized activated carbon solutions for emerging contaminants in wastewater treatment.
In-Depth Activated Carbon Market Outlook
The future outlook for the activated carbon market is exceptionally promising, driven by sustained global efforts towards environmental sustainability and public health improvement. Growth accelerators, including technological advancements in material science, strategic collaborations with key industrial sectors, and targeted market expansion into underserved regions, will continue to fuel this upward trajectory. The increasing demand for high-performance activated carbons capable of addressing complex purification challenges, coupled with the growing preference for bio-based and regenerable materials, presents significant strategic opportunities. The market is expected to not only meet existing demands but also to innovate and develop solutions for future environmental and industrial needs, solidifying its indispensable role.
Activated Carbon Segmentation
-
1. Application
- 1.1. Water Treatment
- 1.2. Air Purification
- 1.3. Mercury Control
- 1.4. Food & Beverages
- 1.5. Industrial Processes
- 1.6. Pharmaceuticals
- 1.7. Others
-
2. Types
- 2.1. Coal-based Activated Carbon
- 2.2. Wood-based Activated Carbon
- 2.3. Coconut-based Activated Carbon
Activated Carbon Segmentation By Geography
-
1. North America
- 1.1. United States
- 1.2. Canada
- 1.3. Mexico
-
2. South America
- 2.1. Brazil
- 2.2. Argentina
- 2.3. Rest of South America
-
3. Europe
- 3.1. United Kingdom
- 3.2. Germany
- 3.3. France
- 3.4. Italy
- 3.5. Spain
- 3.6. Russia
- 3.7. Benelux
- 3.8. Nordics
- 3.9. Rest of Europe
-
4. Middle East & Africa
- 4.1. Turkey
- 4.2. Israel
- 4.3. GCC
- 4.4. North Africa
- 4.5. South Africa
- 4.6. Rest of Middle East & Africa
-
5. Asia Pacific
- 5.1. China
- 5.2. India
- 5.3. Japan
- 5.4. South Korea
- 5.5. ASEAN
- 5.6. Oceania
- 5.7. Rest of Asia Pacific
Activated Carbon Regional Market Share
Geographic Coverage of Activated Carbon
Activated Carbon REPORT HIGHLIGHTS
| Aspects | Details |
|---|---|
| Study Period | 2020-2034 |
| Base Year | 2025 |
| Estimated Year | 2026 |
| Forecast Period | 2026-2034 |
| Historical Period | 2020-2025 |
| Growth Rate | CAGR of 2% from 2020-2034 |
| Segmentation |
|
Table of Contents
- 1. Introduction
- 1.1. Research Scope
- 1.2. Market Segmentation
- 1.3. Research Methodology
- 1.4. Definitions and Assumptions
- 2. Executive Summary
- 2.1. Introduction
- 3. Market Dynamics
- 3.1. Introduction
- 3.2. Market Drivers
- 3.3. Market Restrains
- 3.4. Market Trends
- 4. Market Factor Analysis
- 4.1. Porters Five Forces
- 4.2. Supply/Value Chain
- 4.3. PESTEL analysis
- 4.4. Market Entropy
- 4.5. Patent/Trademark Analysis
- 5. Global Activated Carbon Analysis, Insights and Forecast, 2020-2032
- 5.1. Market Analysis, Insights and Forecast - by Application
- 5.1.1. Water Treatment
- 5.1.2. Air Purification
- 5.1.3. Mercury Control
- 5.1.4. Food & Beverages
- 5.1.5. Industrial Processes
- 5.1.6. Pharmaceuticals
- 5.1.7. Others
- 5.2. Market Analysis, Insights and Forecast - by Types
- 5.2.1. Coal-based Activated Carbon
- 5.2.2. Wood-based Activated Carbon
- 5.2.3. Coconut-based Activated Carbon
- 5.3. Market Analysis, Insights and Forecast - by Region
- 5.3.1. North America
- 5.3.2. South America
- 5.3.3. Europe
- 5.3.4. Middle East & Africa
- 5.3.5. Asia Pacific
- 5.1. Market Analysis, Insights and Forecast - by Application
- 6. North America Activated Carbon Analysis, Insights and Forecast, 2020-2032
- 6.1. Market Analysis, Insights and Forecast - by Application
- 6.1.1. Water Treatment
- 6.1.2. Air Purification
- 6.1.3. Mercury Control
- 6.1.4. Food & Beverages
- 6.1.5. Industrial Processes
- 6.1.6. Pharmaceuticals
- 6.1.7. Others
- 6.2. Market Analysis, Insights and Forecast - by Types
- 6.2.1. Coal-based Activated Carbon
- 6.2.2. Wood-based Activated Carbon
- 6.2.3. Coconut-based Activated Carbon
- 6.1. Market Analysis, Insights and Forecast - by Application
- 7. South America Activated Carbon Analysis, Insights and Forecast, 2020-2032
- 7.1. Market Analysis, Insights and Forecast - by Application
- 7.1.1. Water Treatment
- 7.1.2. Air Purification
- 7.1.3. Mercury Control
- 7.1.4. Food & Beverages
- 7.1.5. Industrial Processes
- 7.1.6. Pharmaceuticals
- 7.1.7. Others
- 7.2. Market Analysis, Insights and Forecast - by Types
- 7.2.1. Coal-based Activated Carbon
- 7.2.2. Wood-based Activated Carbon
- 7.2.3. Coconut-based Activated Carbon
- 7.1. Market Analysis, Insights and Forecast - by Application
- 8. Europe Activated Carbon Analysis, Insights and Forecast, 2020-2032
- 8.1. Market Analysis, Insights and Forecast - by Application
- 8.1.1. Water Treatment
- 8.1.2. Air Purification
- 8.1.3. Mercury Control
- 8.1.4. Food & Beverages
- 8.1.5. Industrial Processes
- 8.1.6. Pharmaceuticals
- 8.1.7. Others
- 8.2. Market Analysis, Insights and Forecast - by Types
- 8.2.1. Coal-based Activated Carbon
- 8.2.2. Wood-based Activated Carbon
- 8.2.3. Coconut-based Activated Carbon
- 8.1. Market Analysis, Insights and Forecast - by Application
- 9. Middle East & Africa Activated Carbon Analysis, Insights and Forecast, 2020-2032
- 9.1. Market Analysis, Insights and Forecast - by Application
- 9.1.1. Water Treatment
- 9.1.2. Air Purification
- 9.1.3. Mercury Control
- 9.1.4. Food & Beverages
- 9.1.5. Industrial Processes
- 9.1.6. Pharmaceuticals
- 9.1.7. Others
- 9.2. Market Analysis, Insights and Forecast - by Types
- 9.2.1. Coal-based Activated Carbon
- 9.2.2. Wood-based Activated Carbon
- 9.2.3. Coconut-based Activated Carbon
- 9.1. Market Analysis, Insights and Forecast - by Application
- 10. Asia Pacific Activated Carbon Analysis, Insights and Forecast, 2020-2032
- 10.1. Market Analysis, Insights and Forecast - by Application
- 10.1.1. Water Treatment
- 10.1.2. Air Purification
- 10.1.3. Mercury Control
- 10.1.4. Food & Beverages
- 10.1.5. Industrial Processes
- 10.1.6. Pharmaceuticals
- 10.1.7. Others
- 10.2. Market Analysis, Insights and Forecast - by Types
- 10.2.1. Coal-based Activated Carbon
- 10.2.2. Wood-based Activated Carbon
- 10.2.3. Coconut-based Activated Carbon
- 10.1. Market Analysis, Insights and Forecast - by Application
- 11. Competitive Analysis
- 11.1. Global Market Share Analysis 2025
- 11.2. Company Profiles
- 11.2.1 Ingevity Corporation
- 11.2.1.1. Overview
- 11.2.1.2. Products
- 11.2.1.3. SWOT Analysis
- 11.2.1.4. Recent Developments
- 11.2.1.5. Financials (Based on Availability)
- 11.2.2 Kuraray
- 11.2.2.1. Overview
- 11.2.2.2. Products
- 11.2.2.3. SWOT Analysis
- 11.2.2.4. Recent Developments
- 11.2.2.5. Financials (Based on Availability)
- 11.2.3 Jacobi Carbons
- 11.2.3.1. Overview
- 11.2.3.2. Products
- 11.2.3.3. SWOT Analysis
- 11.2.3.4. Recent Developments
- 11.2.3.5. Financials (Based on Availability)
- 11.2.4 Norit
- 11.2.4.1. Overview
- 11.2.4.2. Products
- 11.2.4.3. SWOT Analysis
- 11.2.4.4. Recent Developments
- 11.2.4.5. Financials (Based on Availability)
- 11.2.5 Haycarb
- 11.2.5.1. Overview
- 11.2.5.2. Products
- 11.2.5.3. SWOT Analysis
- 11.2.5.4. Recent Developments
- 11.2.5.5. Financials (Based on Availability)
- 11.2.6 Fujian Yuanli Active Carbon
- 11.2.6.1. Overview
- 11.2.6.2. Products
- 11.2.6.3. SWOT Analysis
- 11.2.6.4. Recent Developments
- 11.2.6.5. Financials (Based on Availability)
- 11.2.7 Futamura Chemical
- 11.2.7.1. Overview
- 11.2.7.2. Products
- 11.2.7.3. SWOT Analysis
- 11.2.7.4. Recent Developments
- 11.2.7.5. Financials (Based on Availability)
- 11.2.8 MuLinSen Activated Carbon
- 11.2.8.1. Overview
- 11.2.8.2. Products
- 11.2.8.3. SWOT Analysis
- 11.2.8.4. Recent Developments
- 11.2.8.5. Financials (Based on Availability)
- 11.2.9 China Energy Investment Corporation
- 11.2.9.1. Overview
- 11.2.9.2. Products
- 11.2.9.3. SWOT Analysis
- 11.2.9.4. Recent Developments
- 11.2.9.5. Financials (Based on Availability)
- 11.2.10 Datong Coal Jinding Activated Carbon
- 11.2.10.1. Overview
- 11.2.10.2. Products
- 11.2.10.3. SWOT Analysis
- 11.2.10.4. Recent Developments
- 11.2.10.5. Financials (Based on Availability)
- 11.2.11 Boyce Carbon
- 11.2.11.1. Overview
- 11.2.11.2. Products
- 11.2.11.3. SWOT Analysis
- 11.2.11.4. Recent Developments
- 11.2.11.5. Financials (Based on Availability)
- 11.2.12 Core Carbons
- 11.2.12.1. Overview
- 11.2.12.2. Products
- 11.2.12.3. SWOT Analysis
- 11.2.12.4. Recent Developments
- 11.2.12.5. Financials (Based on Availability)
- 11.2.13 Ningxia Huahui Activated Carbon
- 11.2.13.1. Overview
- 11.2.13.2. Products
- 11.2.13.3. SWOT Analysis
- 11.2.13.4. Recent Developments
- 11.2.13.5. Financials (Based on Availability)
- 11.2.14 Philippine Japan Active Carbon Corp
- 11.2.14.1. Overview
- 11.2.14.2. Products
- 11.2.14.3. SWOT Analysis
- 11.2.14.4. Recent Developments
- 11.2.14.5. Financials (Based on Availability)
- 11.2.15 Fujian Xinsen Carbon
- 11.2.15.1. Overview
- 11.2.15.2. Products
- 11.2.15.3. SWOT Analysis
- 11.2.15.4. Recent Developments
- 11.2.15.5. Financials (Based on Availability)
- 11.2.16 DESOTEC Activated Carbon
- 11.2.16.1. Overview
- 11.2.16.2. Products
- 11.2.16.3. SWOT Analysis
- 11.2.16.4. Recent Developments
- 11.2.16.5. Financials (Based on Availability)
- 11.2.17 Shanxi Xinhua Chemical
- 11.2.17.1. Overview
- 11.2.17.2. Products
- 11.2.17.3. SWOT Analysis
- 11.2.17.4. Recent Developments
- 11.2.17.5. Financials (Based on Availability)
- 11.2.18 Silcarbon Aktivkohle GmbH
- 11.2.18.1. Overview
- 11.2.18.2. Products
- 11.2.18.3. SWOT Analysis
- 11.2.18.4. Recent Developments
- 11.2.18.5. Financials (Based on Availability)
- 11.2.19 CarboTech AC GmbH
- 11.2.19.1. Overview
- 11.2.19.2. Products
- 11.2.19.3. SWOT Analysis
- 11.2.19.4. Recent Developments
- 11.2.19.5. Financials (Based on Availability)
- 11.2.20 Active Char Products
- 11.2.20.1. Overview
- 11.2.20.2. Products
- 11.2.20.3. SWOT Analysis
- 11.2.20.4. Recent Developments
- 11.2.20.5. Financials (Based on Availability)
- 11.2.21 Donau Carbon
- 11.2.21.1. Overview
- 11.2.21.2. Products
- 11.2.21.3. SWOT Analysis
- 11.2.21.4. Recent Developments
- 11.2.21.5. Financials (Based on Availability)
- 11.2.22 Fujian Zhixing
- 11.2.22.1. Overview
- 11.2.22.2. Products
- 11.2.22.3. SWOT Analysis
- 11.2.22.4. Recent Developments
- 11.2.22.5. Financials (Based on Availability)
- 11.2.1 Ingevity Corporation
List of Figures
- Figure 1: Global Activated Carbon Revenue Breakdown (million, %) by Region 2025 & 2033
- Figure 2: North America Activated Carbon Revenue (million), by Application 2025 & 2033
- Figure 3: North America Activated Carbon Revenue Share (%), by Application 2025 & 2033
- Figure 4: North America Activated Carbon Revenue (million), by Types 2025 & 2033
- Figure 5: North America Activated Carbon Revenue Share (%), by Types 2025 & 2033
- Figure 6: North America Activated Carbon Revenue (million), by Country 2025 & 2033
- Figure 7: North America Activated Carbon Revenue Share (%), by Country 2025 & 2033
- Figure 8: South America Activated Carbon Revenue (million), by Application 2025 & 2033
- Figure 9: South America Activated Carbon Revenue Share (%), by Application 2025 & 2033
- Figure 10: South America Activated Carbon Revenue (million), by Types 2025 & 2033
- Figure 11: South America Activated Carbon Revenue Share (%), by Types 2025 & 2033
- Figure 12: South America Activated Carbon Revenue (million), by Country 2025 & 2033
- Figure 13: South America Activated Carbon Revenue Share (%), by Country 2025 & 2033
- Figure 14: Europe Activated Carbon Revenue (million), by Application 2025 & 2033
- Figure 15: Europe Activated Carbon Revenue Share (%), by Application 2025 & 2033
- Figure 16: Europe Activated Carbon Revenue (million), by Types 2025 & 2033
- Figure 17: Europe Activated Carbon Revenue Share (%), by Types 2025 & 2033
- Figure 18: Europe Activated Carbon Revenue (million), by Country 2025 & 2033
- Figure 19: Europe Activated Carbon Revenue Share (%), by Country 2025 & 2033
- Figure 20: Middle East & Africa Activated Carbon Revenue (million), by Application 2025 & 2033
- Figure 21: Middle East & Africa Activated Carbon Revenue Share (%), by Application 2025 & 2033
- Figure 22: Middle East & Africa Activated Carbon Revenue (million), by Types 2025 & 2033
- Figure 23: Middle East & Africa Activated Carbon Revenue Share (%), by Types 2025 & 2033
- Figure 24: Middle East & Africa Activated Carbon Revenue (million), by Country 2025 & 2033
- Figure 25: Middle East & Africa Activated Carbon Revenue Share (%), by Country 2025 & 2033
- Figure 26: Asia Pacific Activated Carbon Revenue (million), by Application 2025 & 2033
- Figure 27: Asia Pacific Activated Carbon Revenue Share (%), by Application 2025 & 2033
- Figure 28: Asia Pacific Activated Carbon Revenue (million), by Types 2025 & 2033
- Figure 29: Asia Pacific Activated Carbon Revenue Share (%), by Types 2025 & 2033
- Figure 30: Asia Pacific Activated Carbon Revenue (million), by Country 2025 & 2033
- Figure 31: Asia Pacific Activated Carbon Revenue Share (%), by Country 2025 & 2033
List of Tables
- Table 1: Global Activated Carbon Revenue million Forecast, by Application 2020 & 2033
- Table 2: Global Activated Carbon Revenue million Forecast, by Types 2020 & 2033
- Table 3: Global Activated Carbon Revenue million Forecast, by Region 2020 & 2033
- Table 4: Global Activated Carbon Revenue million Forecast, by Application 2020 & 2033
- Table 5: Global Activated Carbon Revenue million Forecast, by Types 2020 & 2033
- Table 6: Global Activated Carbon Revenue million Forecast, by Country 2020 & 2033
- Table 7: United States Activated Carbon Revenue (million) Forecast, by Application 2020 & 2033
- Table 8: Canada Activated Carbon Revenue (million) Forecast, by Application 2020 & 2033
- Table 9: Mexico Activated Carbon Revenue (million) Forecast, by Application 2020 & 2033
- Table 10: Global Activated Carbon Revenue million Forecast, by Application 2020 & 2033
- Table 11: Global Activated Carbon Revenue million Forecast, by Types 2020 & 2033
- Table 12: Global Activated Carbon Revenue million Forecast, by Country 2020 & 2033
- Table 13: Brazil Activated Carbon Revenue (million) Forecast, by Application 2020 & 2033
- Table 14: Argentina Activated Carbon Revenue (million) Forecast, by Application 2020 & 2033
- Table 15: Rest of South America Activated Carbon Revenue (million) Forecast, by Application 2020 & 2033
- Table 16: Global Activated Carbon Revenue million Forecast, by Application 2020 & 2033
- Table 17: Global Activated Carbon Revenue million Forecast, by Types 2020 & 2033
- Table 18: Global Activated Carbon Revenue million Forecast, by Country 2020 & 2033
- Table 19: United Kingdom Activated Carbon Revenue (million) Forecast, by Application 2020 & 2033
- Table 20: Germany Activated Carbon Revenue (million) Forecast, by Application 2020 & 2033
- Table 21: France Activated Carbon Revenue (million) Forecast, by Application 2020 & 2033
- Table 22: Italy Activated Carbon Revenue (million) Forecast, by Application 2020 & 2033
- Table 23: Spain Activated Carbon Revenue (million) Forecast, by Application 2020 & 2033
- Table 24: Russia Activated Carbon Revenue (million) Forecast, by Application 2020 & 2033
- Table 25: Benelux Activated Carbon Revenue (million) Forecast, by Application 2020 & 2033
- Table 26: Nordics Activated Carbon Revenue (million) Forecast, by Application 2020 & 2033
- Table 27: Rest of Europe Activated Carbon Revenue (million) Forecast, by Application 2020 & 2033
- Table 28: Global Activated Carbon Revenue million Forecast, by Application 2020 & 2033
- Table 29: Global Activated Carbon Revenue million Forecast, by Types 2020 & 2033
- Table 30: Global Activated Carbon Revenue million Forecast, by Country 2020 & 2033
- Table 31: Turkey Activated Carbon Revenue (million) Forecast, by Application 2020 & 2033
- Table 32: Israel Activated Carbon Revenue (million) Forecast, by Application 2020 & 2033
- Table 33: GCC Activated Carbon Revenue (million) Forecast, by Application 2020 & 2033
- Table 34: North Africa Activated Carbon Revenue (million) Forecast, by Application 2020 & 2033
- Table 35: South Africa Activated Carbon Revenue (million) Forecast, by Application 2020 & 2033
- Table 36: Rest of Middle East & Africa Activated Carbon Revenue (million) Forecast, by Application 2020 & 2033
- Table 37: Global Activated Carbon Revenue million Forecast, by Application 2020 & 2033
- Table 38: Global Activated Carbon Revenue million Forecast, by Types 2020 & 2033
- Table 39: Global Activated Carbon Revenue million Forecast, by Country 2020 & 2033
- Table 40: China Activated Carbon Revenue (million) Forecast, by Application 2020 & 2033
- Table 41: India Activated Carbon Revenue (million) Forecast, by Application 2020 & 2033
- Table 42: Japan Activated Carbon Revenue (million) Forecast, by Application 2020 & 2033
- Table 43: South Korea Activated Carbon Revenue (million) Forecast, by Application 2020 & 2033
- Table 44: ASEAN Activated Carbon Revenue (million) Forecast, by Application 2020 & 2033
- Table 45: Oceania Activated Carbon Revenue (million) Forecast, by Application 2020 & 2033
- Table 46: Rest of Asia Pacific Activated Carbon Revenue (million) Forecast, by Application 2020 & 2033
Frequently Asked Questions
1. What is the projected Compound Annual Growth Rate (CAGR) of the Activated Carbon?
The projected CAGR is approximately 2%.
2. Which companies are prominent players in the Activated Carbon?
Key companies in the market include Ingevity Corporation, Kuraray, Jacobi Carbons, Norit, Haycarb, Fujian Yuanli Active Carbon, Futamura Chemical, MuLinSen Activated Carbon, China Energy Investment Corporation, Datong Coal Jinding Activated Carbon, Boyce Carbon, Core Carbons, Ningxia Huahui Activated Carbon, Philippine Japan Active Carbon Corp, Fujian Xinsen Carbon, DESOTEC Activated Carbon, Shanxi Xinhua Chemical, Silcarbon Aktivkohle GmbH, CarboTech AC GmbH, Active Char Products, Donau Carbon, Fujian Zhixing.
3. What are the main segments of the Activated Carbon?
The market segments include Application, Types.
4. Can you provide details about the market size?
The market size is estimated to be USD 4480 million as of 2022.
5. What are some drivers contributing to market growth?
N/A
6. What are the notable trends driving market growth?
N/A
7. Are there any restraints impacting market growth?
N/A
8. Can you provide examples of recent developments in the market?
N/A
9. What pricing options are available for accessing the report?
Pricing options include single-user, multi-user, and enterprise licenses priced at USD 4900.00, USD 7350.00, and USD 9800.00 respectively.
10. Is the market size provided in terms of value or volume?
The market size is provided in terms of value, measured in million.
11. Are there any specific market keywords associated with the report?
Yes, the market keyword associated with the report is "Activated Carbon," which aids in identifying and referencing the specific market segment covered.
12. How do I determine which pricing option suits my needs best?
The pricing options vary based on user requirements and access needs. Individual users may opt for single-user licenses, while businesses requiring broader access may choose multi-user or enterprise licenses for cost-effective access to the report.
13. Are there any additional resources or data provided in the Activated Carbon report?
While the report offers comprehensive insights, it's advisable to review the specific contents or supplementary materials provided to ascertain if additional resources or data are available.
14. How can I stay updated on further developments or reports in the Activated Carbon?
To stay informed about further developments, trends, and reports in the Activated Carbon, consider subscribing to industry newsletters, following relevant companies and organizations, or regularly checking reputable industry news sources and publications.
Methodology
Step 1 - Identification of Relevant Samples Size from Population Database


Step 2 - Approaches for Defining Global Market Size (Value, Volume* & Price*)

Note*: In applicable scenarios
Step 3 - Data Sources
Primary Research
- Web Analytics
- Survey Reports
- Research Institute
- Latest Research Reports
- Opinion Leaders
Secondary Research
- Annual Reports
- White Paper
- Latest Press Release
- Industry Association
- Paid Database
- Investor Presentations

Step 4 - Data Triangulation
Involves using different sources of information in order to increase the validity of a study
These sources are likely to be stakeholders in a program - participants, other researchers, program staff, other community members, and so on.
Then we put all data in single framework & apply various statistical tools to find out the dynamic on the market.
During the analysis stage, feedback from the stakeholder groups would be compared to determine areas of agreement as well as areas of divergence

