
Key Insights
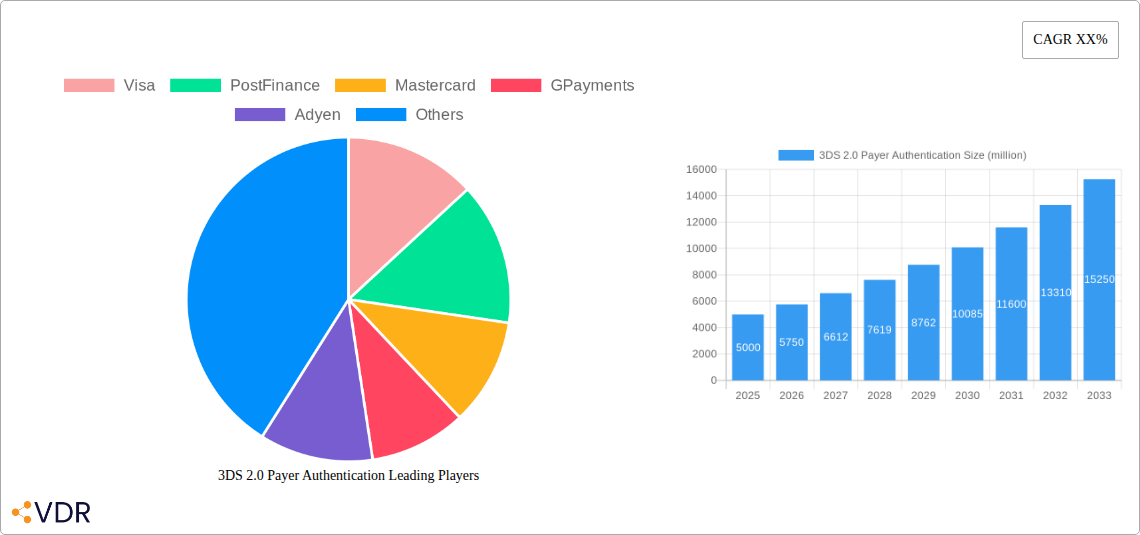
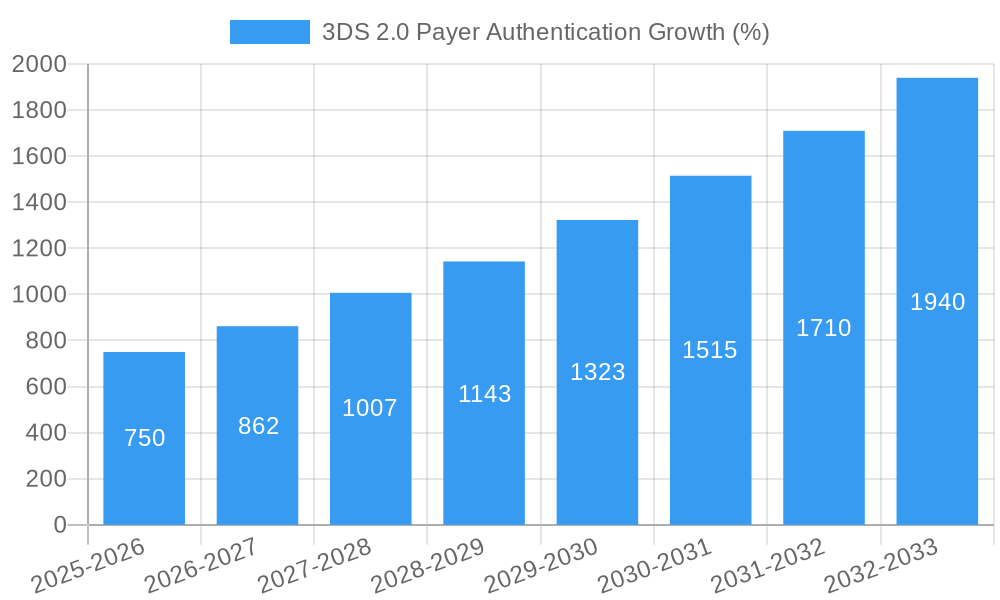
The 3DS 2.0 payer authentication market is experiencing robust growth, driven by increasing e-commerce transactions and a rising need for enhanced security against fraudulent activities. The shift towards frictionless authentication methods, while maintaining strong security protocols, is a key trend shaping market dynamics. Major players like Visa, Mastercard, and others are heavily invested in developing and deploying 3DS 2.0 solutions, fostering wider adoption across various industries. The market's expansion is fueled by regulatory mandates enforcing stronger customer authentication, particularly within the European Union's PSD2 framework and similar regulations globally. This necessitates businesses to upgrade their payment systems to comply and benefit from reduced fraud rates and increased customer trust. The competition amongst providers is intense, focusing on innovation in areas such as biometric authentication, risk-based authentication, and improved user experience. While initial adoption faced hurdles related to integration complexity, these challenges are being mitigated through streamlined solutions and increased expertise within the industry. Growth is expected to be particularly strong in regions with high e-commerce penetration and strong regulatory frameworks supporting digital transactions. We estimate the market size in 2025 to be around $5 billion, growing at a CAGR of 15% over the forecast period.
The forecast period of 2025-2033 will witness continued growth, primarily fueled by increasing mobile commerce adoption, the expansion of digital payment ecosystems in emerging markets, and the ongoing development of more sophisticated fraud prevention techniques integrated into 3DS 2.0 solutions. Growth might experience minor fluctuations depending on economic conditions and technological advancements, but the overall trajectory suggests continued expansion. The segment encompassing risk-based authentication is projected to maintain significant growth due to its capability to balance security and user experience. Furthermore, partnerships between payment processors, technology providers, and merchants will play a vital role in driving widespread adoption and facilitating seamless integration of 3DS 2.0 technology. This collaboration allows for smoother user experience without compromising security and fosters a more secure online environment for all stakeholders.
3DS 2.0 Payer Authentication Market Report: 2019-2033
This comprehensive report provides an in-depth analysis of the 3DS 2.0 Payer Authentication market, encompassing market dynamics, growth trends, regional dominance, product landscape, key players, and future outlook. The report covers the period 2019-2033, with a focus on the forecast period 2025-2033 and a base year of 2025. This report is invaluable for industry professionals, investors, and businesses seeking to understand and navigate this rapidly evolving landscape. The parent market is the overall Payment Authentication market, while the child market is specifically 3DS 2.0 authentication solutions. The global market size in 2025 is estimated at $XX million.
3DS 2.0 Payer Authentication Market Dynamics & Structure
This section analyzes the competitive landscape, technological advancements, regulatory influences, and market trends within the 3DS 2.0 Payer Authentication market. The analysis includes quantitative data on market share and M&A activity, as well as qualitative insights into innovation barriers and market concentration.
- Market Concentration: The market is moderately concentrated, with key players like Visa, Mastercard, and American Express holding significant shares, but with considerable room for smaller players to thrive. In 2025, the top 5 players are estimated to hold approximately 60% of the market share.
- Technological Innovation: Continuous innovation in authentication technologies, including biometric authentication and AI-driven fraud detection, is a key driver of market growth. However, integration complexities and security concerns present significant barriers to entry for new technologies.
- Regulatory Frameworks: Stricter regulations regarding data privacy (e.g., PSD2) and fraud prevention are driving adoption of 3DS 2.0, but also increase compliance costs for businesses.
- Competitive Product Substitutes: While 3DS 2.0 is becoming a standard, competition comes from emerging authentication methods like tokenization and passwordless authentication. The market is shifting to a multi-layered approach, rather than being fully replaced.
- End-User Demographics: The market is driven by increasing e-commerce adoption, rising mobile payments, and a growing demand for secure online transactions across diverse demographics.
- M&A Trends: The past five years have seen xx M&A deals in this space, with larger players acquiring smaller firms to enhance their technology and market reach. This trend is expected to continue.
3DS 2.0 Payer Authentication Growth Trends & Insights
This section leverages comprehensive market research to provide an in-depth analysis of market size evolution, adoption rates, technological disruptions, and consumer behavior shifts, using both quantitative and qualitative data.
The global 3DS 2.0 Payer Authentication market witnessed a CAGR of xx% during the historical period (2019-2024). Market penetration has been increasing steadily, reaching xx% in 2025. The market is projected to grow at a CAGR of xx% during the forecast period (2025-2033), reaching an estimated $XX million by 2033. Technological disruptions, such as the rise of biometric authentication and improved fraud detection capabilities, have significantly accelerated adoption rates. Simultaneously, consumer demand for enhanced security and convenience is driving market growth. Factors such as the increasing preference for contactless payments, the growing adoption of mobile wallets, and a heightened awareness of online security threats are shaping consumer behavior and driving the demand for robust authentication solutions.
Dominant Regions, Countries, or Segments in 3DS 2.0 Payer Authentication
This section identifies the leading regions and segments driving market growth, providing an in-depth analysis of their dominance factors, including market share and growth potential.
North America currently holds the largest market share, followed by Europe and Asia-Pacific. The high adoption of e-commerce and the stringent regulatory environment in these regions are key drivers.
- North America: Strong regulatory frameworks, high e-commerce penetration, and early adoption of advanced technologies contribute to its dominance.
- Europe: PSD2 compliance mandates are significantly driving market growth in this region.
- Asia-Pacific: Rapid growth in mobile payments and e-commerce are boosting demand, although varying levels of digital literacy and infrastructure present challenges.
3DS 2.0 Payer Authentication Product Landscape
3DS 2.0 authentication solutions offer a range of features, from basic password authentication enhancements to advanced biometric and risk-based authentication. Key improvements include reduced friction for legitimate users and enhanced fraud detection capabilities. Many providers now offer customizable solutions, allowing businesses to tailor their security measures to specific risk profiles. This flexibility and adaptability are key selling propositions. Further innovation is focusing on frictionless authentication methods, such as passwordless logins and device-based authentication, aiming to improve the user experience without compromising security.
Key Drivers, Barriers & Challenges in 3DS 2.0 Payer Authentication
Key Drivers: Increasing e-commerce transactions, stringent regulations (e.g., PSD2), rising mobile payments, and growing consumer awareness of online security threats are propelling market growth. Technological advancements, like AI-powered fraud detection, are further accelerating adoption.
Key Challenges: Integration complexities with existing systems, high implementation costs, and the constant evolution of fraud techniques pose significant challenges. Furthermore, concerns about data privacy and the need for user-friendly authentication methods continue to impact adoption. The challenge is to maintain high security while minimizing user friction. The estimated cost of non-compliance with regulatory frameworks currently costs the market $XX million annually.
Emerging Opportunities in 3DS 2.0 Payer Authentication
Emerging opportunities lie in untapped markets (e.g., developing economies), the integration of 3DS 2.0 with emerging technologies (e.g., IoT, blockchain), and the development of user-friendly, frictionless authentication methods. Personalized authentication experiences based on individual risk profiles and behavioral biometrics are also promising areas of growth.
Growth Accelerators in the 3DS 2.0 Payer Authentication Industry
Strategic partnerships between technology providers and financial institutions, coupled with continuous technological innovation (such as advancements in biometrics and AI-powered fraud detection), are key accelerators. Expansion into underserved markets and the development of tailored solutions for specific industries (e.g., healthcare, government) will further fuel market growth.
Key Players Shaping the 3DS 2.0 Payer Authentication Market
- Visa
- PostFinance
- Mastercard
- GPayments
- Adyen
- Broadcom
- Modirum
- Entersekt
- Worldline
- Elavon
- SIA S.p.A.
- GMO Payment Gateway
- UnionPay International
- AsiaPay
- Discover Global Network
- JCB
- American Express
Notable Milestones in 3DS 2.0 Payer Authentication Sector
- 2019: Wide-scale adoption of 3DS 2.0 begins across major payment networks.
- 2020: Increased focus on biometric authentication and passwordless login solutions.
- 2021: Significant rise in M&A activity among key players.
- 2022: Growing adoption of AI-powered fraud detection systems.
- 2023: Emerging focus on frictionless user experiences alongside enhanced security.
- 2024: Regulations push adoption among smaller businesses.
- 2025: Market consolidation with continued focus on innovation.
In-Depth 3DS 2.0 Payer Authentication Market Outlook
The 3DS 2.0 Payer Authentication market is poised for continued robust growth, driven by increasing digital transactions, stringent security regulations, and the ongoing development of innovative authentication technologies. Strategic partnerships, expansion into new markets, and the focus on enhancing user experience while maintaining high security levels will be critical for success in this dynamic market. The long-term growth potential is significant, offering attractive opportunities for established players and new entrants alike.
3DS 2.0 Payer Authentication Segmentation
-
1. Application
- 1.1. ATM
- 1.2. POS Machine
- 1.3. Other
-
2. Types
- 2.1. SMS Verification
- 2.2. Fingerprint Recognition
- 2.3. Face Recognition
- 2.4. Others
3DS 2.0 Payer Authentication Segmentation By Geography
-
1. North America
- 1.1. United States
- 1.2. Canada
- 1.3. Mexico
-
2. South America
- 2.1. Brazil
- 2.2. Argentina
- 2.3. Rest of South America
-
3. Europe
- 3.1. United Kingdom
- 3.2. Germany
- 3.3. France
- 3.4. Italy
- 3.5. Spain
- 3.6. Russia
- 3.7. Benelux
- 3.8. Nordics
- 3.9. Rest of Europe
-
4. Middle East & Africa
- 4.1. Turkey
- 4.2. Israel
- 4.3. GCC
- 4.4. North Africa
- 4.5. South Africa
- 4.6. Rest of Middle East & Africa
-
5. Asia Pacific
- 5.1. China
- 5.2. India
- 5.3. Japan
- 5.4. South Korea
- 5.5. ASEAN
- 5.6. Oceania
- 5.7. Rest of Asia Pacific

3DS 2.0 Payer Authentication REPORT HIGHLIGHTS
| Aspects | Details |
|---|---|
| Study Period | 2019-2033 |
| Base Year | 2024 |
| Estimated Year | 2025 |
| Forecast Period | 2025-2033 |
| Historical Period | 2019-2024 |
| Growth Rate | CAGR of XX% from 2019-2033 |
| Segmentation |
|
Table of Contents
- 1. Introduction
- 1.1. Research Scope
- 1.2. Market Segmentation
- 1.3. Research Methodology
- 1.4. Definitions and Assumptions
- 2. Executive Summary
- 2.1. Introduction
- 3. Market Dynamics
- 3.1. Introduction
- 3.2. Market Drivers
- 3.3. Market Restrains
- 3.4. Market Trends
- 4. Market Factor Analysis
- 4.1. Porters Five Forces
- 4.2. Supply/Value Chain
- 4.3. PESTEL analysis
- 4.4. Market Entropy
- 4.5. Patent/Trademark Analysis
- 5. Global 3DS 2.0 Payer Authentication Analysis, Insights and Forecast, 2019-2031
- 5.1. Market Analysis, Insights and Forecast - by Application
- 5.1.1. ATM
- 5.1.2. POS Machine
- 5.1.3. Other
- 5.2. Market Analysis, Insights and Forecast - by Types
- 5.2.1. SMS Verification
- 5.2.2. Fingerprint Recognition
- 5.2.3. Face Recognition
- 5.2.4. Others
- 5.3. Market Analysis, Insights and Forecast - by Region
- 5.3.1. North America
- 5.3.2. South America
- 5.3.3. Europe
- 5.3.4. Middle East & Africa
- 5.3.5. Asia Pacific
- 5.1. Market Analysis, Insights and Forecast - by Application
- 6. North America 3DS 2.0 Payer Authentication Analysis, Insights and Forecast, 2019-2031
- 6.1. Market Analysis, Insights and Forecast - by Application
- 6.1.1. ATM
- 6.1.2. POS Machine
- 6.1.3. Other
- 6.2. Market Analysis, Insights and Forecast - by Types
- 6.2.1. SMS Verification
- 6.2.2. Fingerprint Recognition
- 6.2.3. Face Recognition
- 6.2.4. Others
- 6.1. Market Analysis, Insights and Forecast - by Application
- 7. South America 3DS 2.0 Payer Authentication Analysis, Insights and Forecast, 2019-2031
- 7.1. Market Analysis, Insights and Forecast - by Application
- 7.1.1. ATM
- 7.1.2. POS Machine
- 7.1.3. Other
- 7.2. Market Analysis, Insights and Forecast - by Types
- 7.2.1. SMS Verification
- 7.2.2. Fingerprint Recognition
- 7.2.3. Face Recognition
- 7.2.4. Others
- 7.1. Market Analysis, Insights and Forecast - by Application
- 8. Europe 3DS 2.0 Payer Authentication Analysis, Insights and Forecast, 2019-2031
- 8.1. Market Analysis, Insights and Forecast - by Application
- 8.1.1. ATM
- 8.1.2. POS Machine
- 8.1.3. Other
- 8.2. Market Analysis, Insights and Forecast - by Types
- 8.2.1. SMS Verification
- 8.2.2. Fingerprint Recognition
- 8.2.3. Face Recognition
- 8.2.4. Others
- 8.1. Market Analysis, Insights and Forecast - by Application
- 9. Middle East & Africa 3DS 2.0 Payer Authentication Analysis, Insights and Forecast, 2019-2031
- 9.1. Market Analysis, Insights and Forecast - by Application
- 9.1.1. ATM
- 9.1.2. POS Machine
- 9.1.3. Other
- 9.2. Market Analysis, Insights and Forecast - by Types
- 9.2.1. SMS Verification
- 9.2.2. Fingerprint Recognition
- 9.2.3. Face Recognition
- 9.2.4. Others
- 9.1. Market Analysis, Insights and Forecast - by Application
- 10. Asia Pacific 3DS 2.0 Payer Authentication Analysis, Insights and Forecast, 2019-2031
- 10.1. Market Analysis, Insights and Forecast - by Application
- 10.1.1. ATM
- 10.1.2. POS Machine
- 10.1.3. Other
- 10.2. Market Analysis, Insights and Forecast - by Types
- 10.2.1. SMS Verification
- 10.2.2. Fingerprint Recognition
- 10.2.3. Face Recognition
- 10.2.4. Others
- 10.1. Market Analysis, Insights and Forecast - by Application
- 11. Competitive Analysis
- 11.1. Global Market Share Analysis 2024
- 11.2. Company Profiles
- 11.2.1 Visa
- 11.2.1.1. Overview
- 11.2.1.2. Products
- 11.2.1.3. SWOT Analysis
- 11.2.1.4. Recent Developments
- 11.2.1.5. Financials (Based on Availability)
- 11.2.2 PostFinance
- 11.2.2.1. Overview
- 11.2.2.2. Products
- 11.2.2.3. SWOT Analysis
- 11.2.2.4. Recent Developments
- 11.2.2.5. Financials (Based on Availability)
- 11.2.3 Mastercard
- 11.2.3.1. Overview
- 11.2.3.2. Products
- 11.2.3.3. SWOT Analysis
- 11.2.3.4. Recent Developments
- 11.2.3.5. Financials (Based on Availability)
- 11.2.4 GPayments
- 11.2.4.1. Overview
- 11.2.4.2. Products
- 11.2.4.3. SWOT Analysis
- 11.2.4.4. Recent Developments
- 11.2.4.5. Financials (Based on Availability)
- 11.2.5 Adyen
- 11.2.5.1. Overview
- 11.2.5.2. Products
- 11.2.5.3. SWOT Analysis
- 11.2.5.4. Recent Developments
- 11.2.5.5. Financials (Based on Availability)
- 11.2.6 Broadcom
- 11.2.6.1. Overview
- 11.2.6.2. Products
- 11.2.6.3. SWOT Analysis
- 11.2.6.4. Recent Developments
- 11.2.6.5. Financials (Based on Availability)
- 11.2.7 Modirum
- 11.2.7.1. Overview
- 11.2.7.2. Products
- 11.2.7.3. SWOT Analysis
- 11.2.7.4. Recent Developments
- 11.2.7.5. Financials (Based on Availability)
- 11.2.8 Entersekt
- 11.2.8.1. Overview
- 11.2.8.2. Products
- 11.2.8.3. SWOT Analysis
- 11.2.8.4. Recent Developments
- 11.2.8.5. Financials (Based on Availability)
- 11.2.9 Worldline
- 11.2.9.1. Overview
- 11.2.9.2. Products
- 11.2.9.3. SWOT Analysis
- 11.2.9.4. Recent Developments
- 11.2.9.5. Financials (Based on Availability)
- 11.2.10 Elavon
- 11.2.10.1. Overview
- 11.2.10.2. Products
- 11.2.10.3. SWOT Analysis
- 11.2.10.4. Recent Developments
- 11.2.10.5. Financials (Based on Availability)
- 11.2.11 SIA S.p.A.
- 11.2.11.1. Overview
- 11.2.11.2. Products
- 11.2.11.3. SWOT Analysis
- 11.2.11.4. Recent Developments
- 11.2.11.5. Financials (Based on Availability)
- 11.2.12 GMO Payment Gateway
- 11.2.12.1. Overview
- 11.2.12.2. Products
- 11.2.12.3. SWOT Analysis
- 11.2.12.4. Recent Developments
- 11.2.12.5. Financials (Based on Availability)
- 11.2.13 UnionPay International
- 11.2.13.1. Overview
- 11.2.13.2. Products
- 11.2.13.3. SWOT Analysis
- 11.2.13.4. Recent Developments
- 11.2.13.5. Financials (Based on Availability)
- 11.2.14 AsiaPay
- 11.2.14.1. Overview
- 11.2.14.2. Products
- 11.2.14.3. SWOT Analysis
- 11.2.14.4. Recent Developments
- 11.2.14.5. Financials (Based on Availability)
- 11.2.15 Discover Global Network
- 11.2.15.1. Overview
- 11.2.15.2. Products
- 11.2.15.3. SWOT Analysis
- 11.2.15.4. Recent Developments
- 11.2.15.5. Financials (Based on Availability)
- 11.2.16 JCB
- 11.2.16.1. Overview
- 11.2.16.2. Products
- 11.2.16.3. SWOT Analysis
- 11.2.16.4. Recent Developments
- 11.2.16.5. Financials (Based on Availability)
- 11.2.17 American Express
- 11.2.17.1. Overview
- 11.2.17.2. Products
- 11.2.17.3. SWOT Analysis
- 11.2.17.4. Recent Developments
- 11.2.17.5. Financials (Based on Availability)
- 11.2.1 Visa
List of Figures
- Figure 1: Global 3DS 2.0 Payer Authentication Revenue Breakdown (million, %) by Region 2024 & 2032
- Figure 2: North America 3DS 2.0 Payer Authentication Revenue (million), by Application 2024 & 2032
- Figure 3: North America 3DS 2.0 Payer Authentication Revenue Share (%), by Application 2024 & 2032
- Figure 4: North America 3DS 2.0 Payer Authentication Revenue (million), by Types 2024 & 2032
- Figure 5: North America 3DS 2.0 Payer Authentication Revenue Share (%), by Types 2024 & 2032
- Figure 6: North America 3DS 2.0 Payer Authentication Revenue (million), by Country 2024 & 2032
- Figure 7: North America 3DS 2.0 Payer Authentication Revenue Share (%), by Country 2024 & 2032
- Figure 8: South America 3DS 2.0 Payer Authentication Revenue (million), by Application 2024 & 2032
- Figure 9: South America 3DS 2.0 Payer Authentication Revenue Share (%), by Application 2024 & 2032
- Figure 10: South America 3DS 2.0 Payer Authentication Revenue (million), by Types 2024 & 2032
- Figure 11: South America 3DS 2.0 Payer Authentication Revenue Share (%), by Types 2024 & 2032
- Figure 12: South America 3DS 2.0 Payer Authentication Revenue (million), by Country 2024 & 2032
- Figure 13: South America 3DS 2.0 Payer Authentication Revenue Share (%), by Country 2024 & 2032
- Figure 14: Europe 3DS 2.0 Payer Authentication Revenue (million), by Application 2024 & 2032
- Figure 15: Europe 3DS 2.0 Payer Authentication Revenue Share (%), by Application 2024 & 2032
- Figure 16: Europe 3DS 2.0 Payer Authentication Revenue (million), by Types 2024 & 2032
- Figure 17: Europe 3DS 2.0 Payer Authentication Revenue Share (%), by Types 2024 & 2032
- Figure 18: Europe 3DS 2.0 Payer Authentication Revenue (million), by Country 2024 & 2032
- Figure 19: Europe 3DS 2.0 Payer Authentication Revenue Share (%), by Country 2024 & 2032
- Figure 20: Middle East & Africa 3DS 2.0 Payer Authentication Revenue (million), by Application 2024 & 2032
- Figure 21: Middle East & Africa 3DS 2.0 Payer Authentication Revenue Share (%), by Application 2024 & 2032
- Figure 22: Middle East & Africa 3DS 2.0 Payer Authentication Revenue (million), by Types 2024 & 2032
- Figure 23: Middle East & Africa 3DS 2.0 Payer Authentication Revenue Share (%), by Types 2024 & 2032
- Figure 24: Middle East & Africa 3DS 2.0 Payer Authentication Revenue (million), by Country 2024 & 2032
- Figure 25: Middle East & Africa 3DS 2.0 Payer Authentication Revenue Share (%), by Country 2024 & 2032
- Figure 26: Asia Pacific 3DS 2.0 Payer Authentication Revenue (million), by Application 2024 & 2032
- Figure 27: Asia Pacific 3DS 2.0 Payer Authentication Revenue Share (%), by Application 2024 & 2032
- Figure 28: Asia Pacific 3DS 2.0 Payer Authentication Revenue (million), by Types 2024 & 2032
- Figure 29: Asia Pacific 3DS 2.0 Payer Authentication Revenue Share (%), by Types 2024 & 2032
- Figure 30: Asia Pacific 3DS 2.0 Payer Authentication Revenue (million), by Country 2024 & 2032
- Figure 31: Asia Pacific 3DS 2.0 Payer Authentication Revenue Share (%), by Country 2024 & 2032
List of Tables
- Table 1: Global 3DS 2.0 Payer Authentication Revenue million Forecast, by Region 2019 & 2032
- Table 2: Global 3DS 2.0 Payer Authentication Revenue million Forecast, by Application 2019 & 2032
- Table 3: Global 3DS 2.0 Payer Authentication Revenue million Forecast, by Types 2019 & 2032
- Table 4: Global 3DS 2.0 Payer Authentication Revenue million Forecast, by Region 2019 & 2032
- Table 5: Global 3DS 2.0 Payer Authentication Revenue million Forecast, by Application 2019 & 2032
- Table 6: Global 3DS 2.0 Payer Authentication Revenue million Forecast, by Types 2019 & 2032
- Table 7: Global 3DS 2.0 Payer Authentication Revenue million Forecast, by Country 2019 & 2032
- Table 8: United States 3DS 2.0 Payer Authentication Revenue (million) Forecast, by Application 2019 & 2032
- Table 9: Canada 3DS 2.0 Payer Authentication Revenue (million) Forecast, by Application 2019 & 2032
- Table 10: Mexico 3DS 2.0 Payer Authentication Revenue (million) Forecast, by Application 2019 & 2032
- Table 11: Global 3DS 2.0 Payer Authentication Revenue million Forecast, by Application 2019 & 2032
- Table 12: Global 3DS 2.0 Payer Authentication Revenue million Forecast, by Types 2019 & 2032
- Table 13: Global 3DS 2.0 Payer Authentication Revenue million Forecast, by Country 2019 & 2032
- Table 14: Brazil 3DS 2.0 Payer Authentication Revenue (million) Forecast, by Application 2019 & 2032
- Table 15: Argentina 3DS 2.0 Payer Authentication Revenue (million) Forecast, by Application 2019 & 2032
- Table 16: Rest of South America 3DS 2.0 Payer Authentication Revenue (million) Forecast, by Application 2019 & 2032
- Table 17: Global 3DS 2.0 Payer Authentication Revenue million Forecast, by Application 2019 & 2032
- Table 18: Global 3DS 2.0 Payer Authentication Revenue million Forecast, by Types 2019 & 2032
- Table 19: Global 3DS 2.0 Payer Authentication Revenue million Forecast, by Country 2019 & 2032
- Table 20: United Kingdom 3DS 2.0 Payer Authentication Revenue (million) Forecast, by Application 2019 & 2032
- Table 21: Germany 3DS 2.0 Payer Authentication Revenue (million) Forecast, by Application 2019 & 2032
- Table 22: France 3DS 2.0 Payer Authentication Revenue (million) Forecast, by Application 2019 & 2032
- Table 23: Italy 3DS 2.0 Payer Authentication Revenue (million) Forecast, by Application 2019 & 2032
- Table 24: Spain 3DS 2.0 Payer Authentication Revenue (million) Forecast, by Application 2019 & 2032
- Table 25: Russia 3DS 2.0 Payer Authentication Revenue (million) Forecast, by Application 2019 & 2032
- Table 26: Benelux 3DS 2.0 Payer Authentication Revenue (million) Forecast, by Application 2019 & 2032
- Table 27: Nordics 3DS 2.0 Payer Authentication Revenue (million) Forecast, by Application 2019 & 2032
- Table 28: Rest of Europe 3DS 2.0 Payer Authentication Revenue (million) Forecast, by Application 2019 & 2032
- Table 29: Global 3DS 2.0 Payer Authentication Revenue million Forecast, by Application 2019 & 2032
- Table 30: Global 3DS 2.0 Payer Authentication Revenue million Forecast, by Types 2019 & 2032
- Table 31: Global 3DS 2.0 Payer Authentication Revenue million Forecast, by Country 2019 & 2032
- Table 32: Turkey 3DS 2.0 Payer Authentication Revenue (million) Forecast, by Application 2019 & 2032
- Table 33: Israel 3DS 2.0 Payer Authentication Revenue (million) Forecast, by Application 2019 & 2032
- Table 34: GCC 3DS 2.0 Payer Authentication Revenue (million) Forecast, by Application 2019 & 2032
- Table 35: North Africa 3DS 2.0 Payer Authentication Revenue (million) Forecast, by Application 2019 & 2032
- Table 36: South Africa 3DS 2.0 Payer Authentication Revenue (million) Forecast, by Application 2019 & 2032
- Table 37: Rest of Middle East & Africa 3DS 2.0 Payer Authentication Revenue (million) Forecast, by Application 2019 & 2032
- Table 38: Global 3DS 2.0 Payer Authentication Revenue million Forecast, by Application 2019 & 2032
- Table 39: Global 3DS 2.0 Payer Authentication Revenue million Forecast, by Types 2019 & 2032
- Table 40: Global 3DS 2.0 Payer Authentication Revenue million Forecast, by Country 2019 & 2032
- Table 41: China 3DS 2.0 Payer Authentication Revenue (million) Forecast, by Application 2019 & 2032
- Table 42: India 3DS 2.0 Payer Authentication Revenue (million) Forecast, by Application 2019 & 2032
- Table 43: Japan 3DS 2.0 Payer Authentication Revenue (million) Forecast, by Application 2019 & 2032
- Table 44: South Korea 3DS 2.0 Payer Authentication Revenue (million) Forecast, by Application 2019 & 2032
- Table 45: ASEAN 3DS 2.0 Payer Authentication Revenue (million) Forecast, by Application 2019 & 2032
- Table 46: Oceania 3DS 2.0 Payer Authentication Revenue (million) Forecast, by Application 2019 & 2032
- Table 47: Rest of Asia Pacific 3DS 2.0 Payer Authentication Revenue (million) Forecast, by Application 2019 & 2032
Frequently Asked Questions
1. What is the projected Compound Annual Growth Rate (CAGR) of the 3DS 2.0 Payer Authentication?
The projected CAGR is approximately XX%.
2. Which companies are prominent players in the 3DS 2.0 Payer Authentication?
Key companies in the market include Visa, PostFinance, Mastercard, GPayments, Adyen, Broadcom, Modirum, Entersekt, Worldline, Elavon, SIA S.p.A., GMO Payment Gateway, UnionPay International, AsiaPay, Discover Global Network, JCB, American Express.
3. What are the main segments of the 3DS 2.0 Payer Authentication?
The market segments include Application, Types.
4. Can you provide details about the market size?
The market size is estimated to be USD XXX million as of 2022.
5. What are some drivers contributing to market growth?
N/A
6. What are the notable trends driving market growth?
N/A
7. Are there any restraints impacting market growth?
N/A
8. Can you provide examples of recent developments in the market?
N/A
9. What pricing options are available for accessing the report?
Pricing options include single-user, multi-user, and enterprise licenses priced at USD 3350.00, USD 5025.00, and USD 6700.00 respectively.
10. Is the market size provided in terms of value or volume?
The market size is provided in terms of value, measured in million.
11. Are there any specific market keywords associated with the report?
Yes, the market keyword associated with the report is "3DS 2.0 Payer Authentication," which aids in identifying and referencing the specific market segment covered.
12. How do I determine which pricing option suits my needs best?
The pricing options vary based on user requirements and access needs. Individual users may opt for single-user licenses, while businesses requiring broader access may choose multi-user or enterprise licenses for cost-effective access to the report.
13. Are there any additional resources or data provided in the 3DS 2.0 Payer Authentication report?
While the report offers comprehensive insights, it's advisable to review the specific contents or supplementary materials provided to ascertain if additional resources or data are available.
14. How can I stay updated on further developments or reports in the 3DS 2.0 Payer Authentication?
To stay informed about further developments, trends, and reports in the 3DS 2.0 Payer Authentication, consider subscribing to industry newsletters, following relevant companies and organizations, or regularly checking reputable industry news sources and publications.
Methodology
Step 1 - Identification of Relevant Samples Size from Population Database


Step 2 - Approaches for Defining Global Market Size (Value, Volume* & Price*)

Note*: In applicable scenarios
Step 3 - Data Sources
Primary Research
- Web Analytics
- Survey Reports
- Research Institute
- Latest Research Reports
- Opinion Leaders
Secondary Research
- Annual Reports
- White Paper
- Latest Press Release
- Industry Association
- Paid Database
- Investor Presentations

Step 4 - Data Triangulation
Involves using different sources of information in order to increase the validity of a study
These sources are likely to be stakeholders in a program - participants, other researchers, program staff, other community members, and so on.
Then we put all data in single framework & apply various statistical tools to find out the dynamic on the market.
During the analysis stage, feedback from the stakeholder groups would be compared to determine areas of agreement as well as areas of divergence


